How to Improve Website Conversion Rates: Unlock Growth
Struggling with low conversions? Learn how to improve website conversion rates. Our guide covers diagnosis, A/B testing, and measuring business impact.

The worst advice on conversion rate optimisation is still the most popular. Change the button colour. Add urgency. Shorten the headline. Swap the hero image.
Sometimes those changes help. Most of the time, they turn into expensive busywork because nobody has diagnosed the underlying problem, nobody has defined what success means, and nobody waits long enough to know whether the result is real.
If you want to know how to improve website conversion rates, start with a harder truth. Conversions rarely improve because a team had a clever idea. They improve because the team found a specific leak, formed a defensible hypothesis, ran a controlled test, and judged the outcome against revenue, not vanity.
That’s the difference between organised experimentation and guessing with better vocabulary.
Stop Guessing and Start Diagnosing Your Conversion Leaks
Teams often start too late in the process. They open an A/B testing tool before they’ve built a case for what’s broken.
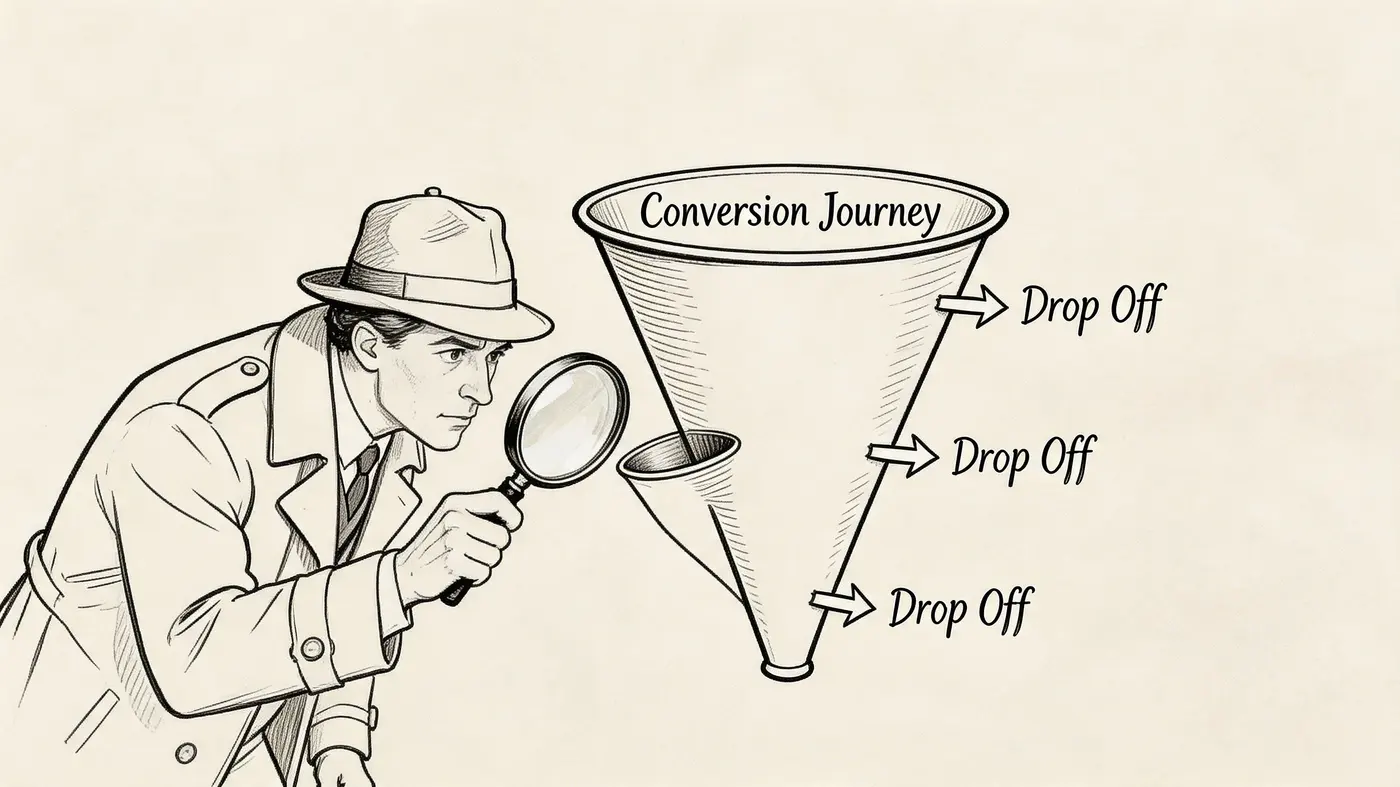
A better approach is to treat the site like a funnel under investigation. The question isn’t “what should we test?” It’s “where are users getting stuck, and what evidence do we have?”
Build a small diagnostic stack
You don’t need a giant martech setup. For most sites, three inputs are enough:
- GA4 funnel data for where users drop off
- Heatmaps for what they interact with
- Session replays for why that behaviour happens
Each tool answers a different question. GA4 tells you the page or step with abnormal exits. Heatmaps show whether people notice, ignore, or misuse page elements. Replays expose friction that aggregate reports hide, such as repeated clicks, hesitation, backtracking, or form confusion.
Practical rule: If you can’t point to a specific page and a specific behaviour pattern, you’re not ready to test.
Set up a basic dashboard in GA4
Create a working view of your funnel, not a generic traffic report. For an e-commerce site, that usually means key pages such as product page, cart, checkout, shipping, payment, and purchase. For lead generation, it might be landing page, form start, form submit, booking page, and confirmation.
Focus on three things:
- High-exit pages: Pages where users abandon before the next meaningful step
- Device splits: Mobile and desktop often behave differently, and blended data hides that
- Traffic source intent: Paid social visitors and branded search visitors usually arrive with different expectations
If you’re unsure what a broader improvement programme looks like, this guide to boosting website conversions is useful as a companion read because it frames CRO as a full-site discipline rather than a button-tweaking exercise.
Find the top three problem pages
Don’t audit everything at once. Pick the three pages where friction is most likely to hurt revenue or lead quality.
A practical shortlist usually looks like this:
- A high-traffic landing page that underperforms: Plenty of sessions, weak progression
- A product or pricing page with hesitation: Strong interest, weak move to cart or enquiry
- A checkout or form step with obvious abandonment: Intent is already high, so friction matters more
Once those pages are selected, review heatmaps and replay sessions only for those pages first. This keeps the analysis grounded and stops the team drowning in observations that never turn into action.
Look for behaviour patterns, not isolated oddities
One strange session doesn’t matter. Repeated behaviour does.
Useful signals include:
- Ignored primary CTA: Users scroll past it, but engage with secondary content
- Clicks on non-clickable elements: The design is promising interaction that doesn’t exist
- Form hesitation: Repeated edits, abandoned fields, or long pauses before submission
- Navigation loops: Users bounce between product, FAQ, shipping, and returns pages because core buying information isn’t where they expect it
- Mobile struggle: Pinch-zooming, mis-taps, or layout shifts that make the page harder to use
This is also where speed should move from “technical issue” to “conversion issue”. In the UK, e-commerce sites loading in under 2 seconds see conversion rates up to 32% higher than sites loading over 5 seconds, and UK shoppers abandon 53% of sites exceeding 3 seconds, according to Tenet’s CRO statistics roundup.
That data changes priorities. If a slow page sits near the bottom of the funnel, the problem may not be messaging at all. It may be load time, image weight, or delayed rendering on mobile.
Turn observations into a case file
By the end of diagnosis, each problem page should have a short evidence summary. Keep it tight:
- What the page is meant to do
- What users are doing
- What evidence supports that conclusion
- What friction appears most likely to suppress conversion
A UX review helps formalise that evidence. This user experience audit approach is a good model for turning scattered findings into a prioritised action list.
The output isn’t “redesign the checkout”. It’s something sharper: mobile users reach shipping, pause, open the returns policy in a new tab, then abandon. Or visitors on the pricing page click feature comparison content but ignore the demo CTA.
That level of specificity is what makes the next step possible.
From Data Insights to Testable Hypotheses
Raw insight is not a testing plan. It’s just a clue.
The work that separates strong CRO teams from noisy ones happens in the translation step. They turn evidence into a hypothesis that can be disproven, measured, and prioritised.
Use the because we saw this format
A useful hypothesis is concrete enough that an engineer can build it and an analyst can judge it.
A simple structure works well:
We believe changing X will improve Y because we saw Z in the data.
That final clause matters most. It forces the team to anchor the idea in observed behaviour rather than taste.
Here’s the difference.
Before
Fix the homepage hero.
After
Replace the generic homepage headline with a product-specific value proposition and supporting proof because heatmaps show users skipping the hero area and replay sessions show they scroll to proof sections before engaging.
Another example:
Before
Improve the checkout.
After
Move delivery and returns reassurance closer to the payment step because users repeatedly leave checkout to view policy information before abandoning.
A good hypothesis should feel slightly boring. That’s usually a sign it came from evidence instead of ego.
Define the metric before the build starts
Every hypothesis needs one primary metric and a small set of supporting metrics.
For example, if you test a product page headline, the primary metric might be progression to cart. Supporting metrics might include engagement with product details, add-to-basket quality signals, or downstream purchase behaviour.
If you’re testing creative assets, the same rule applies. Teams often produce videos or visual explainers because they “should help”, then never define what help means. If you’re using richer media on landing pages, this resource on how to create high-converting video ads is useful because it connects creative choices to conversion intent rather than aesthetics alone.
Prioritise with PIE
Once ideas start flowing, the opposite problem arises: too many plausible tests.
That’s where the PIE framework earns its place. Score each idea on:
- Potential. How much improvement could it drive?
- Importance. How valuable is the traffic on this page?
- Ease. How difficult is it to implement?
Don’t overcomplicate the scoring. Consistency matters more than precision.
PIE Framework Prioritisation Example
| Hypothesis | Potential (How much improvement can it drive?) | Importance (How valuable is the traffic on this page?) | Ease (How difficult is it to implement?) | Total Score (P+I+E) | Priority |
|---|---|---|---|---|---|
| Replace vague homepage hero copy with product-specific message and proof | 8 | 9 | 8 | 25 | High |
| Add delivery and returns reassurance beside payment step | 7 | 10 | 7 | 24 | High |
| Rework product page image gallery layout | 6 | 8 | 5 | 19 | Medium |
| Redesign full site navigation | 5 | 7 | 2 | 14 | Low |
The discipline here matters more than the table itself. A homepage redesign might feel exciting, but a small payment-step reassurance test often has a stronger business case because the traffic is closer to purchase and the build is simpler.
Write hypotheses that survive contact with reality
Weak hypotheses usually fail for one of three reasons:
- They’re too broad: “Improve trust” is not testable
- They assume the cause: “Users don’t like the colour” is usually unsupported
- They hide multiple changes: If you rewrite the copy, redesign the layout, and move the CTA, you won’t know what worked
A stronger version keeps one clear intervention tied to one observed problem.
That discipline saves time later. It also makes stakeholder conversations easier. You’re not asking for a redesign because someone in marketing feels the page is tired. You’re proposing a test because the evidence shows buyers searching for information the page doesn’t surface clearly enough.
Executing Statistically Sound A/B Tests
A/B testing gets misused because the mechanics look simple. Create variant. Split traffic. Wait. Pick winner.
The hard part isn’t launching the test. The hard part is running one that deserves trust.
Start with a controlled setup
For a straightforward example, take a headline test on a product or landing page. You’ve diagnosed weak message clarity, you’ve written a clean hypothesis, and now you need an experiment that isolates that change.
The basic setup is simple:
- Install the testing snippet
- Create control and variant
- Split traffic evenly
- Define the primary goal
- Launch the test
- Leave it alone until the result is trustworthy
Effective tooling is essential. A heavy script, visible flicker, or sloppy targeting can distort user behaviour and undermine the test before analysis even starts.
For teams that want a lightweight setup, Otter A/B uses a 9KB script, supports precise traffic splitting, and calculates significance with a frequentist z-test at a 95% confidence threshold. UK CRO specialists also report 2.5x faster winner detection with zero-flicker tools, according to Sitetuners’ guidance on increasing conversion rate.
Define what success means before launch
The most common testing mistake is metric drift. The team starts with one success metric, then halfway through starts celebrating something else because the original result looks weak.
Avoid that by locking in these decisions first:
- Primary goal: The one metric that determines the winner
- Secondary checks: Supporting indicators that help interpret the outcome
- Audience scope: All visitors, only mobile, only paid traffic, returning users, or another clear segment
- Exposure rules: Which pages and sessions are eligible
For a headline test, the primary goal might be clicks to the next funnel step. For a checkout test, it could be completed purchase. Secondary checks can help explain the result, but they shouldn’t replace the primary decision rule after launch.
If the team can’t agree on the winning metric before the test starts, don’t launch the test.
A practical workflow for a headline test
Here’s the process I’d use with a multidisciplinary team:
Step 1. Freeze the hypothesis
Write it in one sentence. Example:
Change the headline from a generic brand statement to a problem-solution statement because replay sessions show visitors scanning for clarity before engaging.
That sentence keeps scope tight. Designers know what they’re changing. Engineers know what not to touch.
Step 2. Build only one meaningful difference
Don’t alter spacing, swap images, change copy blocks, and move the CTA while calling it a headline test. If several elements must change to support the headline, document that clearly and accept that the test is broader.
Most of the time, cleaner isolation produces better learning.
Step 3. Split traffic cleanly
A balanced split is usually the right starting point because it reduces interpretation noise. If you target a narrower audience, make that choice explicit and keep the allocation stable.
Step 4. QA the live experience
Before launch, test:
- Visual consistency: No flicker, jumps, or broken styling
- Targeting logic: Correct users see the experiment
- Goal firing: Conversions are recorded correctly
- Mobile rendering: Variant behaves as intended on smaller screens
A test with broken tracking is worse than no test because it creates false confidence.
A useful reference on this point is how statistical significance works in experimentation, especially for teams that need a shared language around confidence and false positives.
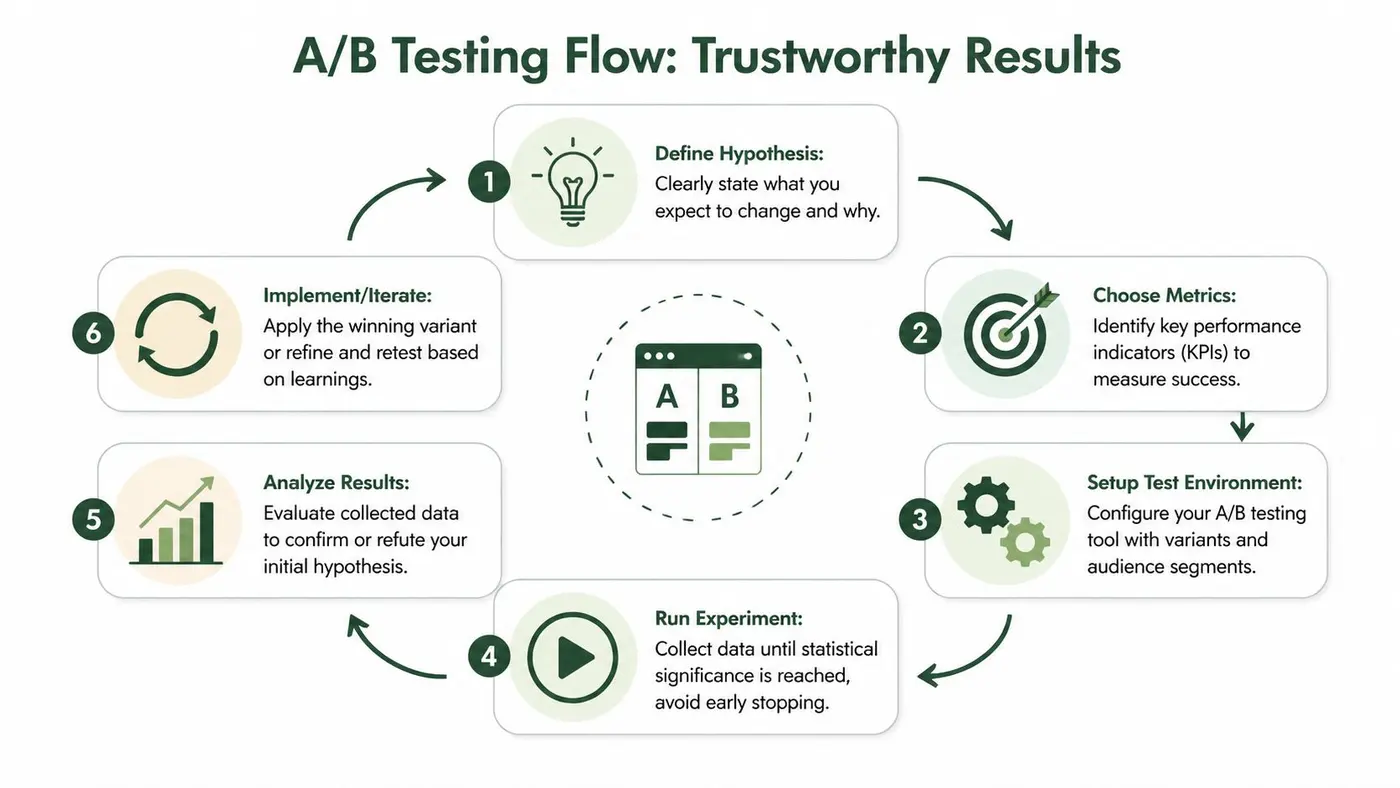
Later in the process, it can help to align the team around a simple workflow visual. This overview is a good summary:
What 95 percent confidence actually means in practice
The number gets repeated so often that teams stop thinking about it. But it has a clear operational purpose.
A 95% confidence threshold is there to reduce the chance that you declare a winner when the observed difference is just noise. It doesn’t promise certainty. It gives the team a disciplined bar for action.
That matters because research cited by CXL notes that 70% of small businesses make optimisation decisions without proper statistical validation, which is exactly how false confidence creeps into roadmap decisions. I’ll come back to that operational problem in the final section rather than duplicate the source here.
Don’t stop tests early
Peeking is one of the fastest ways to damage a testing programme. A variant looks promising after a few days, someone gets excited, and the team ends the test before the signal stabilises.
Early stopping creates a dangerous pattern. You don’t just risk shipping a bad variant. You also teach the organisation that experimentation is a way to justify hunches.
A more disciplined approach:
- Keep the test live until the decision rule is met
- Avoid changing traffic allocation mid-test
- Don’t edit page elements after launch
- Record external factors that may affect interpretation, such as sale periods or campaign shifts
Different teams need different operating models
Not every experiment should be built the same way.
For engineering-led teams, use code-based variants when the test touches layout logic, application state, or dynamic rendering. This gives tighter control and cleaner QA.
For marketing teams, visual or snippet-based changes can work well for messaging, CTA copy, ordering of proof, and lighter page elements. The key is restraint. If the visual editor tempts the team into changing half the page, the learning quality drops.
For agencies and consultants, reporting discipline matters as much as setup. Log the hypothesis, page, audience, duration, implementation notes, and final decision. That documentation becomes your operating memory.
What works and what doesn’t
A few patterns show up repeatedly.
What tends to work
- Grounding tests in observed behaviour
- Running narrower, cleaner experiments
- Choosing metrics tied to business intent
- Holding the line on significance thresholds
What tends not to work
- Testing whatever the loudest stakeholder dislikes
- Changing multiple variables without admitting it
- Calling a result “directionally positive” to avoid a hard decision
- Picking winners based only on click behaviour when downstream value is unknown
Good experimentation isn’t flashy. It’s controlled, documented, and slightly stubborn. That’s why it works.
Measuring Real Business Impact Beyond Conversions
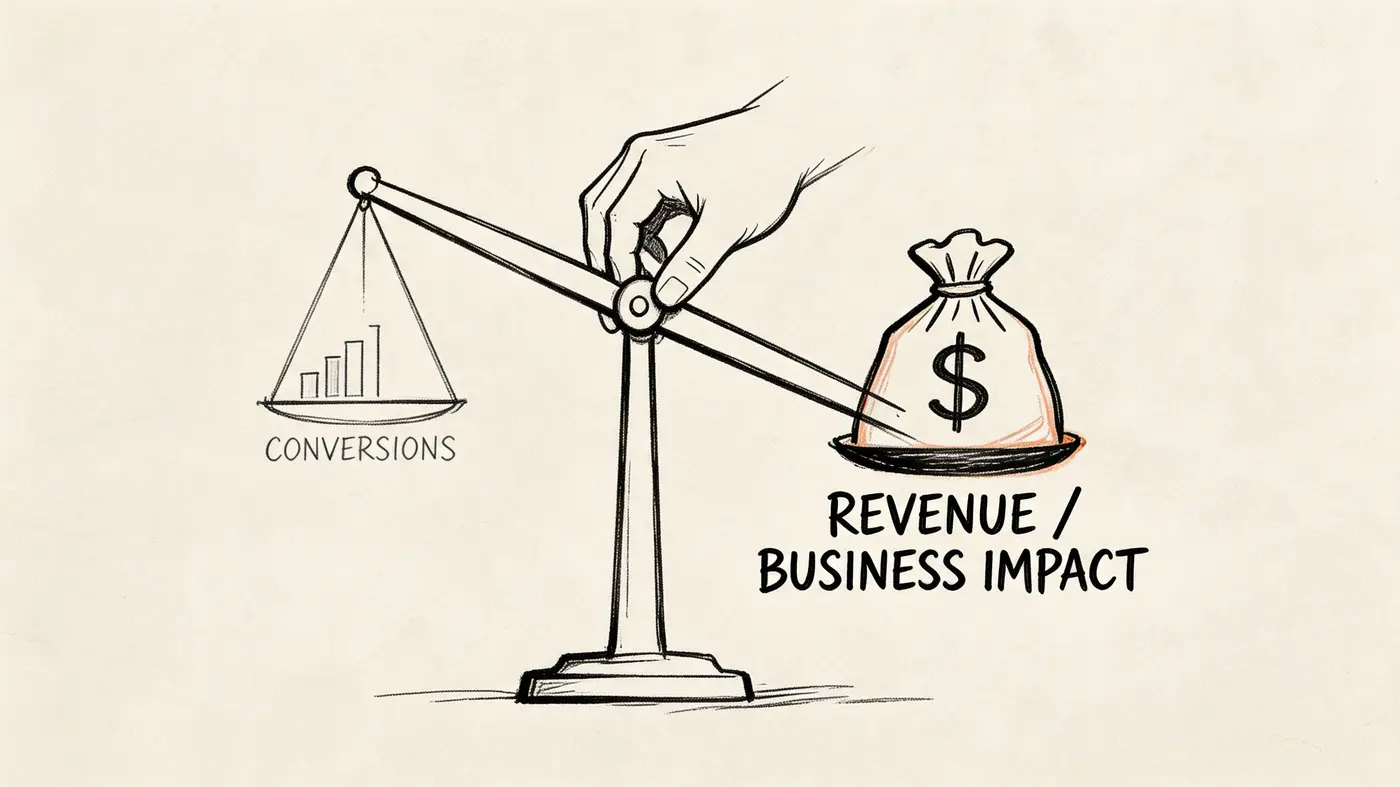
A lot of CRO reporting still ends at conversion rate. That’s too shallow for any team that cares about margin, order quality, or long-term value.
A variant can produce more conversions and still be the wrong decision.
Conversion rate is a useful metric, not the whole scorecard
If your team only asks “did more users convert?”, you can easily optimise toward lower-quality outcomes. Discount-led journeys, soft-intent sign-ups, and lower-value purchases can all make conversion rate look healthier while the business gets little benefit.
That isn’t hypothetical. A 2025 UK retail study found that 60% of e-commerce optimisation efforts improve conversion rates but fail to improve bottom-line revenue because they don’t track metrics such as Average Order Value (AOV) or revenue per variant, according to Network Solutions’ CRO article.
That finding should change how tests are judged.
A lower conversion rate can still win
Take a simple scenario.
Variant A converts more visitors, but buyers choose smaller baskets or lower-margin products. Variant B converts fewer visitors, yet the customers who do convert buy more, choose better bundles, or accept fewer discounts.
If Variant B delivers 30% higher AOV, it may be the clear winner even with a lower headline conversion rate.
The point isn’t the arithmetic. It’s the decision logic. Teams that focus only on conversion rate often ship variants that look efficient in reporting but reduce commercial quality.
A conversion without value is an incomplete success.
Measure macro and micro conversions together
Most sites need both:
- Micro-conversions show movement and intent. Examples include add to basket, account creation, or email signup.
- Macro-conversions represent the business outcome. Usually purchase, booked demo, or qualified lead.
Micro-conversions matter because they reveal where the journey improves or degrades. But they should support decision-making, not replace it.
A cleaner hierarchy looks like this:
| Metric type | What it tells you | How to use it |
|---|---|---|
| Macro-conversion | Whether the business goal happened | Primary decision metric when possible |
| Micro-conversion | Whether users progressed or engaged | Diagnostic support, not final proof |
| AOV | Whether customers spent more per order | Essential for commercial interpretation |
| Revenue per variant | Which version generated more value overall | Best lens for e-commerce test decisions |
Many reporting decks err in this regard. They celebrate a click-through lift to cart while ignoring what happened after that. For e-commerce teams, that’s an incomplete story.
A helpful companion read is why secondary metrics matter, especially when stakeholders need to understand why the “highest CR wins” rule is often too simplistic.
Revenue-focused testing changes what you choose to test
Once the team starts tracking value per variant, the roadmap usually improves.
Tests shift away from cosmetic wins and toward commercially meaningful questions:
- Does this bundle presentation increase basket quality?
- Does this reassurance block reduce discount dependence?
- Does a more qualified CTA reduce low-intent lead volume but improve downstream close quality?
- Does a simplified product page increase purchases while preserving order value?
That’s a better testing culture because it aligns optimisation with the way the business gets paid.
What this looks like in practice
For Shopify and WooCommerce teams especially, revenue data is already close at hand. The operational mistake is not using it in experiment evaluation.
A mature scorecard for each test should include:
- Primary conversion outcome
- Revenue per variant
- AOV trend
- Any meaningful secondary metric
- Interpretation notes on buyer quality
That final point matters. Sometimes a test drives stronger short-term purchases from weaker-fit customers. Sometimes a lower-friction path increases low-value orders. Those are business decisions, not just reporting quirks.
The best growth teams don’t ask whether the page got better. They ask whether the business outcome got better.
That’s the standard worth holding.
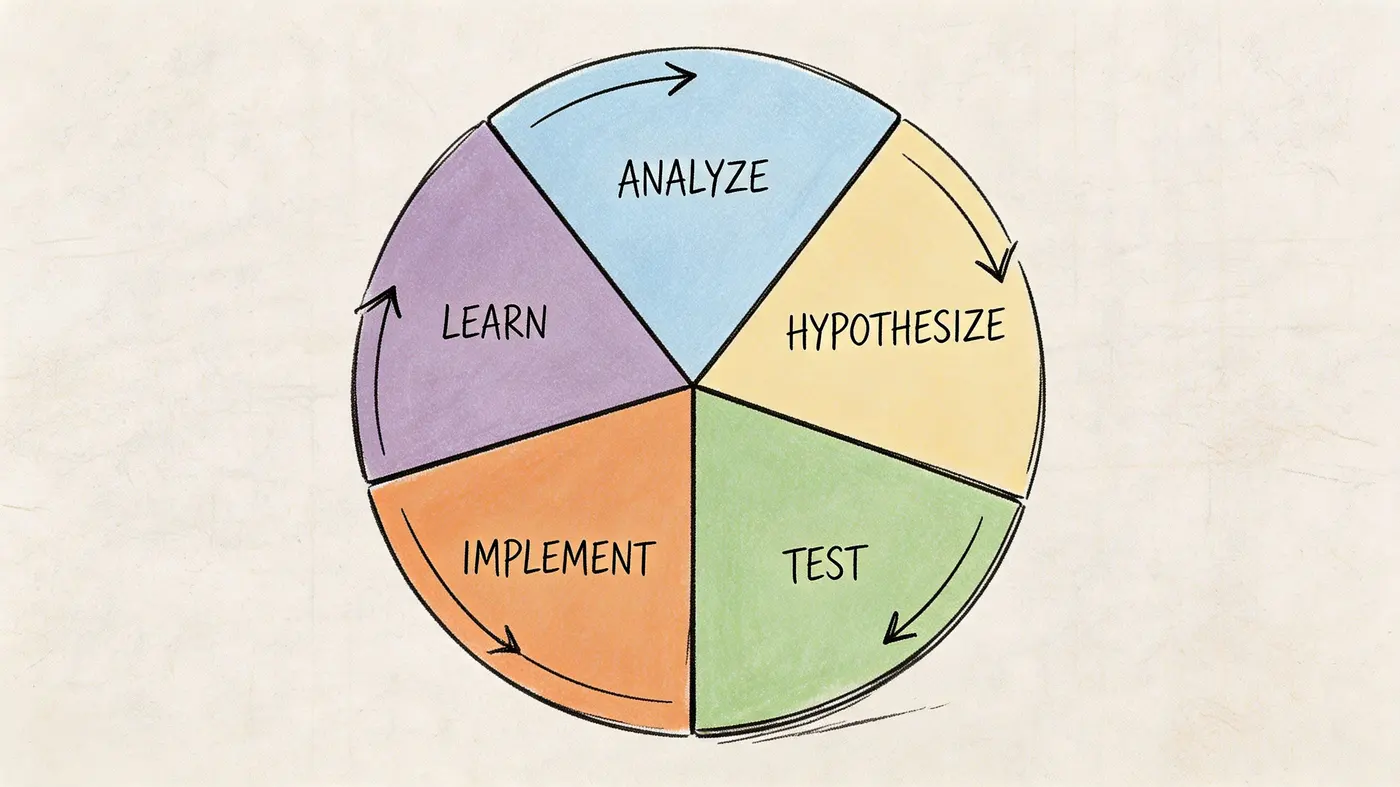
Building Your Continuous Optimisation Cycle
Strong CRO programmes don’t end when a variant wins. They become more useful after the decision, because every result creates the next question.
That’s how teams stop running isolated tests and start building compounding knowledge.
Treat each result as a reusable asset
When a product page CTA test finishes, don’t just ship the winner and move on.
Ask what the result teaches you about user intent, friction, and message clarity. If a clearer CTA improves progression from product page to cart, that insight may suggest a follow-up test at checkout. Perhaps buyers respond well to certainty, specificity, or reduced ambiguity. That pattern can inform payment-step copy, shipping reassurance, or returns messaging.
The asset isn’t the winning button. It’s the learning.
Build a lightweight learning library
Teams frequently lose value because results disappear into chat threads, screenshots, or someone’s memory.
Keep a central record with:
- Hypothesis
- Page and audience
- What changed
- Primary and secondary outcomes
- Decision
- Key lesson
- Next test idea
This solves a common waste pattern. Six months later, a new stakeholder suggests testing something you already learned didn’t matter, or mattered only for a specific audience.
The fastest way to mature a CRO programme is to make past tests easy to find and hard to misread.
Share results beyond the CRO team
CRO fails when it stays trapped inside marketing. The useful insights often belong to product, design, support, and engineering too.
If replay data shows users repeatedly leaving checkout to answer delivery questions, support should know. If a product page message improves purchase quality, paid media teams should know. If a reassurance block increases completion on mobile, designers should know what pattern is worth reusing.
That’s also where conversational tools and support data can help generate the next round of tests. Teams reviewing Live chat conversion tools often uncover repeated objections that belong directly on high-intent pages rather than inside a support interaction.
Protect the programme from bad habits
Here, statistical discipline becomes operational, not academic.
Research cited by CXL’s conversion rate guidance says 70% of small businesses make optimisation decisions without proper statistical validation. That isn’t just a math problem. It creates a workflow problem. Teams ship unproven ideas, clutter the experience, and lose trust in experimentation because the “wins” don’t hold up.
A healthier cycle uses a fixed confidence standard, documents why a decision was made, and treats inconclusive tests as useful outcomes rather than failures.
Connect one experiment to the next
A clean sequence often looks like this:
- Analyse behaviour on a product page and spot weak CTA clarity
- Test a clearer CTA and learn that certainty improves progression
- Implement the winner and monitor downstream purchase quality
- Use that insight to test more specific reassurance in checkout
- Document the result so future teams can reuse the pattern
That’s not a list of disconnected tasks. It’s a system.
Once the organisation starts working this way, the question changes. You stop asking, “What should we try next?” and start asking, “What did the last test teach us that deserves a follow-up?”
That’s a much better place to operate.
Frequently Asked CRO Questions
A lot of CRO work stalls on practical doubts rather than strategy. The questions are usually less about theory and more about trust, prioritisation, and where to begin.
FAQ
| Question | Answer |
|---|---|
| Where should I start if my site has many obvious problems? | Start where user intent and business value are both high. A messy homepage can wait if checkout, pricing, or product pages are clearly leaking revenue. Use funnel exits, heatmaps, and replays to narrow the shortlist to the top few pages. |
| Should I redesign a whole page or test smaller changes first? | Usually test smaller changes first. Full redesigns make attribution harder because too many variables change at once. A tighter test teaches you more and is easier to implement cleanly. |
| How many things should I change in one A/B test? | Change one meaningful variable when possible. If you must make several coordinated changes, document that it’s a bundle test and accept that the learning will be broader and less precise. |
| What if a variant increases clicks but not purchases? | Don’t call it a win. Clicks are useful only if they lead to better business outcomes or stronger downstream behaviour. Review the full path before making a decision. |
| How long should I run a test? | Run it until your pre-defined decision rule is met. Don’t stop because the early trend looks exciting. Early stopping is one of the easiest ways to create false winners. |
| What if the result is inconclusive? | That’s still useful. An inconclusive result tells you the tested change didn’t create a clear enough effect, or that the hypothesis needs refining. Record the learning and move to the next idea with better evidence. |
| Do I need a lot of traffic to improve website conversion rates? | More traffic helps, but it isn’t the only factor. Lower-traffic sites can still improve by focusing on high-intent pages, cleaner hypotheses, and stronger qualitative evidence before testing. |
| What’s the biggest mistake teams make? | They optimise for conversion rate in isolation, or they ship changes without enough statistical discipline. Both mistakes create noise, waste development time, and erode confidence in CRO. |
If your team wants a more disciplined experimentation workflow, Otter A/B is built for that style of work. It supports lightweight A/B testing, precise traffic splits, significance tracking at a 95% confidence threshold, and reporting on purchases, AOV, and revenue per variant so decisions can be tied to business outcomes rather than clicks alone.
Stop guessing
Ready to start testing?
Set up your first A/B test in under five minutes. No credit card required.
- 14-day free trial
- No credit card required
- Cancel anytime