Master Your User Experience Audit for Growth
Run a user experience audit for real growth. Our playbook guides CRO teams to find issues, prioritize fixes, and validate results with A/B tests.

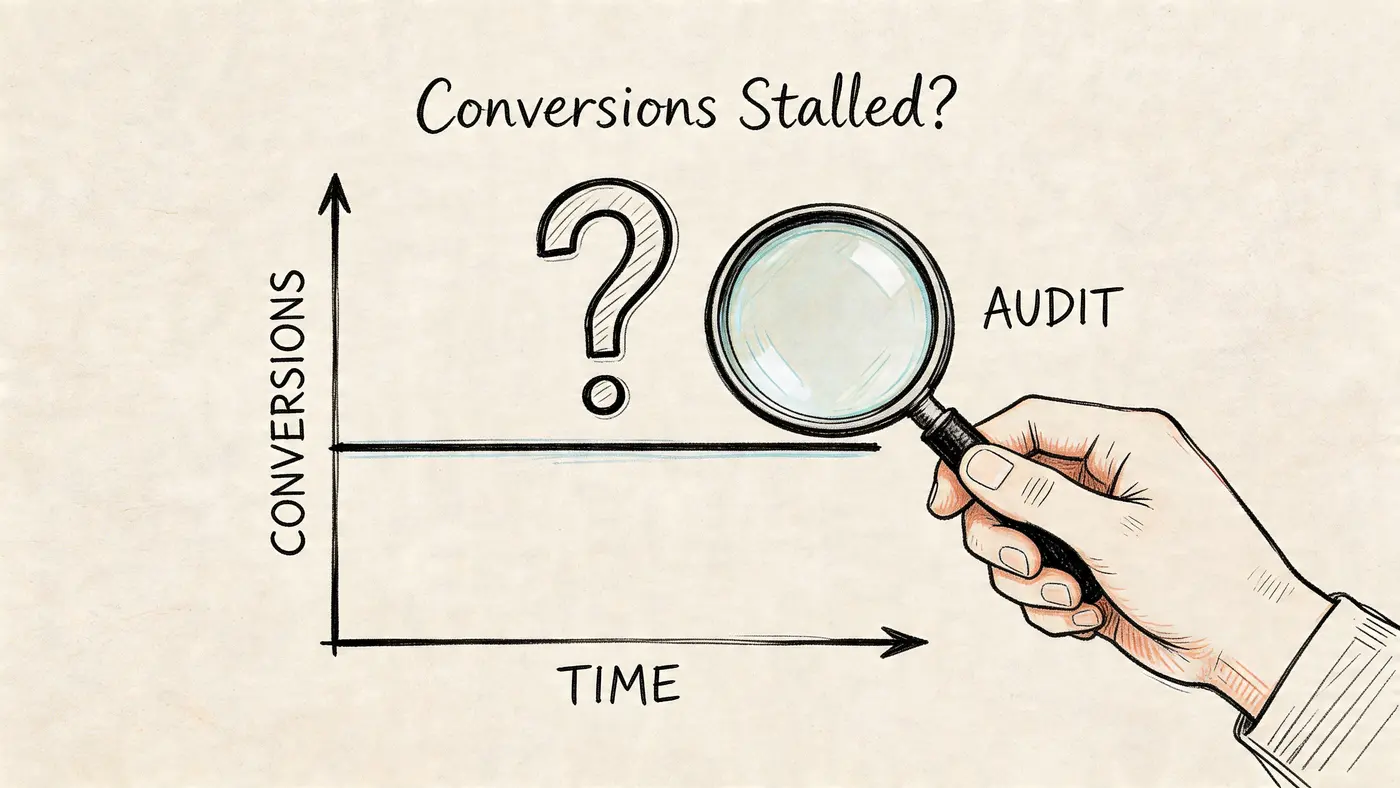
Your paid traffic is still working. Email is still bringing people back. Product demand hasn’t disappeared. Yet conversion rate has gone flat, and every new tweak feels smaller than the last one.
That’s usually the point where teams start over-editing ads, rewriting headlines for the fifth time, or blaming channel mix. Sometimes the problem is upstream. Sometimes users are making it to the site and hitting friction that dashboards only hint at. A confusing category structure, a hidden delivery message, a mobile form that looks fine in QA but fails in real use. A good user experience audit finds those leaks before another quarter gets spent buying more traffic into the same broken journey.
Why Your Conversions Stalled and How an Audit Helps
Monday starts with a familiar report. Traffic is steady, spend is under control, add-to-cart rate looks acceptable, and revenue still misses target. Nothing appears broken enough to explain the gap, so the team reaches for another headline test or a promo tweak.
That is usually the point to run a user experience audit.
I use audits when performance stalls in the middle of the funnel, where aggregate metrics stop being useful. A landing page can keep its click volume while losing intent because the message does not match the ad. A product page can hold attention but fail to answer delivery, returns, or compatibility questions. A checkout can look healthy in GA4 until session replay shows people pinching, zooming, correcting fields, and abandoning on mobile.
The stall usually comes from hidden friction
Conversion plateaus often show up after the obvious wins are already taken. Paid media is efficient enough. Email still brings people back. Brand demand has not collapsed. The remaining loss sits in small points of friction that stack up across the journey.
That friction is expensive. PwC’s 2023 consumer research and related UK ecommerce benchmarks, as cited in Baymard’s UX statistics roundup, point to the same pattern: users leave after poor experiences, slow pages, broken media, unclear costs, and overly complex checkout flows. For a CRO team, that matters because these are not design complaints. They are revenue leaks.
A practical rule helps here. If acquisition is holding and revenue per session is slipping, inspect the journey before increasing spend.
What an audit changes
A good audit changes the unit of work. The question stops being “what should we redesign?” and becomes “which friction points are hurting conversion, and which of them deserve an experiment first?”
That shift matters because not every UX issue should go straight into a redesign sprint. Some problems need instrumentation first. Some need a fast A/B test. Some turn out to be pricing, proposition, or traffic quality issues rather than interface issues. The audit separates those cases early, which saves design and engineering time.
It also closes the loop. Many UX guides stop at a list of issues, often with screenshots and severity labels. That is not enough. The useful version is an audit that feeds a test backlog, ties each finding to a funnel metric, and proves whether the fix lifted revenue, lead quality, or completion rate. Tools like analytics, session replay, user feedback, and lightweight testing platforms such as Otter A/B make that process realistic for teams that do not have a full optimisation program yet.
If top landing pages are slipping, it helps to review how to reduce website bounce rate alongside the audit, because bounce is often the first symptom of a wider journey problem.
Teams that need outside support can also get a comprehensive website audit before committing budget to new traffic or a larger redesign.
A user experience audit works best as an operating habit, not a one-off review. Find the friction. Rank it by commercial impact. Turn the strongest findings into experiments. Keep the winners. That is how stalled conversion rate turns back into measurable growth.
Define Your Audit Goals and Assemble Your Toolkit
Teams waste audits by starting too broad. “Improve UX” sounds sensible, but it creates sprawling notes and vague recommendations that nobody can prioritise.
A strong audit starts with a business question. Why are you doing it now? What metric is under pressure? Which user journey matters most? If you can’t answer that in one sentence, the audit will drift.
Set goals that tie to behaviour
The best audit goals sit at the intersection of user friction and commercial impact. They aren’t generic design goals. They’re operational goals linked to a funnel stage.
For example, a team might focus on:
- Checkout completion: Investigate where users abandon after adding to basket, especially on mobile.
- Lead form quality: Review whether form friction is reducing completed enquiries or demo requests.
- Landing page clarity: Diagnose weak progression from campaign landing pages into product detail or sign-up flows.
- Returning visitor conversion: Compare whether repeat users face trust or navigation blockers that first-time visitors don’t.
The point isn’t to force a number into the brief. The point is to choose a clear outcome so everyone evaluates the same journey.
Build a toolkit that answers both what and why
Many teams already have enough tools. They just use them in isolation.
A practical audit stack usually needs three layers:
| Tool category | What it helps you answer | Typical tools |
|---|---|---|
| Quantitative analytics | Where users drop, stall, or exit | GA4, Search Console, platform analytics |
| Behavioural evidence | What users do on-page | session replay tools, heatmaps, on-site search logs |
| Validation layer | Whether the proposed fix improves outcomes | A/B testing platform, experiment reporting |
Analytics tells you what happened. Session replay and feedback help explain why. Experimentation tells you whether your diagnosis was right.
That last layer matters more than most audit guides admit. If you hand over a list of issues without a validation plan, you’re still relying on opinion once implementation starts.
Audits fail when teams treat findings as final answers. They’re not. They’re well-informed hypotheses.
Assemble the people before you start
Don’t run the audit alone and then “socialise” it later. Pull in the people who own the journey.
That usually means:
- Growth or CRO lead to frame commercial impact
- Designer or product designer to assess interaction and information hierarchy
- Analyst to confirm event quality and segment findings correctly
- Developer to flag implementation constraints early
- Customer support or sales to add recurring complaints from real users
This is also the stage where outside perspective can help. If the site has accumulated years of changes, legacy templates, and unclear ownership, it can be useful to get a comprehensive website audit as a reference point alongside your internal review. Not because an external audit replaces a CRO process, but because it can expose blind spots teams stop noticing.
Prepare the audit like a live project
Before any review begins, check the basics:
- Analytics integrity: Make sure key events, revenue tracking, and funnel steps are firing.
- Device scope: Decide whether you’re auditing desktop, mobile, or both. Don’t treat them as identical experiences.
- Page sample: Pick the journeys that matter most. Homepage, key category pages, PDPs, basket, checkout, and any major acquisition landing pages.
- Tool access: Confirm access to replay tools, tag managers, CMS preview, and reporting dashboards.
- Experiment readiness: Keep your test layer ready from day one. If you need a stack review, this round-up of conversion rate optimization tools is a useful benchmark for what should already be in place.
Good audits are narrow at the start, not broad. That discipline is what makes the final recommendations usable.
Uncovering User Behaviour with Analytics and Data
Start with numbers, but don’t stop at dashboard summaries. A user experience audit becomes useful when analytics moves from reporting to diagnosis.
The first pass should answer a simple question. Where is behaviour breaking pattern? Not “which page has the worst bounce rate?” but “which step is underperforming relative to intent, device, and source?”
Read funnels like an operator, not a reporter
A standard funnel report often hides the underlying problem because it aggregates too much. Break it down by entry source, device, landing page type, and user status. New and returning users rarely fail for the same reason. Mobile and desktop almost never fail for the same reason.
For UK e-commerce teams, region-specific friction holds significance. The background material supplied for this article highlights an underserved angle in UK audits: platform-specific issues on Shopify and WooCommerce, especially around VAT display and payment flows, as discussed in this Cardinal Peak article on common usability issues and UX audits. That same source notes projected UK-specific concerns around Core Web Vitals, lightweight testing setup, and revenue-focused audit priorities. Even without treating every cited figure there as current operating truth, the practical lesson is solid: local purchase expectations change how users interpret pricing, totals, and checkout reassurance.
What to inspect first
Use analytics to build a shortlist of suspect areas:
- Landing pages with high exit intent: Pages receiving qualified traffic but failing to progress users further.
- Product pages with weak basket progression: Often a sign of missing reassurance, poor image loading, unclear delivery or pricing communication.
- Basket and checkout steps with steep drop-off: Especially where totals, shipping, VAT wording, or promo code interactions introduce uncertainty.
- Internal search usage: Search terms often expose unmet navigation needs in the user’s own language.
- Device-specific anomalies: A journey that performs acceptably on desktop can still be broken on mobile.
For teams mapping these journeys in more detail, examples of customer path analysis can help sharpen the investigation. This guidance for ambitious e-commerce brands is useful when you want to compare analytics patterns against the actual stages customers move through before purchase.
A practical metrics table
Here’s the kind of table I use early in an audit.
| Metric to Check | What to Look For | Potential UX Issue |
|---|---|---|
| Entry page bounce or exit patterns | Strong paid or organic landings that don’t lead to a second step | Message mismatch, weak first impression, slow content load, unclear CTA |
| Product detail to basket progression | High product interest with weak add-to-basket movement | Poor product information, hidden costs, weak trust cues, image or variant friction |
| Basket to checkout start | Users add items but hesitate before proceeding | Surprise totals, weak delivery clarity, promo code distraction, lack of confidence |
| Checkout step completion | One step consistently loses more users than others | Form friction, validation errors, payment confusion, forced account creation |
| Internal search terms | Repeated searches for shipping, returns, sizing, VAT, contact info | Navigation failure or essential information buried too deep |
| Device split by funnel stage | Mobile underperformance concentrated at one interaction point | Touch target issues, layout instability, mobile keyboard friction |
| Revenue by landing page or path | Traffic reaches site but lower-value sessions dominate | Journey attracts clicks without guiding buyers to higher-intent actions |
Segment before you diagnose
Averages hide expensive problems. Segmenting is where the audit gets sharp.
Look at:
- Mobile versus desktop
- New versus returning
- Paid versus organic
- Brand versus non-brand traffic
- High-intent categories versus discovery categories
If mobile visitors reach basket but fail in checkout, don’t redesign the homepage first. If organic non-brand visitors bounce from category pages, inspect taxonomy, filtering, and page comprehension before touching product content.
Don’t ignore behaviour outside the obvious funnel
Some of the most valuable audit clues sit outside standard conversion reports. Site search, FAQ visits, returns policy views, delivery pages, and contact-page traffic often signal hesitation. If lots of users detour into reassurance content before buying, your core pages may not be doing enough explanatory work.
This is also where visual behaviour tools help. A replay or heatmap won’t replace analytics, but it will help you investigate patterns more efficiently. If you’re comparing scroll depth, click concentration, and dead-click zones, this overview of heat maps on websites is a useful companion to the quantitative side of the audit.
Field note: When a page gets attention but not progression, the problem is often clarity before persuasion. Users won’t respond to stronger CTAs if they still don’t understand the offer.
A good data review doesn’t give you answers yet. It gives you a ranked list of places where answers are worth pursuing.
Adding Context with Heuristics and User Feedback
Once the numbers point to the right pages, switch lenses. The audit then becomes human.
Analytics can tell you that users leave on a shipping step. It can’t tell you whether they thought the wording was misleading, whether the form looked broken, or whether they couldn’t find what to do next. That context comes from heuristic review, session observation, and direct feedback.
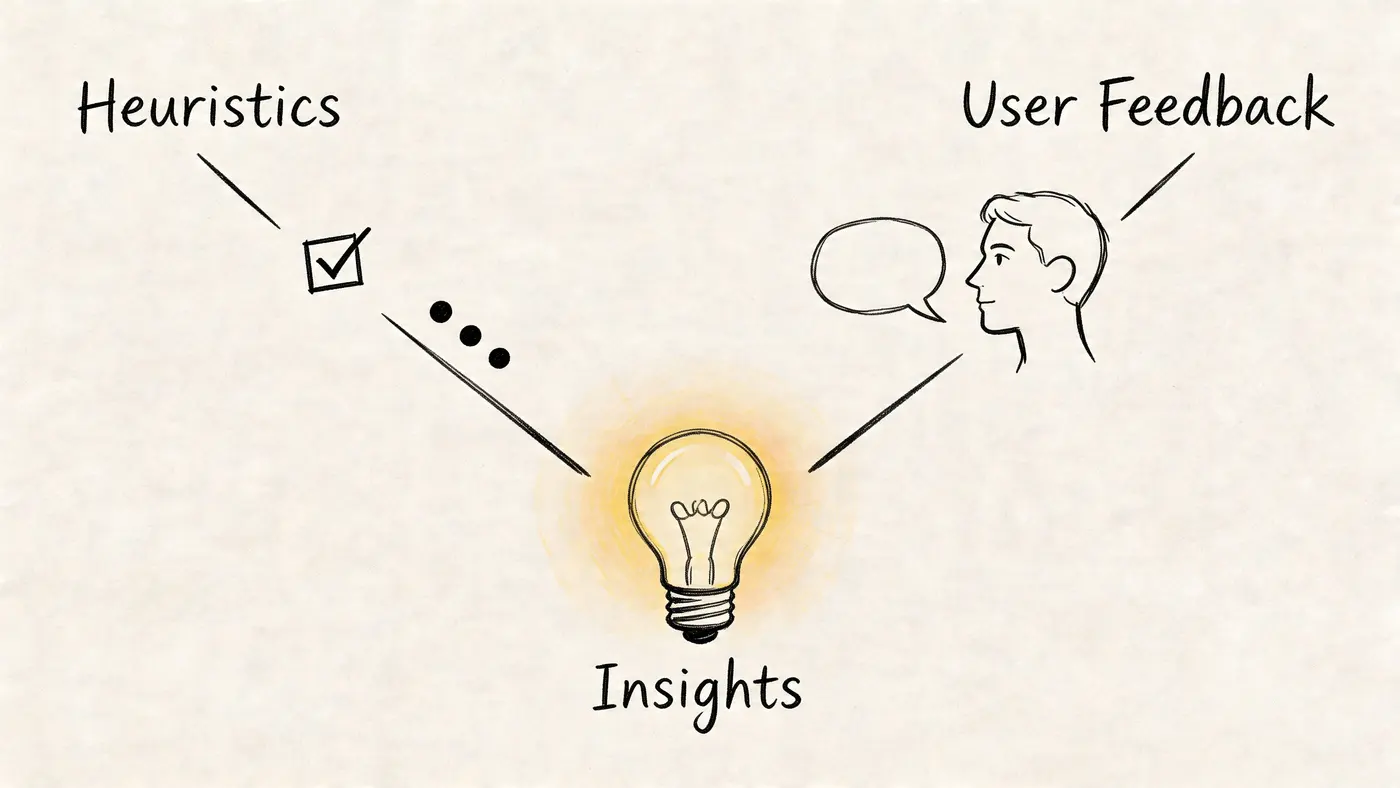
Use heuristics to make the review systematic
A heuristic pass stops the audit becoming a list of personal opinions. I usually review key journeys against familiar usability principles such as clarity of system status, consistency, error prevention, recognition over recall, and friction around user control.
On a live site, that translates into practical checks:
- Clarity of state: Does the site clearly show where the user is, what changed, and what happens next?
- Consistency: Do buttons, labels, icons, filters, and form patterns behave predictably?
- Error handling: When users make mistakes, does the interface help them recover?
- Cognitive load: Are users being asked to remember information they should be shown?
- Trust and reassurance: Are delivery, returns, payment, and contact expectations easy to verify?
This part shouldn’t be abstract. Open the page and walk the journey as if you were buying for the first time on a busy train with poor signal and limited patience. That mindset catches more than a design review done from a large office monitor.
What session recordings reveal that reports miss
Session replay is where patterns become obvious. You start seeing users pause over fields that seemed harmless in design review. You notice them opening and closing accordions repeatedly because the answer they need isn’t where they expect. You see rage clicks on image carousels, dead taps on non-clickable elements, and U-turns from checkout back to product pages because something still feels uncertain.
A few recurring patterns deserve attention:
- Repeated field edits: often a sign validation is too strict or unclear
- Fast back-and-forth navigation: usually means users are hunting for reassurance
- Long inactivity before exit: a cue that the user is thinking, comparing, or confused
- Dead clicks: often expose false affordances in the interface
- Promo code fixation: can derail checkout momentum if the field is too prominent
Users rarely tell you “your information architecture is weak”. They show you by wandering.
User feedback needs structure, not just volume
Open-text feedback is useful, but random comments can mislead if you collect them poorly. Ask broad questions and you’ll get broad answers. Ask after the wrong moment and you’ll bias the response.
If you’re planning moderated interviews or feedback collection as part of the audit, it helps to develop better screener questions so you recruit the right participants and avoid hearing only from your easiest users.
A simple feedback prompt can still work well when tied to context. Ask after a hesitation point, after form abandonment, or after a support-page visit. Keep it short. Ask what the user expected to find, what nearly stopped them, or what felt unclear.
Watch a walkthrough before your next review session
This short video is a good reset if your team tends to rush from analytics into redesign decisions.
Turn observations into evidence
Don’t write “checkout feels confusing”. Write the evidence behind it.
For example:
- Users hesitate on the order summary because VAT inclusion isn’t obvious.
- Users reopen delivery information before entering payment details.
- Mobile users zoom to read field labels or error messages.
- Users attempt to click visual elements that aren’t interactive.
- Returning users still use internal search to find basic policy information.
That level of specificity matters because the next step isn’t “fix UX”. It’s choosing which friction deserves priority and how to validate the solution.
From Insights to Actionable Priorities
A messy audit document is easy to produce. A prioritised backlog is harder, and far more useful.
By this stage you’ll have a mix of evidence. Analytics anomalies, replay clips, heuristic notes, support themes, maybe a few accessibility concerns, and several opinions from different stakeholders. The job now is to reduce that into a working order the team can act on without arguing for two weeks.
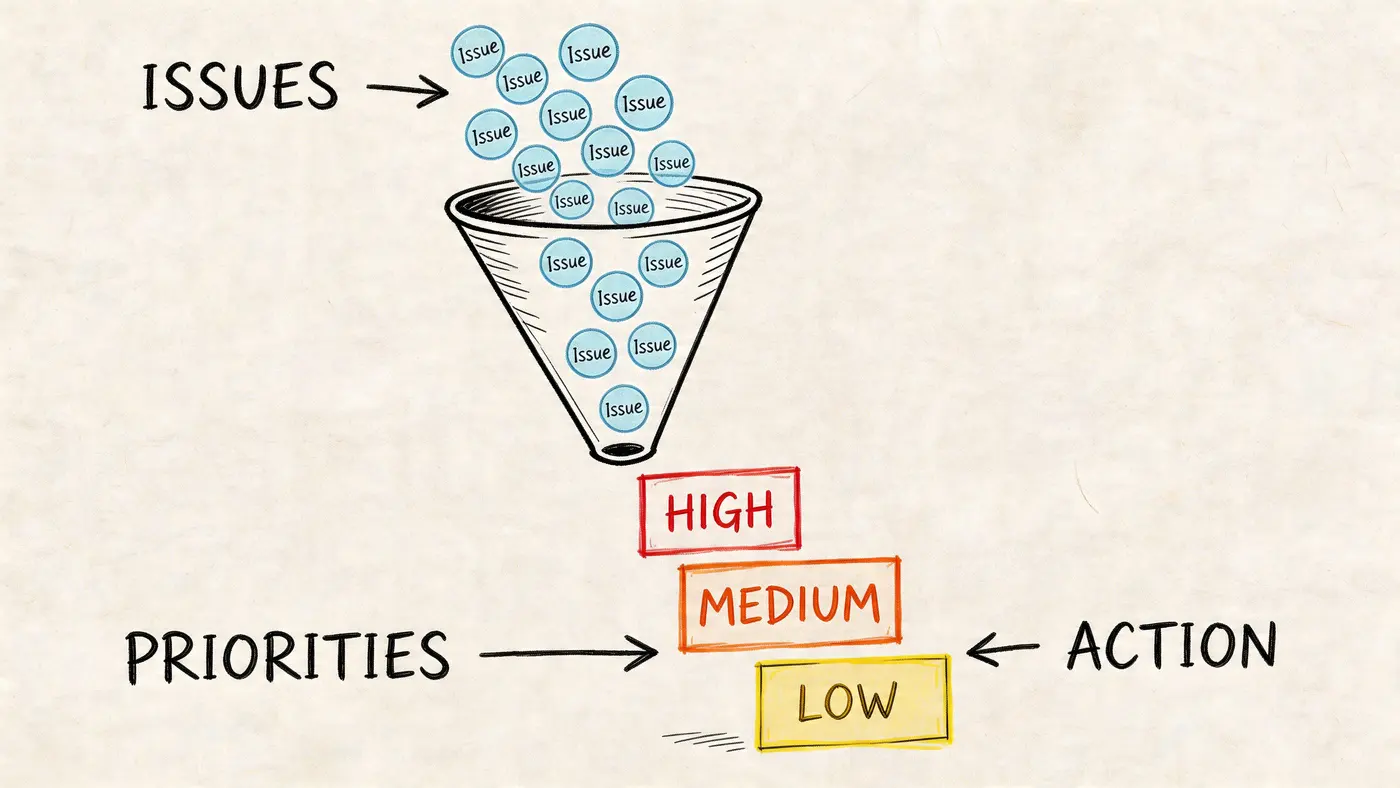
Use a simple scoring model
You don’t need a complicated framework. An ICE or PIE model works because it forces explicit judgement.
I prefer scoring each issue on three dimensions:
| Dimension | What you’re judging | Questions to ask |
|---|---|---|
| Impact | Commercial upside if fixed | Does this affect a core journey or a marginal one? |
| Confidence | Strength of supporting evidence | Do multiple data sources point to the same problem? |
| Ease | Delivery complexity | Can the team ship and test this without major rework? |
This doesn’t remove judgement. It makes judgement visible.
What high-priority work usually looks like
The strongest priorities tend to have three traits. They sit on a revenue path, they show up in more than one source, and they can be changed without a major platform project.
Examples include:
- Checkout copy that creates uncertainty: high impact, usually straightforward to test
- Poor mobile field behaviour on a lead form: high impact if mobile is material, moderate implementation effort
- Missing reassurance near add-to-basket: often worth testing quickly when replay and support both point to hesitation
- Navigation issues on low-traffic editorial pages: worth fixing, but usually not first
Decision test: If this issue disappeared tomorrow, would the business notice in revenue, lead quality, or completion rate?
Separate backlog items by action type
Not every finding belongs in the same queue. Mixing them slows delivery.
I separate issues into three groups:
-
Direct fixes
Broken interactions, obvious bugs, misleading labels, accessibility blockers. These usually don’t need a test first. -
Experiment candidates
Content hierarchy, CTA changes, reassurance placement, checkout step design, page layout changes. These should become hypotheses. -
Strategic rebuild themes
Information architecture problems, major template redesigns, deep platform constraints. These need broader planning.
That split helps avoid a common mistake. Teams often over-test bugs and under-test design decisions. The reverse is better. Fix what is clearly broken. Test what is plausibly better but not yet proven.
Write findings so they can survive handoff
A priority list should be readable by designers, developers, analysts, and stakeholders who weren’t in the audit sessions. Each item needs four things:
- The issue
- The evidence
- The likely consequence
- The recommended next action
For example:
Mobile checkout users hesitate at the order summary because tax and delivery wording is easy to miss. Replay shows repeated reopening of summary sections, and analytics shows drop-off concentrated at this step. Likely consequence is avoidable abandonment. Recommended next action is a test of clearer summary layout and stronger cost transparency.
That’s a backlog item people can execute. It’s also one that can become an experiment brief without being rewritten from scratch.
Turning Problems into Profitable Experiments
Most audits stop too early. They identify friction, create a slide deck, and then hand implementation to the loudest opinion in the room.
That’s where value leaks out. An audit should feed a testing programme, not a redesign queue full of assumptions.
Write hypotheses, not recommendations
A recommendation sounds finished. A hypothesis stays honest.
Use a simple structure:
By fixing [problem] with [change], we expect [measurable outcome], because [reason grounded in audit evidence].
Examples:
- By clarifying delivery and tax messaging in the basket, we expect more users to begin checkout, because replay shows hesitation around total cost visibility.
- By simplifying mobile form labels and error handling, we expect more completed submissions, because users repeatedly correct fields before abandoning.
- By moving reassurance content closer to the primary CTA, we expect stronger product-to-basket progression, because users currently detour into policy and FAQ content first.
That framing matters because it links user experience work to a business outcome from the start.
Why validation matters more than implementation speed
Shipping fixes without testing feels fast, but it often hides bad judgement. Teams remember the wins and forget the quiet losses. Navigation tweaks can reduce discovery. Cleaner designs can remove reassurance. Shorter forms can lower lead quality. Better-looking pages can still convert worse.
The supplied background for this article points to an underserved angle in UX content: using lightweight experimentation as part of the audit process rather than after it. The same material notes that current guides rarely show how to validate fixes quantitatively, and references projected UK conditions including e-commerce conversion rates averaging 2.8% in 2025, experimentation consent considerations in Q1 2026, 95% confidence decisioning, and a reported 15-20% uplift in average order value for teams using A/B post-audit, all discussed in this Flying Age article on what a rigorous UX audit examines. The exact figures are less important here than the operating principle: if you don’t measure post-audit impact, you can’t separate a smart UX fix from an expensive preference.
Choose experiments that match the evidence
Not every insight deserves the same test design.
A few practical pairings:
| Audit finding | Better response |
|---|---|
| Broken field validation or obvious usability defect | Fix directly, then monitor |
| Unclear messaging or reassurance gap | A/B test copy, layout, or placement |
| Checkout sequence friction | Test one structural change at a time |
| Category page confusion | Test navigation labels, filter defaults, or content hierarchy |
| Weak landing page progression | Test hero message, CTA framing, supporting proof |
The mistake I see most often is testing too many variables at once. If the audit suggests users don’t trust costs, don’t change the headline, imagery, CTA colour, and basket layout in one variant. Start with the cost communication.
Measure revenue, not just clicks
A user experience audit is supposed to improve the business, not just interaction rates. That means the experiment scorecard needs to go beyond surface conversions.
Track:
- Primary conversion metric tied to the tested journey
- Revenue per variant where purchase behaviour is involved
- Average order value if the change could alter basket composition
- Downstream quality signals for lead generation, where relevant
- Segment response so mobile and desktop aren’t blended into one verdict
This is especially important for e-commerce changes. A test can improve progression into checkout while reducing purchase quality later. Without downstream metrics, teams declare victory too early.
The cleanest audit process is simple. Find friction. Form a hypothesis. Test the fix. Keep the learning. Repeat.
Build an experimentation rhythm from the audit backlog
The audit shouldn’t produce one giant release plan. It should produce an ordered sequence of testable ideas.
A practical rhythm looks like this:
- Start with the top revenue-path friction item.
- Launch a narrow test with one clear behavioural theory.
- Review both conversion and business impact.
- Log the result and fold the learning back into the backlog.
- Move to the next highest-confidence problem.
That loop is where UX auditing becomes a growth function rather than a one-off review. Teams stop asking, “Did we fix the page?” and start asking, “Did the change improve how users buy?”
Sharing Results and Fostering a Culture of Auditing
A UX audit fails in a familiar way. The team spends days pulling analytics, clipping session replays, marking up screens, and debating severity. Then the output lands as a slide deck, everyone agrees the problems are real, and nothing changes in the roadmap.
The fix is operational, not presentational. Audit findings need to move into the formats each team can act on, with enough commercial context to win priority and enough detail to ship or test the change. If that handoff is weak, the audit becomes an archive of known problems instead of a source of revenue decisions.
Build outputs for the decision being made
Leadership, product, design, engineering, and growth do not need the same artifact.
For leadership, use a one-page summary. Keep it tight and commercial. I use five fields:
- Journey affected: signup, PDP to cart, checkout, lead form
- Observed friction: what users struggled to do
- Evidence: analytics trend, session replay pattern, user feedback theme
- Business exposure: lost orders, lead drop-off, wasted paid traffic, support load
- Recommended next step: fix immediately, test first, or monitor
A useful leadership line looks like this: “Mobile checkout address entry creates repeated validation failures. Replay review shows users correcting the same field multiple times. Recommend a controlled test on simplified field labels before the next paid campaign push.”
That gives stakeholders something they can fund.
Designers need a different level of specificity. Give them annotated screenshots with three parts on each frame: what the user saw, what they likely expected, and what blocked progress. Pair that with two or three replay timestamps, not a folder of fifty clips no one will watch. Good audit notes for design are concrete: “Primary CTA falls below a dense finance options module on smaller laptops,” or “Error copy explains policy, not the action required to continue.”
Engineering needs scope clarity early. Mark each item as one of three types:
- Direct fix: low ambiguity, low risk, no need to test first
- Experiment candidate: plausible gain, but enough uncertainty that validation matters
- Requires discovery: issue is real, root cause still needs work
That classification saves time. It stops every issue from entering the same queue and helps engineering managers estimate effort without reverse-engineering the audit.
Growth teams need the audit translated into an experiment pipeline. Each issue should have a hypothesis, target metric, audience, page or flow, implementation complexity, and a confidence note based on the evidence quality. If the finding cannot become a test brief or a scoped fix, it is still too vague.
Show evidence in a form people can use
The best audit documents reduce interpretation work.
For a designer, an annotated screenshot should answer four questions in seconds:
- Where is the friction?
- What behaviour suggests it is a real problem?
- Which users are affected?
- What constraint matters here, brand, tech, legal, or merchandising?
For example, an annotated product page screenshot might include a note above the gallery saying, “Users on mobile scroll past size guidance and hit add-to-cart uncertainty. Analytics shows exits after variant selection. Replays show hesitation around fit confidence. Test moving fit guidance closer to size selection.”
That is stronger than “improve product page clarity.” It points to evidence and suggests a testable direction without prescribing a full redesign.
Session replay clips also need handling with care. A dramatic clip gets attention, but one replay is not a pattern. Use replays to explain behaviour already seen in analytics or feedback, not to replace them. I usually attach one representative clip, one supporting clip, and a short note on the broader pattern. That keeps the evidence credible.
Turn the audit into a living operating document
A one-off report gets stale fast. A living audit creates continuity between audit work, releases, and experimentation.
The document can stay simple. A shared spreadsheet, Notion database, or product board works if the fields are disciplined. Track:
- Issue ID
- Journey or page
- Problem statement
- Evidence source
- Segment affected
- Severity
- Estimated business impact
- Owner
- Status
- Next action
- Related experiment or ticket
- Outcome and learning
The last field matters most. Teams often log the problem and forget to log what happened after the fix or test. That creates two expensive habits. Solved issues get rediscovered, and failed ideas return six months later dressed up as new recommendations.
Review the living audit on a schedule. Monthly works for high-traffic e-commerce journeys. Quarterly may be enough for lower-volume B2B funnels. Revisit it after major releases, pricing changes, checkout updates, campaign shifts, or any drop in conversion quality. Those moments change user behaviour, and old findings can either become urgent or stop mattering.
Make ownership visible
Shared responsibility usually means no responsibility. Each high-priority item needs one named owner, even if several teams contribute.
That owner is not always the person implementing the change. In many teams, product owns the issue, design shapes the response, engineering estimates delivery, and growth owns the test plan and readout. Write that down. Ambiguity slows audit follow-through more than disagreement does.
I also recommend a simple status language that everyone uses the same way:
- New
- Validated
- Queued
- In test
- Implemented
- Resolved
- Archived
“Resolved” should mean the team has evidence the issue no longer harms the journey. “Implemented” only means the change went live. Those are not the same thing.
Create a review loop that proves ROI
Audit culture improves when teams can point to outcomes, not effort.
Run a short review after each completed test or shipped fix. Cover the original problem, the intervention, the result, and the learning to carry forward. Keep it to one page or a short loom. Over time, this becomes the proof that the audit process earns its place.
That is the part many guides skip. They stop at the problem list. Strong teams close the loop. They show which findings produced experiments, which experiments generated lift, which fixes removed friction without testing, and which hypotheses failed. That record sharpens future prioritisation and makes the next audit faster.
A healthy audit culture is not about producing more reports. It is about building a repeatable system where evidence becomes backlog, backlog becomes experiments, and results feed the next round of decisions. If a lightweight testing tool helps the team launch and read those experiments faster, use it. The method matters more than the format, but the payoff comes from keeping the loop tight.
Stop guessing
Ready to start testing?
Set up your first A/B test in under five minutes. No credit card required.
- 14-day free trial
- No credit card required
- Cancel anytime