North Star Metric: Guide To Real Growth & Focus
Find your North Star Metric to focus your team on what truly matters. Learn to choose, measure, & connect your NSM to A/B testing for real growth.

Your team probably has this problem right now. Marketing is celebrating traffic, product is watching activation, CRM cares about repeat purchase, and leadership asks one awkward question in the Monday meeting: are we getting closer to sustainable growth?
The common issue isn't a lack of data. It's a lack of a shared definition of progress.
That's why the north star metric matters. It gives everyone one clear signal to organise around, while still leaving room for each team to track the supporting numbers they need day to day. The tricky part isn't understanding the headline idea. The tricky part is turning it into something teams can use when they're planning experiments, prioritising roadmaps, and deciding what to test next.
Why Your Team Needs a Single Point of Focus
When every team has its own favourite metric, you get motion without alignment.
Paid media pushes for more sessions. Content wants higher engagement. Product wants feature adoption. CRO wants more checkouts. None of those are wrong. They just answer different questions. If nobody agrees on the main question, the business starts optimising fragments instead of outcomes.
The dashboard problem
Most dashboards create a false sense of control. They show lots of movement, but they don't settle the one issue leadership cares about: whether the company is delivering more value to customers in a way that compounds over time.
That's where teams get stuck. They see dozens of signals, but no clear hierarchy.
A useful north star metric cuts through that clutter. It says, in plain terms, "this is the clearest expression of the value we create, and this is the number we want to grow."
Practical rule: If two teams can both claim success while the business stalls, your metrics aren't aligned.
This is also why companies set objectives in the first place. They need a way to drive strategic business growth without letting every function define success in isolation.
Where most advice stops too early
A lot of north star metric content explains strategy well enough, but it often stops at the executive level. It tells you how to choose a guiding metric, then leaves a gap between that choice and the work teams do every week.
That gap matters. Existing discussion around NSMs often overlooks how experimentation-driven organisations should connect the metric to A/B testing, especially when teams need to ladder small test KPIs into broader business outcomes, as noted in this discussion of the gap in current NSM guidance.
For growth and product teams, that's the core challenge. You don't just need a strategic slogan. You need a way to connect copy tests, landing page changes, onboarding tweaks, and pricing experiments back to one meaningful result.
What changes when a team has a real north star metric
A strong north star metric does three useful things at once:
- It aligns choices: Teams can judge ideas against a shared outcome instead of local preferences.
- It reduces noise: You still track many metrics, but you stop treating all of them as equally important.
- It improves trade-offs: When two initiatives compete, the team has a clearer way to decide.
That doesn't make decision-making easy. It makes it cleaner.
When a team can say, "This experiment may reduce clicks, but it improves the metric that best reflects customer value," the conversation gets sharper. Less theatre. More substance.
What Exactly Is a North Star Metric?
A north star metric is the single metric that best shows whether your business is delivering core value to customers in a way that supports long-term growth.
Think of your analytics setup like a ship. Your daily KPIs are the compass. They help you steer in the moment. The north star metric is the fixed point above you. It tells you whether your direction is right in the first place.
The three tests a real NSM should pass
A metric isn't a north star just because leadership says it is. It needs to earn that role.
Here are the three tests I use.
-
It reflects customer value
The number should rise when customers are getting more of the thing they came for. If people buy, return, collaborate, read, book, or complete a meaningful task more often, the metric should capture that. -
It shows progress in strategy
The metric should move when the business improves the product, experience, or journey in the right way. It needs to connect to the actual work teams do. -
It points toward future revenue
It usually shouldn't be revenue itself. It should be a strong behavioural signal that tends to lead to commercial results later.
A useful test is simple. If this metric grows, do you believe the business is healthier for the right reasons?
What a north star metric is not
Teams confuse NSMs with several other metric types.
| Metric type | What it does | Why it isn't your north star metric |
|---|---|---|
| Vanity metric | Looks impressive in a deck | It doesn't prove customer value or durable progress |
| Lagging metric | Confirms what already happened | It arrives too late to guide day-to-day action |
| Team KPI | Helps a function manage performance | It's too narrow to align the whole business |
| OMTM | Focuses a team or project for a short period | It's temporary, not your long-term reference point |
A page-view target, for example, might help a content team. It rarely works as a north star metric. Quarterly revenue matters deeply, but it's often too lagging and too broad to guide product and experimentation choices in real time.
Why the concept became so widely used
The north star metric framework is used broadly across modern product and growth teams. Its popularity surged in the post-2010s, influenced heavily by thought leadership from companies such as Amplitude and CXL, even though specific UK adoption figures aren't well documented in the available material, as noted by CXL's overview of the framework's growth.
That wider popularity makes sense. Businesses needed a way to simplify complexity without pretending complexity had vanished.
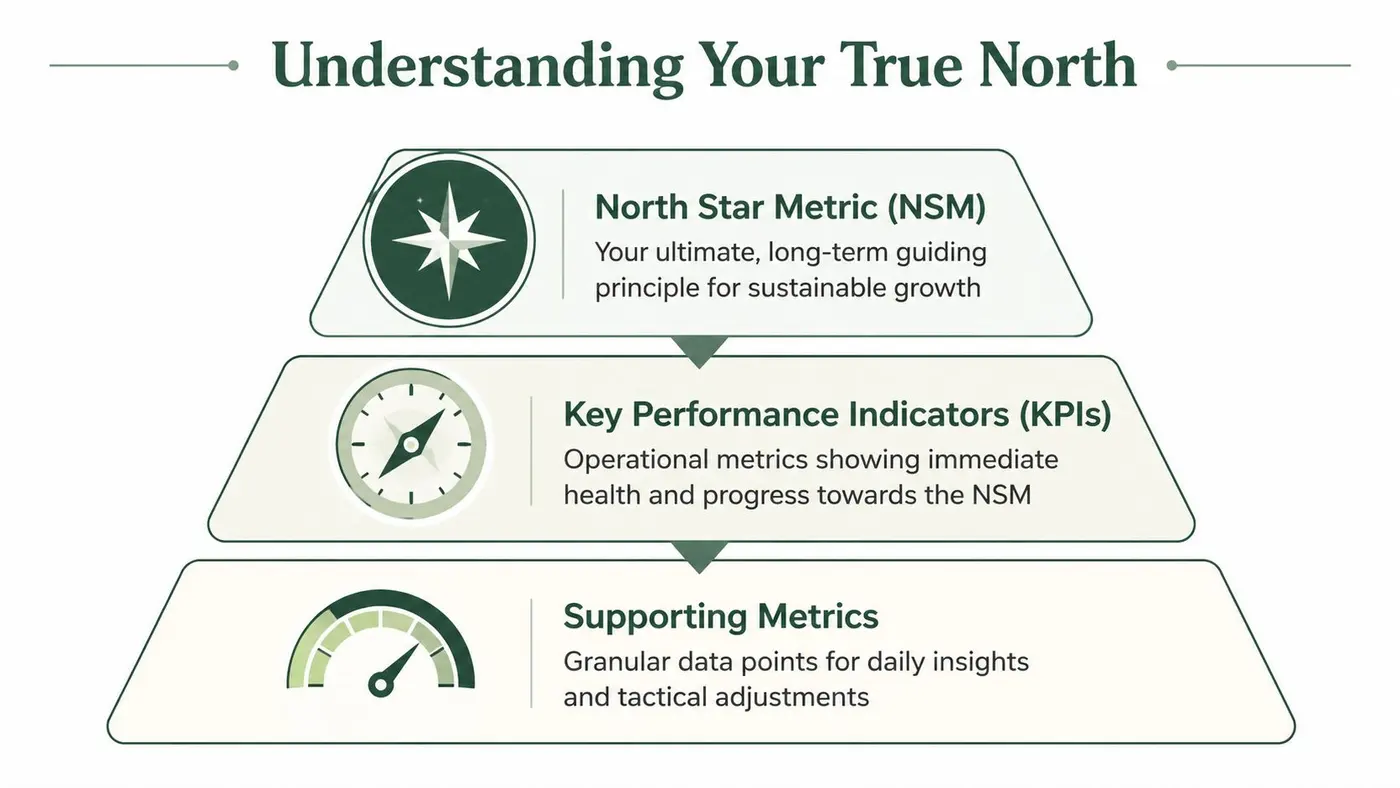
A simple mental model
Use this hierarchy:
- North star metric for company direction
- KPIs for operational health
- Supporting metrics for diagnosis and improvement
If your north star metric is "weekly active customers", your KPIs might include activation, repeat purchase, and retention. Your supporting metrics might include checkout completion, product page CTR, headline response, or coupon usage.
That distinction matters. The NSM isn't supposed to replace everything else. It's supposed to organise everything else.
A Framework for Choosing Your North Star Metric
Picking a north star metric shouldn't be a top-down naming exercise. It works better as a workshop. Get product, growth, commercial, and analytics people in the same room. Start with the customer value your business creates, then test possible metrics against that reality.
Start with the value moment
Before you name a metric, answer this question: what must happen for a customer to feel they got what they came for?
For different products, that answer changes.
- In e-commerce, it might be a meaningful purchase and then a repeat order.
- In SaaS, it might be a team completing the core workflow together.
- In media, it might be sustained reading or viewing, not just a visit.
- In onboarding, it might be reaching the first moment of real utility quickly.
If the room can't agree on the value moment, don't choose a metric yet. You're still debating strategy, not measurement.
Put candidate metrics through five filters
Teams often generate several decent options. The hard part is filtering them.
It should capture broad customer value
Ask whether the metric rises when more customers get meaningful value, not when a small slice of users does more of something noisy.
A metric dominated by a handful of power users can distort priorities. You want something that reflects the experience of the business you're building.
It should be easy to understand
If only analysts can explain the definition, the metric won't travel well across the company.
A good north star metric can be explained in one sentence. Everyone should know what counts, what doesn't, and why it matters.
Decision check: If a designer, an engineer, and a marketer define the metric differently, the metric isn't ready.
It should move often enough to be useful
A metric that barely changes until quarter end may still matter, but it won't help teams make weekly decisions.
You need enough sensitivity to spot whether product changes, campaign shifts, and experiments are working. That doesn't mean chasing volatility. It means choosing a signal that updates fast enough to guide action.
It should connect to business outcomes
Often, teams pick the wrong star. They choose a metric that feels product-friendly but has no credible commercial link.
That link doesn't need to be perfect, but it should be believable. If the metric improves for the right reasons, the business should expect healthier revenue, retention, or account expansion over time.
It should be influenceable by multiple teams
The best NSMs create shared ownership. Marketing, product, engineering, lifecycle, and support should all be able to affect the number in some way.
If only one department can move it, it's not functioning as a company-level guide.
A workshop exercise that works well
Use a simple scorecard. List your candidate metrics and rate them qualitatively against these questions:
| Candidate metric question | Strong signal | Weak signal |
|---|---|---|
| Does it show customer value? | Closely tied to the core job | Mostly activity for its own sake |
| Can people understand it quickly? | Plain definition | Complex or disputed logic |
| Does it move often enough? | Trackable in a practical rhythm | Too slow or too noisy |
| Does it connect to outcomes that matter? | Clear commercial relevance | Hard to relate to growth |
| Can several teams influence it? | Shared ownership | Narrow ownership |
You don't need fake precision here. A thorough discussion is more useful than a spreadsheet pretending certainty.
Common traps during selection
Teams often go wrong in one of four ways:
- They pick revenue too early: Revenue matters, but it often pushes teams toward short-term extraction rather than durable value.
- They choose a metric that's too upstream: Sign-ups and traffic are often too shallow.
- They choose a metric that's too downstream: A metric that updates too slowly won't help execution.
- They inherit a popular example: Another company's NSM can inspire you, but it can't decide for you.
The best north star metric usually sits in the middle. Close to customer value. Close enough to business results. Responsive enough to guide action.
A useful tie-breaker
If you're split between two candidates, ask one final question: which metric would most improve product and experimentation decisions if everyone used it every week?
That's usually the stronger choice.
Real-World North Star Metric Examples
The easiest way to understand a north star metric is to see how different business models express customer value differently. A strong NSM always fits the product's core behaviour. It isn't copied from a trend deck.
North Star Metric Examples by Business Model
| Business Model | Example | North Star Metric | Why It Works |
|---|---|---|---|
| B2B SaaS | A whiteboarding or collaboration tool | Weekly collaborating teams | It tracks whether teams are using the product together, which usually reflects habit, value, and account stickiness better than raw sign-ups |
| E-commerce | A Shopify store selling repeat-purchase products | Customers placing their second order | The second order often shows the first purchase wasn't a one-off and that the proposition is working beyond acquisition |
| Product onboarding | A SaaS app with a setup flow | New users completing the core action within 7 days | It focuses the team on getting users to value quickly, rather than just generating account creation |
| Media or content | A subscription or ad-supported publisher | Total monthly reading time | It captures depth of engagement more meaningfully than page views alone |
| Marketplace | A service connecting buyers and sellers | Successful transactions completed | It represents realised value on both sides, not just browsing or intent |
| Consumer app | A habit-based app | Weekly active users completing the core habit | It avoids flattering usage spikes and anchors the metric in repeated value |
Why these examples work better than generic traffic metrics
The pattern is consistent. The metric is strongest when it captures a value event, not just an audience event.
Traffic can rise for weak reasons. Social engagement can spike because of a campaign. Downloads can jump because of paid promotion. Those numbers can be useful, but they don't necessarily show that the product is becoming more valuable to the user.
The best examples measure what customers actually receive, not what the company merely exposes them to.
How to adapt examples without copying them blindly
A lot of teams borrow examples too exactly. They hear "DAU" or "nights booked" and assume they need an equally famous metric shape.
That usually creates confusion. A better move is to take the logic behind the example.
Ask:
- What is the customer's core outcome?
- What repeat behaviour proves they experienced it?
- What frequency fits the product's natural usage pattern?
For one business, "weekly active users" might be perfect. For another, it might be superficial. A high-consideration purchase journey, for instance, may need a metric tied to successful progression and repeat behaviour rather than daily activity.
A quick self-check for your own example
If your proposed NSM sounds good in a board meeting but wouldn't help a PM choose between two experiments, it's probably too vague.
If it helps a team say, "This test matters because it should increase the behaviour that represents real customer value," you're much closer.
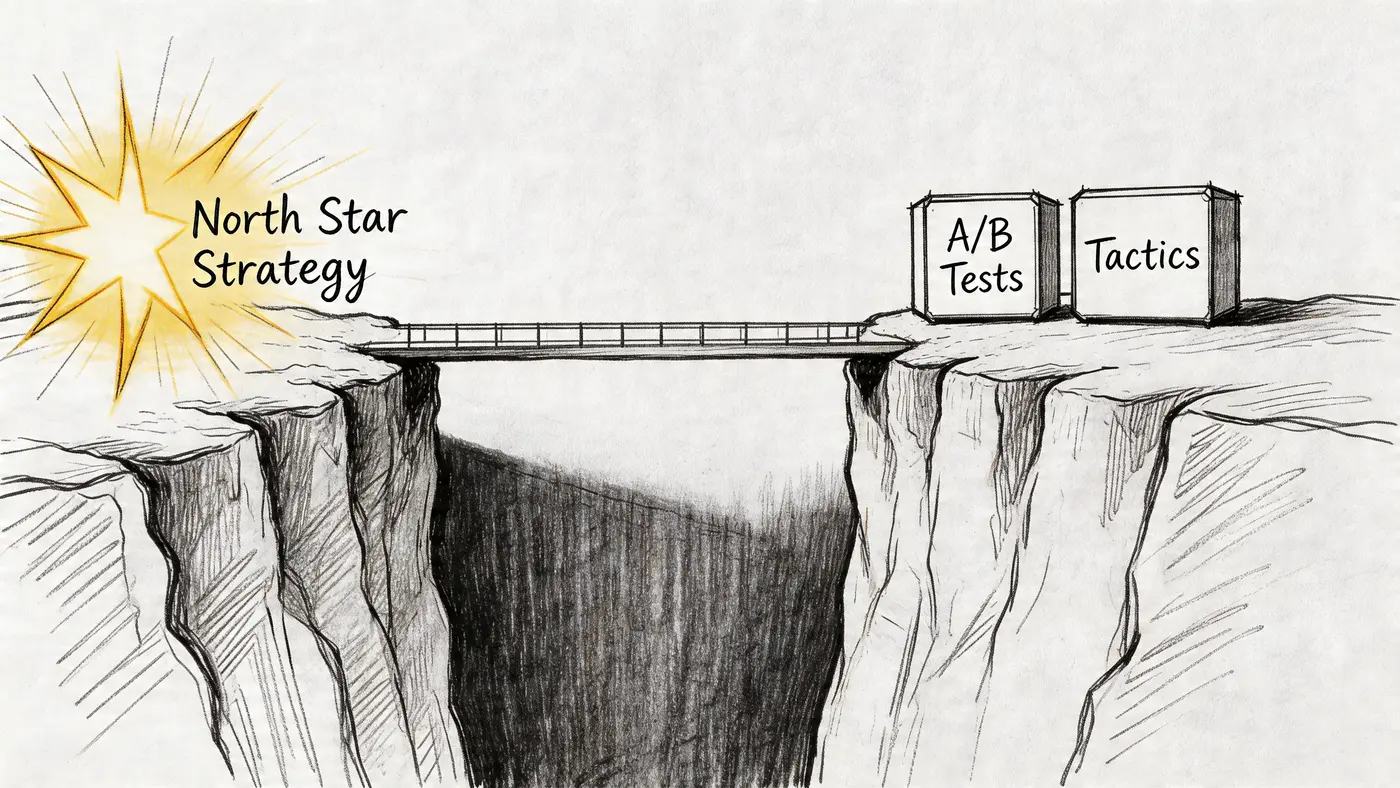
From North Star to A/B Test How to Connect Strategy and Tactics
Teams often struggle with this: They choose a north star metric, put it in a slide, and then go back to running tests on whatever is easiest to measure.
That breaks the chain between strategy and execution.
Build a metric hierarchy
A north star metric becomes actionable when you place it at the top of a metric hierarchy.
Think of it as three levels:
| Level | Purpose | Example if NSM is weekly active customers |
|---|---|---|
| North star metric | Company-level direction | Weekly active customers |
| Driver metrics | The levers most likely to move the NSM | Activation rate, repeat purchase rate, retained customer rate |
| Experiment metrics | The immediate outputs of tests | CTA clicks, checkout starts, form completion, product page engagement |
This is the missing bridge.
An onboarding test might not move the north star metric directly in a week. But if it improves activation, and activation is a known driver of weekly active customers, the test is strategically relevant.
Decide what each test is really trying to move
Every A/B test needs two answers before it launches:
- Which driver metric are we trying to influence?
- How does that driver connect to the north star metric?
Without those answers, teams default to local wins. A test increases clicks. Great. But did those clicks lead to stronger commercial or customer outcomes? Sometimes yes. Often not.
This is why it's useful to separate test-level success from north-star relevance.
- A test-level success metric tells you whether the variant beat control on the immediate behaviour.
- A north-star relevance check tells you whether that behaviour is worth improving in the first place.
What this looks like in e-commerce
In UK e-commerce, this connection is especially clear when the business focuses experiments on value-linked goals rather than surface activity. A 2024 UK Digital Commerce Report found that Shopify merchants focusing A/B tests on NSM-related goals such as average order value saw 17 to 24% quarterly revenue growth, while those chasing vanity metrics saw 5 to 8%, according to Amplitude's discussion of product north star metrics.
That contrast is the whole point of the framework. Tests aimed at the right metric stack tend to create better business outcomes than tests aimed at cosmetic movement.
A practical example of the chain
Say your north star metric is customers placing a second order.
Your driver metrics might include:
- First-order product satisfaction signals
- Post-purchase return rate
- Email reactivation response
- Time to second purchase
Now your experiments have context.
A product page test might aim to improve purchase quality, not just conversion rate. A post-purchase email test might aim to shorten the gap to second purchase. A cart test might aim to improve order composition rather than maximise discounts.
When the metric hierarchy is clear, teams stop asking, "Did this test win?" and start asking, "Did this test improve a driver that matters?"
Where customer value keeps teams honest
This is also why teams should understand the commercial value of better customer behaviour, not just the conversion event itself. If you're working on repeat purchase, retention, or account quality, it helps to understand ideas such as long-term value and contribution margins. For a useful grounding, see Toki's insights on customer value.
That kind of thinking prevents a common mistake. Teams optimise for cheap wins that look positive in-platform but weaken the customer relationship over time.
How to plan experiments from the north star down
A simple planning routine works well:
-
Name the NSM clearly
Make sure everyone agrees on the business-level outcome. -
List the main drivers
Limit this to a manageable set. Too many, and the framework loses force. -
Map each current experiment to one driver
If a test can't be mapped, question why it's on the roadmap. -
Choose a primary metric and guardrails
Track the immediate behaviour and watch for side effects. -
Review wins by hierarchy, not in isolation
A result isn't strategically useful just because it is statistically neat.
If your team needs help shaping a backlog around this logic, a practical starting point is this guide on deciding what to A/B test.
The key mindset shift
The north star metric shouldn't replace experimentation metrics. It should rank them.
That means a test on checkout copy, a homepage hero, or an onboarding flow still needs a narrow success metric. But the team should only prioritise that test if the narrow metric has a credible path to a driver that feeds the north star.
That's how strategy stops being abstract. It shows up in backlog order, test design, and post-test decisions.
How to Measure and Socialise Your North Star Metric
A north star metric only becomes useful when people can see it, trust it, and talk about it in the same way.
Plenty of companies choose a good metric and then bury it in a quarterly deck. That defeats the point. The metric should live in the operating rhythm of the business.
Put the metric somewhere everyone can find it
Start with one visible dashboard. The north star metric should sit at the top, with its main drivers beneath it. Keep definitions close to the chart so new team members don't have to guess what they're looking at.
The dashboard doesn't need to be flashy. It needs to be clear.
Include:
- A plain-language definition so people know what counts
- A consistent time cadence so trend lines are comparable
- A small set of drivers so movement can be interpreted
- Recent experiment or initiative notes so changes have context
Use a cadence that supports action
Reviewing the metric weekly is often beneficial. Daily can become noisy. Monthly can be too slow for product and growth teams trying to learn quickly.
A weekly rhythm usually gives enough responsiveness without pushing everyone into overreaction.
Operating habit: Review the NSM in the same meeting every week, even when nothing dramatic happened. Consistency builds trust.
Connect it to planning and OKRs
A north star metric becomes part of company language when it appears in planning documents, sprint reviews, leadership updates, and OKRs.
A simple structure works well:
-
Objective
Improve the value customers get from the product -
Key Result
Increase the north star metric over the agreed time period -
Team-level contributions
Product, marketing, CRM, and optimisation teams each own a driver metric that supports that result
This keeps the NSM central without pretending every team should use exactly the same KPI day to day.
If your team needs a refresher on building reliable measurement habits around support metrics, this guide on how KPIs are measured is a useful companion.
Make ownership explicit
The metric belongs to the company, but responsibility still needs names attached.
A good setup usually includes:
| Role | Responsibility |
|---|---|
| Executive sponsor | Protects the metric from constant redefinition |
| Analytics or data lead | Owns the definition and reporting logic |
| Functional leaders | Own the driver metrics their teams can influence |
| Teams running experiments | Attach changes and learnings back to the driver layer |
Without that ownership, people start debating the number instead of improving it.
Socialise learnings, not just snapshots
Teams don't need more score reporting. They need interpretation.
When the metric changes, circulate short notes that answer three questions:
- What changed
- Why we think it changed
- What we're doing next
That habit trains the organisation to treat the north star metric as a decision tool, not a vanity chart.
The more often teams connect experiments, launches, and campaigns back to the metric hierarchy, the faster the NSM stops feeling abstract and starts guiding real work.
Common North Star Metric Mistakes to Avoid
The north star metric is simple in theory. Teams still get it wrong in predictable ways.
The good news is that most mistakes are visible early, if you know what to watch for.
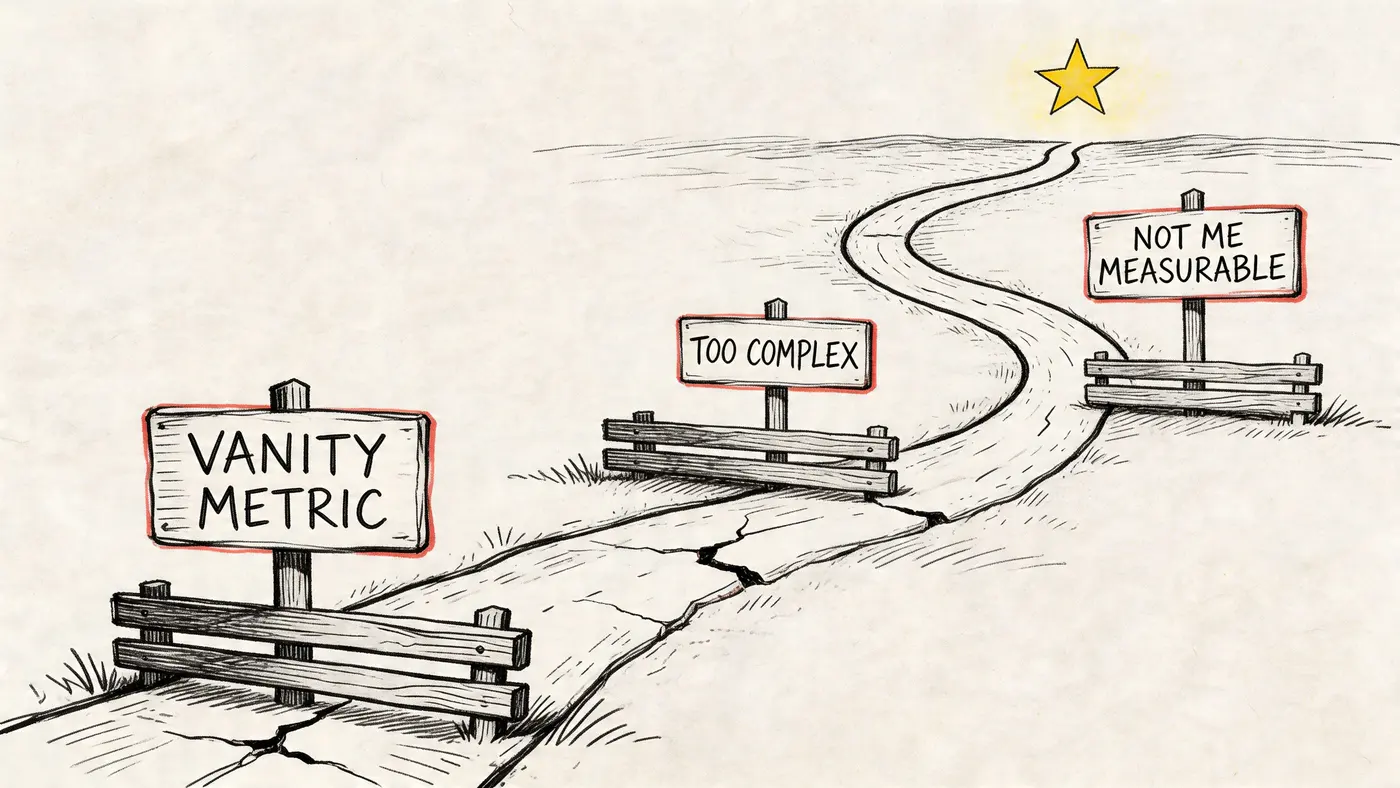
Mistake one, choosing a flattering metric
Some teams pick the number that looks best in a board pack. Traffic. Sign-ups. impressions. Add-to-cart rate.
These can be useful supporting metrics. They're often poor north stars because they can grow while customer value stays flat.
Antidote: choose a metric tied to a completed value moment, not just attention or intent.
Mistake two, treating revenue as the whole answer
Revenue matters, but using it as the NSM can push teams into short-term extraction. Discounts, aggressive upsells, and misleading nudges can make the top line look better while weakening retention or customer trust.
For e-commerce teams, that risk is why commercial reporting should include profitability and quality, not just ad efficiency. If you work in Shopify, this perspective on smart profit tracking for Shopify is a useful reminder that winning metrics need to reflect actual business health.
Antidote: pick the customer behaviour that tends to create healthy revenue, not revenue in isolation.
Mistake three, making the metric too complex
If the formula needs a training session every time you onboard someone, adoption will be weak.
People support what they understand. They ignore what feels like a black box.
A strong north star metric should be simple enough to explain quickly and rigorous enough to trust.
Antidote: simplify the definition. If needed, keep complexity in the driver layer rather than in the NSM itself.
Mistake four, never revisiting the choice
A business changes. Product strategy evolves. Customer behaviour shifts. The metric that fit an early-stage product may not fit the next phase.
Teams sometimes cling to an outdated NSM because changing it feels like admitting failure. It isn't. It's maintenance.
Antidote: review the north star metric periodically and ask whether it still reflects the product's core value and strategic direction.
Mistake five, ignoring secondary effects
A narrow improvement can damage something more important. A variant might lift the primary test metric while harming order quality, retention, or customer trust.
That's why secondary metrics matter in experimentation. If your team tends to overfocus on one headline result, this article on why secondary metrics matter helps frame the issue well.
Antidote: use guardrails. A test should support the metric hierarchy, not game one number.
Mistake six, confusing the NSM with every team's main KPI
The NSM gives direction. It doesn't eliminate functional metrics.
When leadership says, "This is our only important number now," teams either rebel or quietly keep doing their own thing. Both outcomes are avoidable.
Antidote: treat the north star metric as the top of the system. Then give each team clear driver metrics and supporting metrics they can influence.
A good north star metric doesn't reduce complexity by denial. It reduces complexity by organisation.
If you want a faster way to connect experiments to meaningful business outcomes, Otter A/B helps teams test headlines, CTAs, layouts, and revenue-driving changes without adding friction to the site experience. It's built for marketers, PMs, and CRO teams that want cleaner experimentation, clearer results, and a more direct path from test ideas to measurable growth.
Stop guessing
Ready to start testing?
Set up your first A/B test in under five minutes. No credit card required.
- 14-day free trial
- No credit card required
- Cancel anytime