How to Figure Out Conversion Rate: Step-by-Step
Discover how to figure out conversion rate with our guide. Get formulas, tracking, segmentation, and learn to tie CRO to revenue with expert insights.
You’re probably looking at a dashboard right now that says your site converted “fine” last month, but you still can’t answer the question that matters. Was that rate good, was it measured properly, and did it produce meaningful revenue?
That’s where many organizations get stuck. They know conversion rate matters, but they treat it like a surface-level KPI instead of an operating metric. The result is bad decisions, shaky test conclusions, and reports full of percentages that don’t help anyone decide what to do next.
How to figure out conversion rate starts with simple maths. It gets useful when you define the right conversion, track it cleanly, segment it properly, and tie the result to money. That’s the difference between “our rate is 3%” and “this variation made the business more revenue with enough confidence to roll it out”.
Mastering the Core Conversion Rate Formula
A team launches a homepage test, sees one variant convert at 3.4% and the other at 2.9%, and calls the winner too early. Then finance asks a better question. Which version produced more revenue, and are we confident the difference is real? That starts with the basic formula, but the formula only helps if the numerator and denominator match the business question.
Conversion Rate (%) = (Number of Conversions ÷ Total Measured Opportunities) × 100
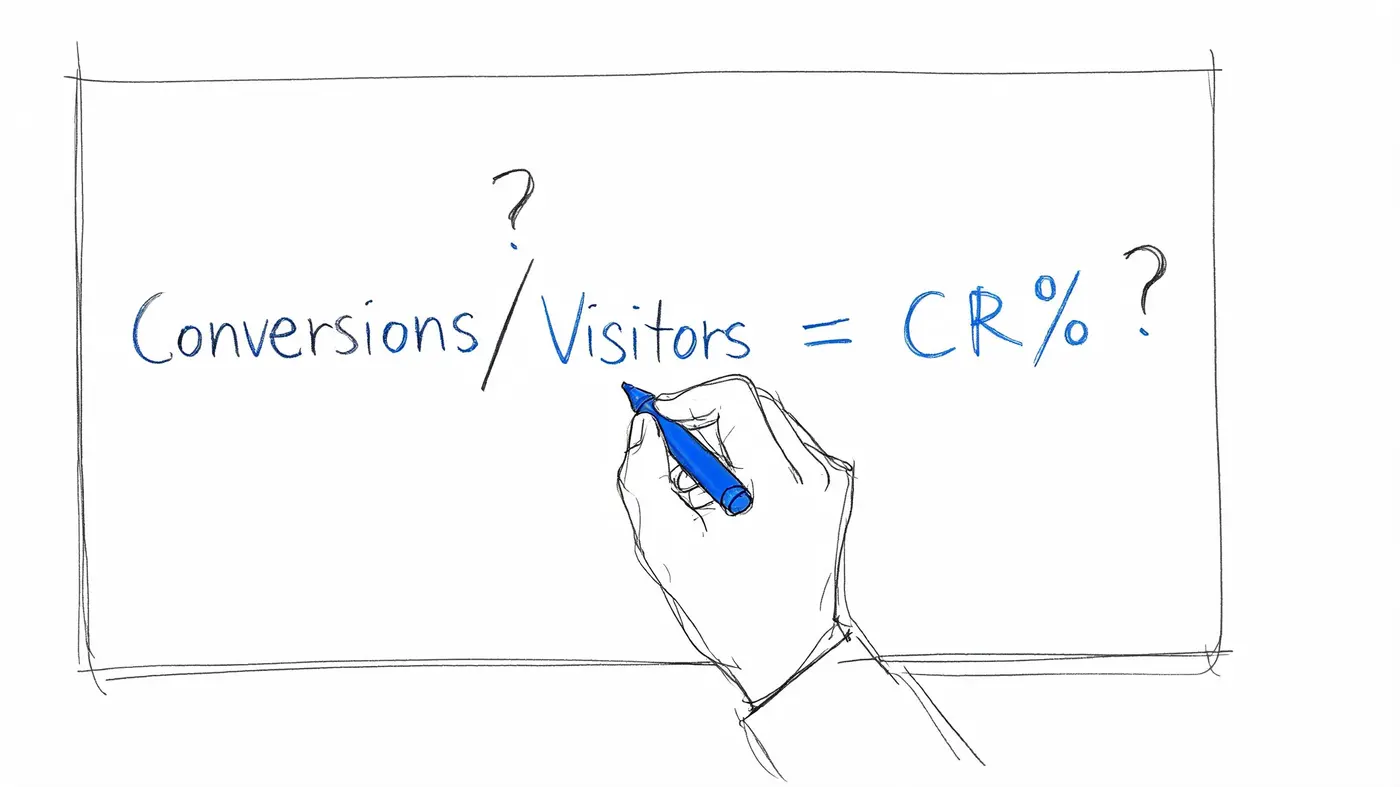
If an online store gets 5,000 visitors and records 150 purchases, the calculation is (150 ÷ 5,000) × 100 = 3%. The maths is easy. The decision-making gets harder once you ask whether "visitor" means users, sessions, or eligible experiment participants.
Define the conversion before you calculate it
A conversion is the action that creates value in that business model.
For e-commerce, that is usually a completed purchase. For lead generation, it may be a qualified form submission, not every raw lead. For SaaS, it might be a trial start, a booked demo, or a paid activation. I see teams get into trouble when they report all three in the same chart and treat them as interchangeable. They are not.
Use one primary conversion for each report and each test. Keep secondary actions such as add-to-cart, email signup, or pricing-page clicks as supporting metrics. That keeps the headline number tied to a real commercial outcome instead of a loose proxy.
Choose a denominator you can defend
The denominator decides what your rate means.
If you use users, you are measuring the share of people who converted. If you use sessions, you are measuring the share of visits that converted. If you use experiment exposures in a tool such as Otter A/B, you are measuring the share of eligible variant viewers who converted. All three can be valid. Problems start when a team compares one denominator against another and mistakes a tracking change for performance improvement.
A practical rule helps here. Match the denominator to the decision:
- Users for broad site performance reporting
- Sessions for channel or landing-page analysis where repeat visits matter
- Experiment participants or exposed visitors for A/B tests
That discipline matters more than chasing a benchmark. Industry averages can provide context, but they do not tell you whether your pricing, traffic mix, or checkout flow is healthy. If you need a clean refresher on the basic definitions, Otter A/B’s guide to what conversion rates are is a useful reference for aligning teams before they start comparing numbers.
The formula is simple. Business reality is not.
A 3% conversion rate can be strong or weak depending on what sits underneath it.
Take two examples. A B2B software site with low traffic and high contract value may accept a lower form completion rate because each qualified demo can be worth thousands in pipeline. A consumer brand selling lower-priced products may need stronger purchase rates and higher average order value to make paid acquisition work. Same formula. Different economics.
This is also why I do not stop at the blended sitewide rate. Averages hide where the money comes from. One variant can produce a lower conversion rate and still win on revenue if it lifts average order value. One traffic source can look inefficient on conversion rate and still be profitable if customer lifetime value is stronger. Good CRO work connects the percentage to money and then checks whether the observed lift is statistically credible before rollout.
That is the difference between reporting and decision-making.
If the goal is improvement, calculate the rate cleanly, define the business event with precision, and read the result in context. Then use that baseline to test pages, offers, and flows that can change revenue. For teams looking for practical next steps after the calculation, these actionable CRO strategies are a useful starting point.
Instrumenting Your Website for Accurate Tracking
The formula is clean. The data feeding it often isn’t.
Most conversion rate errors don’t come from bad maths. They come from poor instrumentation. Teams fire a page test without verifying the purchase event, count duplicate form submissions, or treat half-configured analytics as if they’re production-grade data. Once that happens, every later conclusion becomes fragile.
Start with one conversion map
Before you open Google Analytics, Tag Manager, Shopify, or anything else, write down the journey you want to measure.
For most sites, that means identifying:
- Primary conversion: The end action that creates revenue or qualified pipeline.
- Support events: Steps that show intent, such as add-to-cart, checkout start, or form start.
- Failure points: Errors, validation problems, payment failures, or abandonment points.
This sounds basic, but it stops a common problem. Teams often track whatever is easy to implement rather than what reflects commercial reality.
Configure analytics before you test anything
Your analytics platform should tell you whether the event fired, where it fired, and whether it can be segmented later. If your purchase event works only on desktop, or your thank-you page can refresh and trigger duplicates, your conversion rate will look better than reality.
A practical setup usually includes:
- One named primary event that represents the main conversion.
- Consistent event rules across templates, devices, and subdomains.
- Clear validation using test transactions or internal QA traffic.
- A record of exclusions, such as staff traffic or duplicate reload behaviour.
If a large share of your demand comes through paid social, server-side event reliability matters too. This guide on how to improve Meta ad tracking with CAPI is useful when browser-side tracking is dropping attribution or undercounting downstream conversions.
Add experimentation tracking without polluting the site
Once analytics is stable, then bring testing into the mix. The goal isn’t just to show variant A and B. It’s to connect each variant to the same conversion event definition you already trust.
According to VisionLabs on conversion rate measurement, one advanced approach used by UK CRO specialists is sequential testing after establishing a historical baseline, such as 2.1% for WooCommerce fashion. That reference also notes a 99.9% uptime SDK, monitoring the z-score daily, and halting at p<0.05. In that dataset, the method reported a 75% success rate in declaring winners and reduced opportunity cost by 40% compared with fixed-horizon testing. It also cites UK WordPress sites improving from 1.9% to 3.8% with CTA variants.
Those figures are useful for context, but the operational lesson is simpler. A/B testing only works when the experiment platform and analytics layer are measuring the same business event.
Here’s a good reference point before setup work gets too deep: visitor statistics for websites.
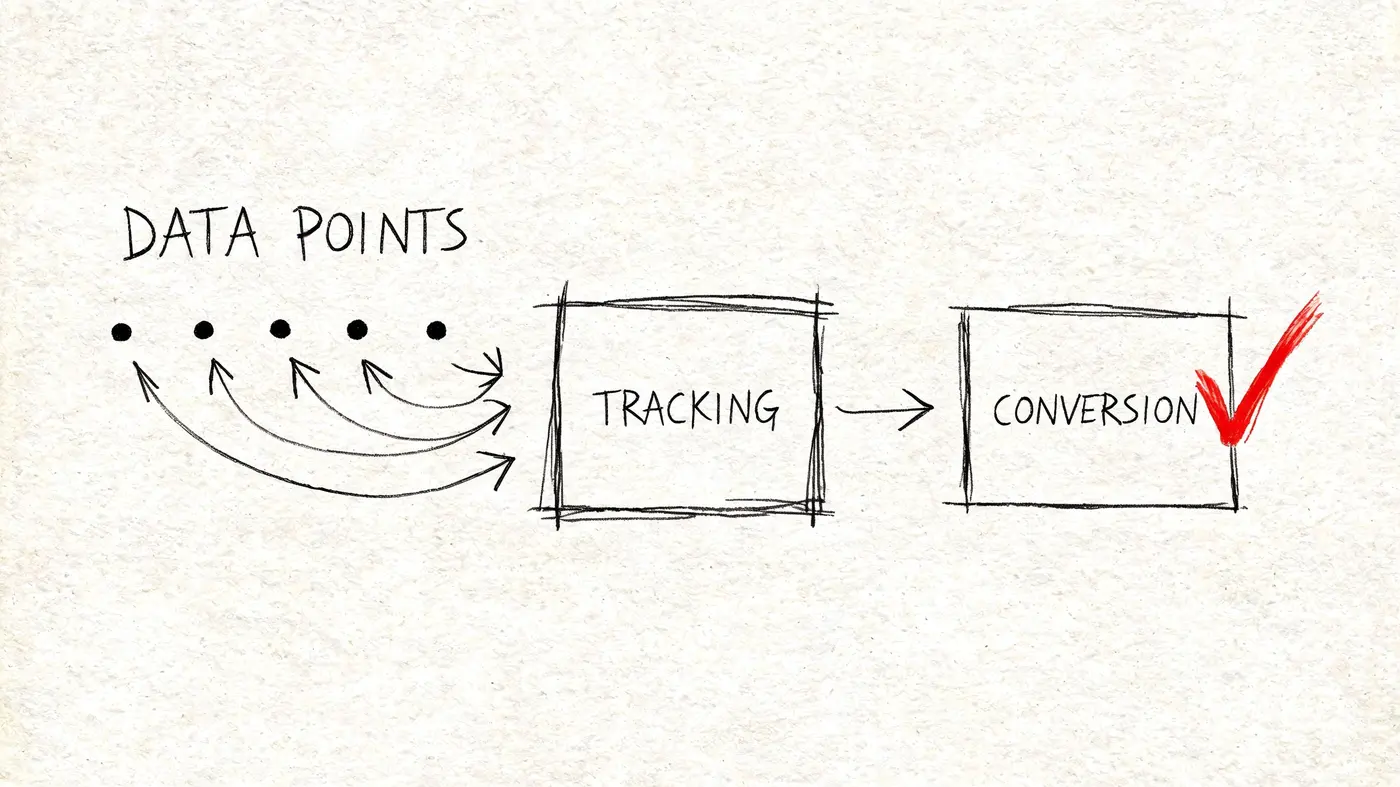
After the tracking layer is stable, this walkthrough can help your team visualise the implementation flow:
Don’t stop at macro conversions
If you only track final purchases or form submissions, you’ll miss where friction starts.
Custom JavaScript goals are useful for actions like CTA clicks, add-to-cart, accordion opens, or checkout progression. These don’t replace revenue events, but they help you diagnose why the final rate moves. When a headline variation increases add-to-cart but hurts completed orders, that’s a meaningful signal. Without micro-conversions, you’d only see a flat test and learn nothing.
Good instrumentation should answer two questions at once: did people convert, and where did the ones who didn’t get stuck?
Moving Beyond Averages with Segmentation and Attribution
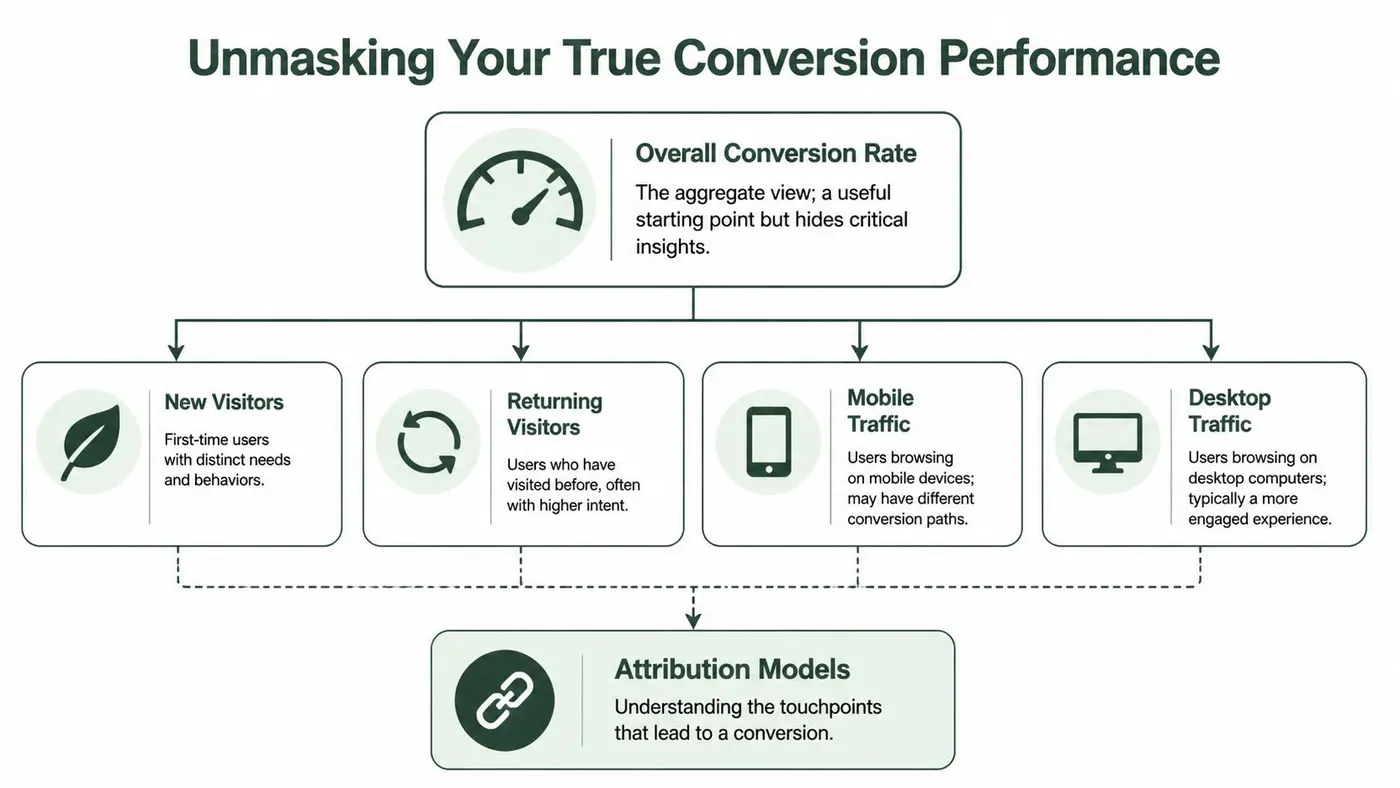
An overall conversion rate is like a doctor checking temperature and ignoring everything else. It tells you something, but not enough to diagnose the problem.
If your site converts at a blended average, that number can hide severe differences between channels, devices, locations, and user types. One segment may be performing well enough to mask another that’s collapsing.
Segment the traffic before you judge the rate
The most useful way to figure out conversion rate is to calculate it several times for meaningful groups, not once for everyone.
CXL’s conversion rate methodology recommends a regional, step-by-step approach that includes segmenting traffic by UK-specific sources such as organic search from google.co.uk, defining conversions as UK postcode-validated purchases, and using a 30-day rolling window to account for seasonality. The same reference says that for A/B tests, a frequentist z-test at 95% confidence with a minimum of 1,000 UK sessions per variant is important for significance, and that 68% of UK Shopify tests reach a winner declaration within 14 days at that volume.
That matters because segmentation isn’t just for nicer reporting. It changes how you interpret the result.
The segments that usually reveal the truth
I would begin with a brief list instead of creating a complex dashboard maze. These segments generally suffice to reveal the true story:
| Segment | What it helps you see |
|---|---|
| Channel | Whether search, social, email, or direct traffic is driving efficient conversions |
| Device | Whether the mobile journey is introducing friction desktop users never face |
| New vs returning | Whether the site persuades first-time visitors or relies on existing intent |
| Landing page | Whether specific entry points are weakening the overall average |
| Geography | Whether local relevance, shipping, or messaging affects buyer intent |
When teams skip this step, they often optimise the wrong thing. They see a mediocre overall rate and redesign a product page, when the actual issue is that paid social traffic lands with low intent and should be handled with different messaging.
The average conversion rate is a summary. Segmentation is the diagnosis.
Attribution changes the story again
Even after you segment, attribution can still distort what you think caused the conversion.
If you judge everything on a last-click basis, email often looks stronger than it really is because it closes demand that other channels created. If you lean too hard on first-click, you can overvalue awareness campaigns that introduced the visitor but didn’t help them decide.
You don’t need a complicated attribution argument to make better decisions. You need consistency and awareness of the trade-off.
A practical approach looks like this:
- Use last-click for operational landing page review. It’s useful when you want to know which session closed the action.
- Check first-click for acquisition context. It helps explain which channels introduce qualified users.
- Compare both before cutting spend. If one channel rarely gets last-click credit but repeatedly appears early in high-quality journeys, it may still matter.
- Review by landing page intent. A category page, collection page, and offer page rarely deserve the same attribution expectations.
Don’t confuse reporting neatness with insight
The reason segmentation works is simple. People don’t arrive with the same intent, device constraints, or context. Treating all visits as interchangeable makes the calculation easier, but the interpretation worse.
For a UK store, segmenting by source can be especially revealing. Organic traffic often behaves differently from paid campaigns. Returning visitors may tolerate more friction because they already trust the brand. First-time mobile users may abandon because the form, layout, or checkout is harder to complete.
When you ask how to figure out conversion rate, the correct answer isn’t just “divide conversions by visitors”. It’s “divide the right conversions by the right visitors, inside the right segment, for the right time window”.
Understanding the Statistics Behind Your Rate
A test has been live for three days. Variant B is up 18%. Slack is celebrating, a stakeholder wants it pushed today, and revenue still has not moved in a meaningful way. That is the moment statistics matter.
A higher observed conversion rate is only the starting point. The essential work is deciding whether the lift is likely to persist, and whether it is large enough to justify rollout.
What significance means in plain English
Statistical significance answers a practical question: if you ran this test again with similar traffic, would you expect the result to hold up, or was this probably randomness?
The common benchmark is 95% confidence. In practice, that means the evidence is strong enough to act without pretending certainty. There is still risk. There is always risk. The point is to reduce the chance of shipping a false winner.
That matters because early results are often noisy. A handful of extra conversions can make one variant look far better than it really is, especially on lower-traffic pages or higher-friction forms.
Why confidence matters more than excitement
Teams usually get into trouble in one of two ways. They stop a test too early because the chart looks good, or they keep reading tiny changes as meaningful when the uncertainty is still wide.
I treat confidence as a decision filter, not a vanity metric. If the interval around the result is still broad, the honest conclusion is that the business does not know enough yet. For a plain-English explanation, this guide to what a confidence interval is in statistics explains why the range matters as much as the headline lift.
Tools can calculate that range for you. Otter A/B, for example, can show whether a variant is outperforming control with enough confidence to warrant action. The useful part is not the math on the screen. The useful part is avoiding a rollout that creates extra work, muddles reporting, and fails to improve revenue once the novelty wears off.
The framework I use before calling a winner
Before I recommend shipping a variant, I check four things:
-
One primary conversion goal
The test needs a single success metric. If the team starts switching between clicks, form fills, and checkout starts halfway through, the result loses credibility. -
Stable tracking
Broken events create fake certainty. If one variant fires the conversion event differently, the test result is contaminated before any statistical analysis begins. -
Confidence with a meaningful effect size
A result can be statistically significant and still too small to matter commercially. A tiny lift on a low-value action rarely deserves engineering time. -
Business context
If the winning variant creates lower-quality leads, lower-margin orders, or more support demand, the percentage alone is not enough.
This is why I rarely present significance in isolation. Stakeholders do not fund experiments to get prettier charts. They fund them to improve sales, lead quality, or margin.
Use statistics to make better commercial decisions
Confidence helps answer, “Is the result real enough to trust?” It does not answer, “Should we care?”
That second question is where many teams fall short. A test can reach confidence and still be a poor business decision if the upside is trivial. The opposite can also happen. A variant with promising revenue impact but incomplete confidence may deserve a longer run instead of an early rejection.
The same discipline applies outside classic A/B tests. If a support-led intervention increases conversions, you still need to measure whether the lift is consistent and profitable. For example, brands that boost sales with live chat should judge that channel by conversion quality and repeatable performance, not by a short burst of assisted orders.
A sound statistical read protects revenue in both directions. It stops teams from shipping noise, and it stops them from discarding changes that need more time to prove their value.
Tying Conversions to Real Business Revenue
A conversion rate can improve while the business makes less money. That’s why experienced teams don’t stop at the percentage.
This is the point where a lot of CRO programmes drift off course. They celebrate a lift in conversions without checking order value, lead quality, margin, or downstream sales outcome. The report looks great. Finance remains unimpressed.
A better question than “did the rate go up?”
Ask this instead: did this variation create more commercial value?
That changes the interpretation immediately. A checkout variation that generates more orders at lower basket value may not be the winner. A product page variant that converts fewer visitors but increases order size could be far more valuable.
The verified benchmark data backs the need for context. In the UK, a “good” sales conversion rate often falls in the 2% to 5% range, with variation by business model and traffic quality, according to SendTrumpet’s guide to good sales conversion rates. That same source cites 3.2% for ASOS in 2022, 2.4% as an average for WooCommerce and Webflow stores, 3.1% for UK organic search, and 5.8% for email. It also makes an important point for lead generation: sometimes the more relevant metric is lead-to-sale rate, such as 20 sales from 32 qualified leads, which equals 62.5%.
Those are very different contexts. A single blended site conversion rate can’t tell the whole story.
Revenue per variant is where experimentation gets serious
When I’m reviewing test outcomes with a commercial team, I want to see more than winner labels. I want to see how each variant affected revenue trends and order value.
That matters because a page doesn’t exist to “convert”. It exists to help the business earn profitable revenue. Once you frame it that way, some common optimisation habits start to look shallow.
For example:
- A higher click-through rate on a CTA might send less qualified visitors into checkout.
- A shorter form may increase submissions but lower lead quality.
- A more aggressive offer can lift immediate conversion while shrinking margin.
This is also why support layers matter. If your visitors need reassurance before buying, tactics that boost sales with live chat can change the commercial outcome, not just the raw conversion rate, by resolving objections at the moment of hesitation.
Use conversion rate as a lens, not the finish line
There’s nothing wrong with caring about the rate. It’s one of the fastest ways to judge whether a journey is doing its job.
The problem starts when teams optimise for that number in isolation. That leads to shallow wins, like pushing discount-heavy messaging that inflates conversions while weakening average order value. It also leads to bad internal communication, because stakeholders care less about the elegance of your test design than the commercial effect.
A more disciplined reporting view usually includes:
| Metric | Why it matters |
|---|---|
| Conversion rate | Tells you how efficiently traffic turns into the target action |
| Average order value | Shows whether the quality or size of purchase changed |
| Revenue per variant | Connects the page change directly to commercial impact |
| Lead-to-sale rate | Helps B2B teams assess submission quality, not just quantity |
The strongest CRO work doesn’t chase prettier percentages. It improves the economics of existing traffic.
If a variant converts slightly fewer visitors but increases order value enough to produce stronger revenue, that can be the right call. Stakeholders understand that immediately because it maps to business reality, not dashboard vanity.
Common Conversion Rate Pitfalls to Avoid
A team launches a test on Monday. By Wednesday, one variant is up 18%, Slack is celebrating, and somebody asks engineering to ship it by Friday. Two weeks later, the lift is gone, average order value is down, and nobody can explain what changed.
That pattern is common because conversion rate errors usually come from bad interpretation, not broken tracking. Clean dashboards can still produce expensive decisions if the team reads too much into a small sample, ignores segment differences, or treats a percentage lift as the whole story.
Calling a winner before the result is stable
Early movement is not a decision.
Small samples swing hard. A few extra purchases from high-intent users can make a variant look far stronger than it is. Then traffic mix shifts, weekday intent changes, or returning visitors enter the sample and the lead disappears.
The practical rule is simple. Wait until the test clears your confidence threshold and check whether the projected gain still matters in revenue terms. A variant that looks good at 3 days and weak at 14 days was never a winner.
Confusing novelty with improvement
New layouts often get a short-term reaction because visitors notice the change. That reaction can help for a few days without improving the underlying user journey.
I look for whether the variant still holds once repeat visitors have seen it, the audience mix normalises, and the change no longer feels fresh. If the lift depends on surprise, it will not hold up well after rollout.
A winner should keep working after the novelty wears off.
Running experiments that slow the site down
Testing setup affects results. If the tool introduces flicker, delays rendering, or shifts the page after load, you are no longer measuring just the idea. You are measuring the friction the implementation added.
That matters because page speed has a direct commercial effect. Kissmetrics' article on calculating conversion rate references Google UK research showing lower conversion rates on pages with poor Largest Contentful Paint performance. The exact lesson for CRO teams is straightforward. Keep test delivery light enough that the experiment does not distort the user experience.
This is one reason lightweight tools matter in practice. If a platform such as Otter A/B can run a variant without adding noticeable load overhead, the result is more likely to reflect the page change rather than the testing layer.
Trusting the blended site rate
Sitewide averages are easy to report and easy to misread.
A blended conversion rate can hide the fact that mobile users are struggling, paid social traffic is low intent, or returning visitors are carrying the entire number. The average may look healthy while one profitable segment is leaking revenue every day.
The fix is to read the rate where it is earned. Break results down by device, channel, visitor type, and key landing page. That is usually where the underlying problem appears.
Measuring only the final conversion
Purchase rate or lead rate tells you the outcome. It does not tell you where the journey failed.
If tracking stops at the final event, teams miss the drop-offs that explain lost revenue. Useful diagnostic points include:
- CTA clicks without the next-step view
- Cart creation without checkout start
- Form start without completion
- High email signup rate but weak sales conversion from the same traffic source
These are not vanity metrics if they are tied to a real funnel question. They show where intent is present but the path breaks.
Strong CRO work protects measurement quality before anyone debates winners and losers. That means waiting for stable results, checking segments, keeping the testing layer fast, and judging outcomes by commercial impact, not a flattering percentage alone.
Stop guessing
Ready to start testing?
Set up your first A/B test in under five minutes. No credit card required.
- 14-day free trial
- No credit card required
- Cancel anytime