What Are Conversion Rates? Boost Your Revenue
Unpack what are conversion rates, their formula, and industry benchmarks. Learn how to improve them with A/B testing strategies to boost your revenue.
A familiar problem shows up in almost every growth team. Traffic is coming in, the campaign dashboard looks busy, and stakeholders see healthy visit numbers. But sales don't move much. Demo requests stay flat. Cart revenue feels lower than it should. You’re left with a site that looks active without clearly growing the business.
That’s usually the moment people start asking a better question. Not “How do we get more visitors?” but “What are those visitors doing once they arrive?”
That’s where conversion rates become useful. They connect attention to outcomes. They tell you whether your pages are persuading people to buy, sign up, book, enquire, or move one step closer to revenue. Without that lens, traffic can be misleading. A busy shop with no one reaching the till still has a sales problem.
For a new growth marketer, this metric can feel more technical than it is. In practice, it’s one of the simplest ways to understand whether your website is helping the business or just absorbing budget. Once you grasp the basics, you can use conversion rates to spot friction, prioritise tests, and tie website changes to commercial results like revenue uplift, profitability, and average order value.
Your Website Gets Traffic But Is It Growing Your Business
Your dashboard says sessions are up. Paid campaigns are spending efficiently. Product pages are getting views. Then the finance view comes in and a key question appears. Are those extra visits producing more sales, more qualified leads, or more profit?
That question separates activity from growth.
A website helps the business only when visitor attention turns into a meaningful action. For an ecommerce brand, that action may be a purchase. For a SaaS company, it may be a trial start or booked demo. For a B2B services firm, it may be a qualified enquiry that can turn into pipeline.
Traffic on its own is a bit like footfall outside a shop. A busy pavement looks encouraging, but revenue comes from people who walk in, find what they need, and reach the till. Websites work the same way. Visits create opportunity. Conversions create commercial value.
A page with fewer visitors can still produce more revenue if a higher share of those visitors become customers.
That is why conversion rate matters to growth marketers. It shows how efficiently your site turns attention into outcomes. If two landing pages attract similar traffic, but one generates more purchases or sales calls, the stronger page is not just "performing better" in a vague sense. It is producing more value from the same acquisition spend.
This is also where profitability enters the picture. Buying more traffic usually increases cost first. Improving conversion rate can increase revenue from visitors you already paid to acquire. In practice, that can mean lower cost per acquisition, stronger return on ad spend, and more headroom to scale campaigns without wasting budget.
For a new marketer, conversion work can sound technical or heavy. It does not have to be. Modern tools such as Otter A/B make it possible to test page changes with a lighter setup, so teams can improve messaging, layout, and user journeys without dragging down site speed or Core Web Vitals. That makes optimisation more accessible, especially for lean teams that need practical gains rather than long development cycles.
The Core Concept of a Conversion Rate
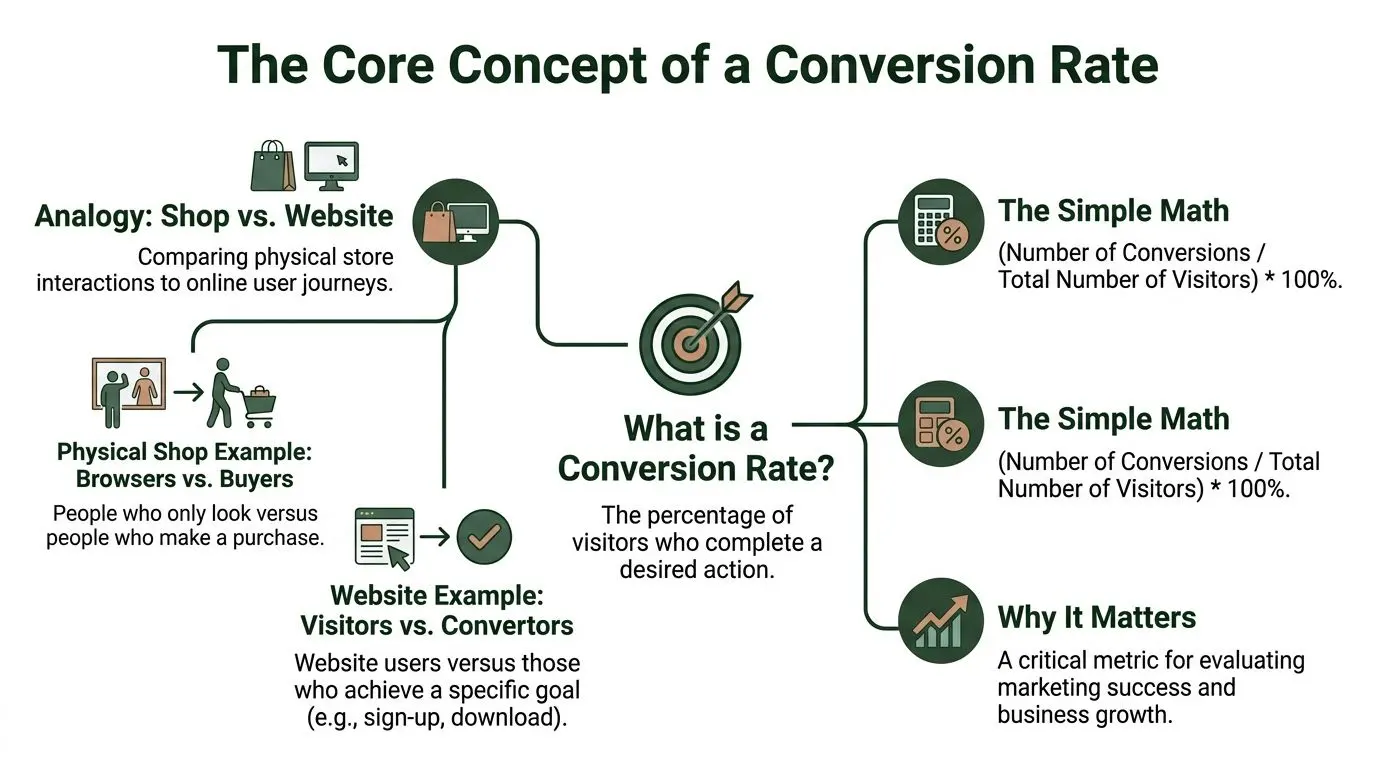
A conversion rate is the percentage of visitors who complete a desired action on your website.
That action depends on your goal. It could be a sale, a newsletter signup, a trial start, a quote request, or a booked call. The site visitor arrives. Some leave. Some continue. A smaller group completes the action you care about. Your conversion rate tells you how large that group is relative to total visitors.
A physical shop offers a good comparison. Plenty of people may walk in, browse shelves, and leave. A smaller number take an item to the till and pay. Online, the same thing happens. Visitors arrive, look around, and only some become customers or leads.
If you want a useful companion metric while learning this, visitor statistics for websites can help you separate traffic volume from visitor quality.
The simple formula
The basic formula is:
Conversion rate = (Conversions / Visitors) × 100
If 100 people visit a page and 5 of them buy, the conversion rate is 5%.
If 200 people visit a landing page and 10 fill in the form, the conversion rate is also 5%.
The maths is simple because the value comes from interpretation, not arithmetic.
| Scenario | Visitors | Conversions | Conversion rate |
|---|---|---|---|
| Online shop purchase page | 100 | 5 | 5% |
| Demo request page | 200 | 10 | 5% |
| Newsletter signup page | 50 | 2 | 4% |
Why marketers get confused
The confusing part isn't the formula. It's deciding what counts as a conversion.
A conversion isn't always a purchase. It’s any action that moves a visitor towards commercial value. That means different teams can track different conversion rates on the same site. A content marketer may care about email signups. A product team may care about account creation. A sales-led business may care about demo requests.
Practical rule: pick the action that most directly supports revenue, then track the smaller actions that lead towards it.
Once you start thinking this way, conversion rates stop being abstract. They become a way to answer a concrete question: of the people we worked hard to attract, how many moved the business forward?
Macro vs Micro Conversions The Big Goals and Small Wins
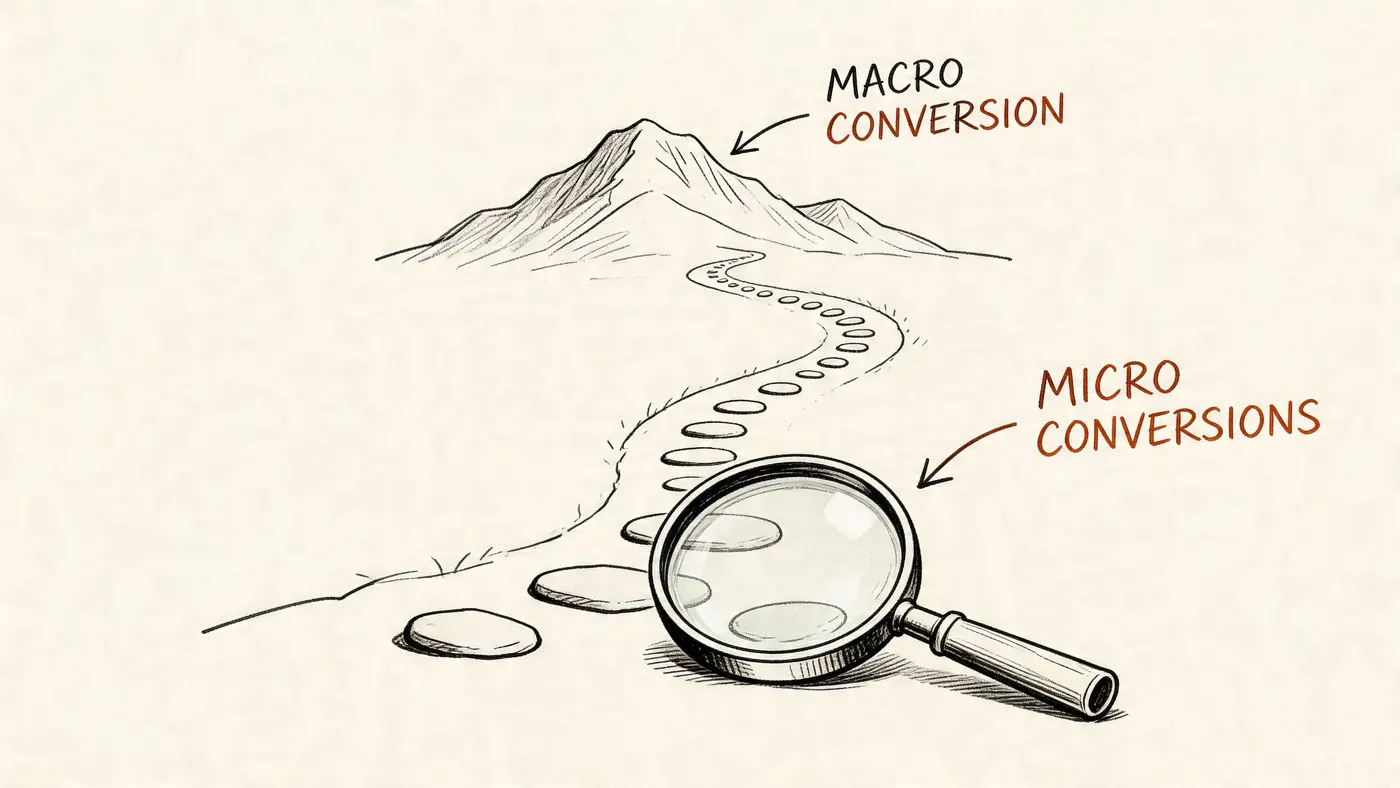
Most websites don't have a single moment of decision. They have a sequence. That’s why strong CRO teams separate macro conversions from micro conversions.
A macro conversion is the main business goal. A purchase. A paid signup. A demo request. A completed lead form.
A micro conversion is a smaller action that shows intent. An add-to-cart. A click on pricing. A form start. A visit to checkout. A download of a brochure or guide.
Why both matter
If you only track the final sale or lead, you miss the story of how people got there, or where they got stuck.
Say a product page gets traffic, people click “Add to basket”, and then abandon before payment. That’s not a traffic problem. It’s not even necessarily a product-page problem. It may be checkout friction, trust concerns, or a payment issue. Micro conversions help you isolate that.
For lead generation sites, the same principle applies. UK sales conversion rates averaged 2.8% for B2C leads in Q1 2025, while 68% of drop-offs happened at form submission stages, where forms averaged 9.3 fields and the optimal number was closer to 4.1, based on the Salesforce State of Sales UK Report and Formisimo UK heatmap data. That’s a clear reminder that the smaller steps often determine whether the big goal happens at all.
Three common examples
E-commerce
For an online store, the macro conversion is usually the purchase.
Micro conversions might include:
- Product view: the visitor showed interest in a specific item.
- Add to basket: they moved from browsing to buying intent.
- Checkout start: they were close enough to reveal real commercial interest.
If purchases are low but add-to-basket actions are healthy, the leak is probably later in the journey.
SaaS
For a SaaS product, the macro conversion might be a free trial, booked demo, or paid subscription.
Useful micro conversions often include:
- Pricing page visit: the visitor is evaluating fit.
- Account creation start: they’re crossing from interest into action.
- Feature exploration: they’re testing whether the product solves their problem.
That tells you whether weak trial numbers come from poor traffic, weak messaging, or onboarding friction.
B2B lead generation
For a service business, the macro conversion might be a consultation request or contact form submission.
Important micro conversions can include:
- Service page visit: they’re checking relevance.
- Case study or testimonial view: they’re looking for proof.
- Form start: they had enough intent to begin, even if they didn’t finish.
If you improve a micro conversion at a bottleneck, you often lift the macro conversion without changing traffic at all.
This is why experienced marketers don't just watch the final number. They map the path. The path tells you what to fix.
How to Calculate Your Conversion Rate Correctly
The formula is simple, but the denominator trips people up. Are you dividing by users or by sessions?
That choice changes the story you tell.
A user-based conversion rate asks: “Of the people who visited, how many converted?”
A session-based conversion rate asks: “Of the visits we received, how many ended in a conversion?”
Neither is automatically wrong. They answer different questions.
User-based versus session-based
If your business has a longer buying cycle, user-based measurement is often more useful. Someone might visit three times before converting. Counting the person once can give you a cleaner picture of audience quality.
If you're reviewing landing-page performance, paid traffic, or campaign efficiency, session-based measurement can be useful because each visit reflects an opportunity created by a channel or message.
Here’s the practical difference:
| Method | Best for | What it tells you |
|---|---|---|
| User-based | Longer consideration journeys | How many people eventually converted |
| Session-based | Campaign and landing page analysis | How efficiently each visit converts |
If a user visits twice before buying, session-based conversion will usually look lower than user-based conversion. That's not an error. It reflects repeat visits before action.
Three worked examples
E-commerce purchase
If a store gets 1,000 sessions in a week and 20 purchases happen, session-based conversion is 2%.
If those 1,000 sessions came from 800 users and 20 of those users purchased, user-based conversion is 2.5%.
The session view tells you how efficiently the traffic converted. The user view tells you how many people were won over.
SaaS free trial
A prospect may read a feature page on Monday, come back from email on Wednesday, and start a trial on Friday.
If you care about landing-page efficiency, sessions help. If you care about audience quality and how many people ultimately start trials, users help more.
Lead generation form
For a B2B services page, a user may revisit several times before submitting. Counting sessions can make conversion appear weaker than it is, especially when decision cycles are longer.
Use one primary method consistently. If you switch between users and sessions from report to report, stakeholders will think performance changed when only the method changed.
When you build reporting, define the metric clearly. Also document what counts as a conversion event. If your team needs help setting those definitions, this guide on how KPIs are measured is a useful reference for keeping marketing metrics consistent.
What Is a Good Conversion Rate UK Industry Benchmarks
A UK growth marketer logs into analytics and sees a 2.3% conversion rate. Is that healthy, weak, or a sign that revenue is being left on the table?
The answer depends on context. Conversion rate only becomes useful when you read it alongside business model, traffic source, and profit per conversion. A legal firm, an industrial supplier, and an ecommerce brand can all post very different rates and still be performing well for their category.
Earlier benchmark data in this article showed that UK averages vary by industry, with professional services tending to convert higher than legal, and industrial sitting somewhere in the middle. Treat those numbers as a reference point, not a target copied blindly.
2026 UK Average Conversion Rates by Industry
| Industry | Average Conversion Rate (%) |
|---|---|
| All websites in the UK | 4.1 |
| Professional services | 4.6 |
| Industrial | 4.0 |
| Legal | 3.4 |
Benchmarks work like a speedometer, not a sat nav. They tell you how fast you are going relative to others. They do not tell you whether you are headed toward profitable growth.
That distinction matters. A site can beat an industry average and still disappoint the finance team if order values are low, margins are thin, or paid acquisition costs are too high. The opposite can also happen. A lower conversion rate can still produce better profit if the leads are stronger or the average order is larger.
Why benchmarks can mislead
A benchmark blends together many different situations. Brand traffic converts differently from cold traffic. Returning visitors behave differently from first-time visitors. High-intent service pages usually convert differently from broad educational content.
That is why a single headline number rarely answers the question your team actually cares about, which is whether your website is turning attention into profitable action.
Use industry benchmarks for three practical jobs:
- Set a starting point: if your rate is well below similar businesses, there may be friction worth investigating.
- Prioritise where to look: the issue might be weak message match, a slow page, unclear proof, or poor traffic quality.
- Set commercial targets: aim for improvement that raises revenue and protects margin, rather than chasing an impressive-looking percentage.
What good looks like in practice
A good conversion rate is one that improves revenue per visitor without creating a worse user experience.
For example, if a landing page rises from 3% to 3.6%, that sounds modest. But with the same traffic and average order value, that lift can produce meaningful extra revenue. If the page stays fast and easy to use, the gain is even more valuable because you are not trading conversion for performance problems.
That is one reason lightweight testing tools matter. Platforms such as Otter A/B let teams test changes without adding the kind of page bloat that can hurt Core Web Vitals. For a small marketing team, that makes optimisation more practical. You can test messaging, layouts, and calls to action while keeping the site fast enough to support both rankings and conversions.
So, what is a good conversion rate in the UK?
A good rate is one that beats your current baseline, holds up by channel and device, and leads to stronger profit from the traffic you already pay for. Industry benchmarks give you the map reference. Your own revenue trend tells you whether the journey is working.
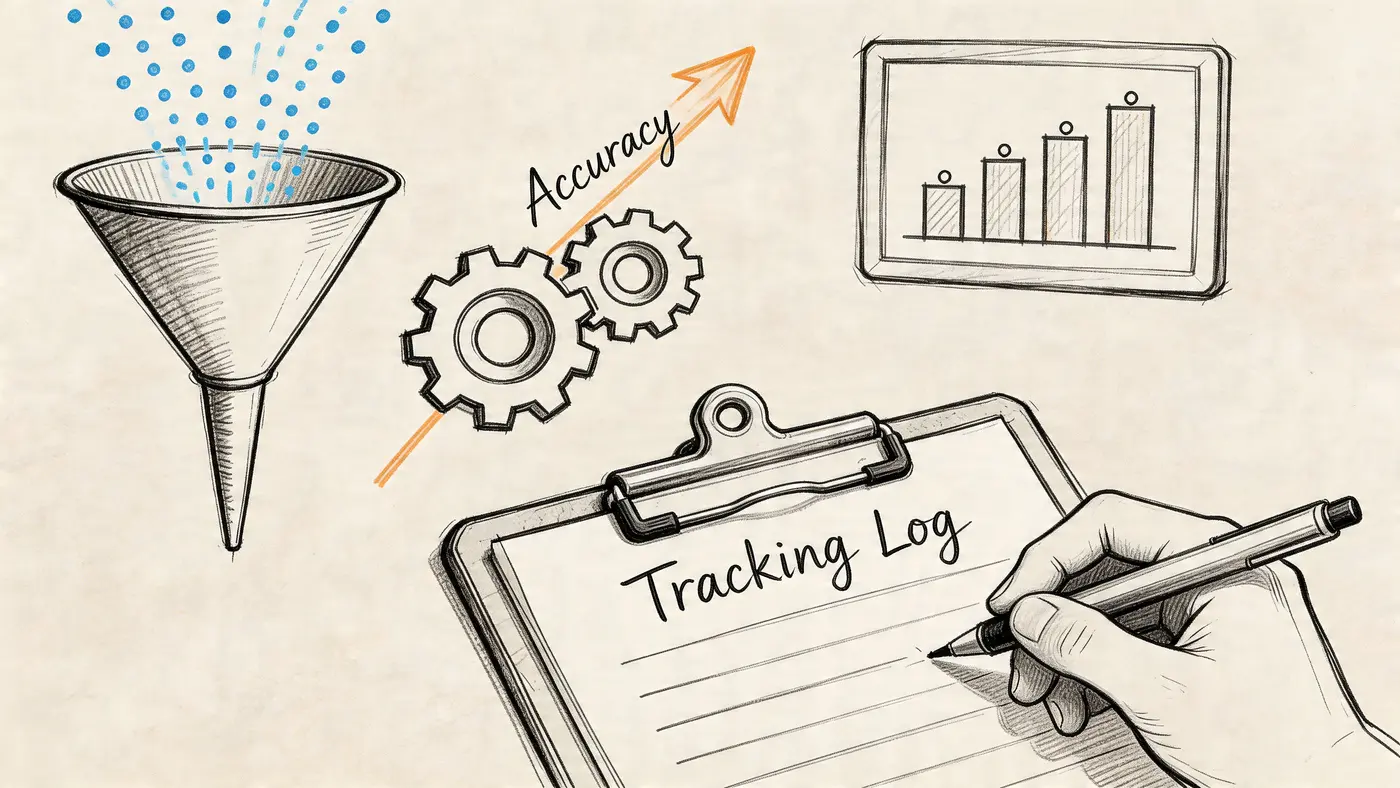
How to Accurately Measure and Track Conversions
Good optimisation starts with clean measurement. If your tracking is wrong, your tests won't teach you much, because you won't know whether a change helped, hurt, or failed to record properly.
Start with goal definitions
In Google Analytics, Google Tag Manager, or your commerce platform, define the exact actions that count. Keep them tied to business value.
Examples include:
- Purchase completed: use the confirmation page or transaction event, not button clicks alone.
- Lead submitted: track successful submission, not just form starts.
- Trial or signup created: rely on the account creation event, not a visit to the signup page.
Then filter obvious noise. Internal traffic, test orders, and bot visits can distort your baseline. If your own team triggers conversions while QA testing, the dashboard can look healthier than reality.
Segment before you diagnose
Blended data hides problems. Segment by device, traffic source, and visitor type.
A mobile user often has a very different experience from a desktop user. A returning visitor behaves differently from someone discovering you for the first time. Paid search traffic often has stronger intent than display traffic.
A useful setup includes:
- Device segments: desktop, mobile, tablet
- Channel segments: organic, paid, email, referral, direct
- Audience segments: new visitors and returning visitors
If all you track is one sitewide conversion rate, you won't know where to act.
Track the final step, not just the visible one
Many teams stop measurement at checkout start or form completion. That misses one of the most expensive leaks in the funnel: payment performance.
In the UK, average payment conversion rates stand at 78%, but they can drop to 65% when mandatory 3DS security checks are triggered, creating a hidden 10% to 15% conversion loss for merchants who don’t track gateway performance, according to Corefy findings summarised by Lucky Orange. If you only measure checkout starts and completed orders, you may blame the page when the payment layer is the core issue.
Track the handoff between checkout, payment gateway, authentication, and completed order. That's where revenue can disappear quietly.
If you need a simple way to visualise which parts of the journey are underperforming, a shared analytics dashboard can help teams compare funnels, channels, and conversion points without relying on scattered reports.
Actionable Strategies to Improve Your Conversion Rate
Improving conversion rate isn't about redesigning everything at once. It’s about finding friction, changing one meaningful variable, and measuring whether the result improves revenue.
That’s why A/B testing matters. It gives you a controlled way to compare an original page against a variant and see which one drives better outcomes.

Start where the money is leaking
One of the clearest opportunities in UK e-commerce is mobile. In 2023, UK e-commerce conversion rates were 3.12% on desktop and 1.53% on mobile, even though mobile drove 62% of traffic, based on UK e-commerce and page speed data cited in the verified benchmark set. That gap tells you where to look first. If most visitors arrive on mobile but convert at a much lower rate, mobile-specific testing can affect revenue quickly.
Good early tests often focus on:
- Call-to-action clarity: wording, placement, and prominence
- Form friction: field count, layout, and error handling
- Page hierarchy: what appears first, what gets ignored, what distracts
- Checkout usability: trust cues, payment options, and mobile input ease
Test one meaningful change at a time
You don't need a giant redesign to learn something useful. Small tests work when the hypothesis is clear.
Examples:
- Shorten a lead form because users appear to hesitate before submission.
- Change a product-page CTA because visitors scroll but don't act.
- Reorder mobile content so price, value proposition, and purchase action appear sooner.
A practical testing programme usually follows this rhythm:
- Observe behaviour: use analytics, session recordings, and funnel data.
- Form a hypothesis: decide why visitors might be dropping off.
- Build a variant: change the page element most likely to affect that problem.
- Measure the right outcome: not just clicks, but purchases, lead quality, or revenue.
Protect user experience while you test
Many teams hesitate to run experiments because they worry about page speed, layout flicker, or engineering overhead. That concern is legitimate. A testing setup shouldn't make the user experience worse while trying to improve it.
Tools matter here. Some teams use Google Tag Manager and in-house scripts. Others use dedicated experimentation platforms. One option is Otter A/B’s conversion rate optimisation best practices guide, which explains how teams test headlines, CTAs, and layouts while tracking outcomes like purchases, average order value, and revenue per variant. Otter A/B itself uses a lightweight 9KB SDK with sub-50ms load, zero flicker, 99.9% uptime, traffic splitting, and frequentist significance reporting at a 95% confidence threshold, which makes it relevant for teams trying to experiment without harming UX or Core Web Vitals.
For a broader playbook, this roundup of 10 Proven Ecommerce Conversion Rate Optimization Tips is a helpful companion because it pairs practical CRO ideas with common e-commerce friction points.
A quick visual walkthrough can help if you're new to experimentation:
Judge tests by business impact
The final mistake new marketers make is celebrating lifts that don't matter commercially.
A variant can improve click-through to a form but reduce lead quality. A product page can increase purchases while lowering average order value. A cleaner layout may help conversion rate, but if it pushes people towards lower-margin products, profitability may not improve.
Strong CRO teams don't stop at “more conversions”. They ask whether the variant created more revenue and better business outcomes.
That’s the right mindset. Conversion rate is the core metric, but revenue per variant, order value, and downstream profitability are what make the work credible to finance, founders, and commercial teams.
Conclusion From Metric to a Growth Mindset
Conversion rates look simple on paper, and they are. But the discipline around them is deeper than the formula. You’re not just measuring how many people clicked a button or submitted a form. You’re measuring how well your site turns attention into value.
That’s why the best marketers treat conversion rate as both a metric and a habit. They define the right goals, separate macro conversions from micro conversions, track data cleanly, segment performance, and test changes methodically. They also keep one eye on revenue, not just percentages on a dashboard.
That mindset matters even more when conditions get tougher. Amid post-2025 economic pressure in the UK, a more defensive CRO approach has emerged. Rather than chasing unrealistic jumps, some top-quartile sites have maintained steadier conversion rates in the 1.5% to 2.2% range by focusing A/B tests on average order value, according to Ruler Analytics. That’s a useful reminder that improvement isn't always about squeezing more people through the funnel. Sometimes it’s about making each conversion worth more.
If you remember one thing, make it this. A conversion rate isn't just a website metric. It's a live readout of how clearly you communicate value, how much friction you leave in the journey, and how efficiently your marketing spend turns into revenue.
If you want to turn conversion tracking into a practical testing programme, Otter A/B gives teams a straightforward way to run experiments on headlines, CTAs, and layouts while measuring outcomes that matter to the business, including purchases, average order value, and revenue per variant.
Ready to start testing?
Set up your first A/B test in under 5 minutes. No credit card required.