What Is a Good Ecommerce Conversion Rate
Our 2026 guide addresses what is a good ecommerce conversion rate. Get UK benchmarks & move beyond vanity metrics to drive real revenue with CRO.
A good UK ecommerce conversion rate is typically 2.5% to 3.5% for overall retail sites. But that average is a blunt instrument, and treating it as your target can push a team towards the wrong decisions.
That’s the advice I’d challenge first. Too much guidance on what is a good ecommerce conversion rate treats the number as if it exists in isolation, as though one store selling repeat-purchase skincare should judge itself by the same standard as a store selling high-consideration electronics. That’s not how real conversion work operates. Good conversion rates are shaped by traffic quality, device mix, customer familiarity, price sensitivity, and how much friction your funnel introduces at each step.
A benchmark is useful as a compass. It tells you whether you’re broadly healthy or whether something may be off. It does not tell you what your store should achieve next, which pages are costing you sales, or which tests are worth prioritising. The teams that improve fastest don’t obsess over matching a generic average. They segment their data, isolate where intent drops, and test changes that move revenue, not just a headline percentage.
Defining Your Ecommerce Conversion Rate
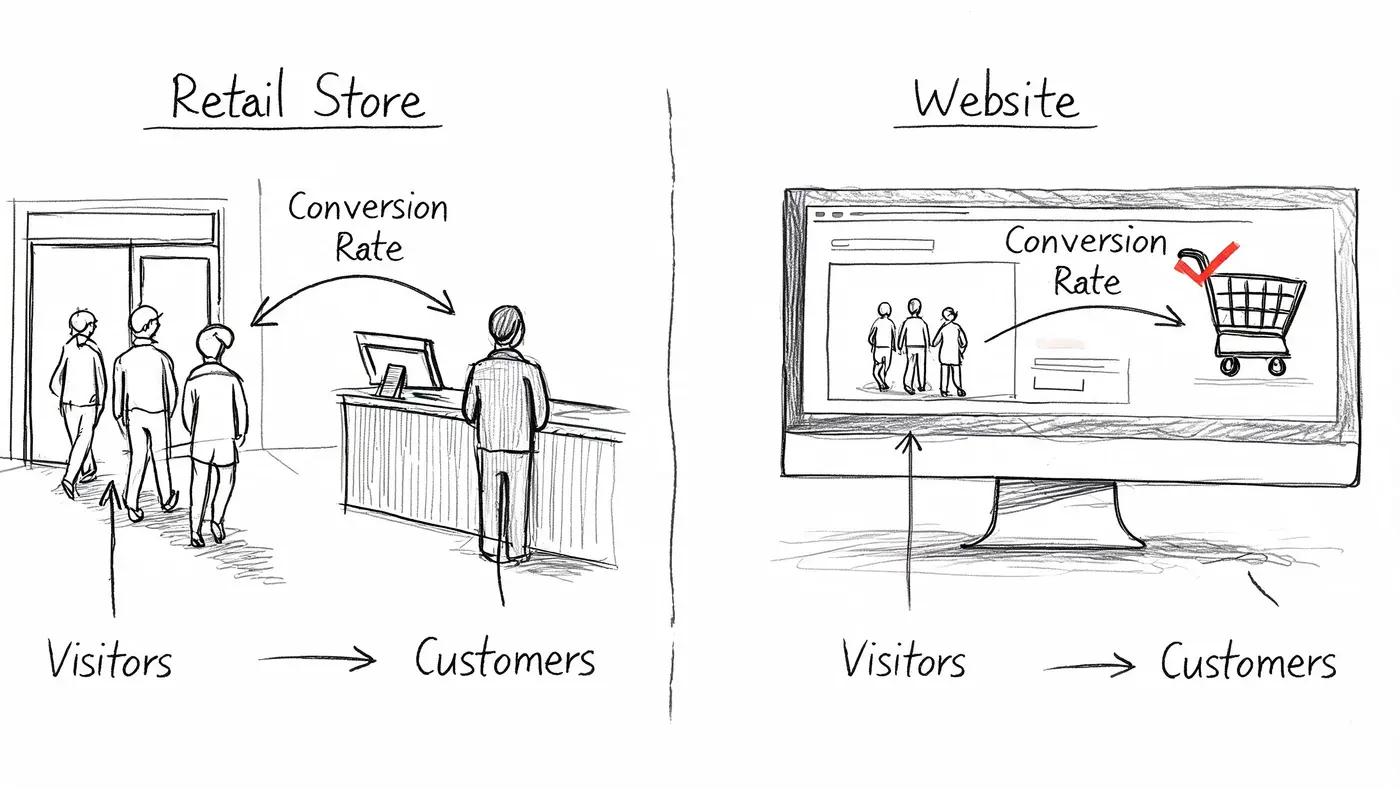
At its simplest, conversion rate is the percentage of visitors who take a desired action.
A physical shop provides an analogy. Lots of people may walk past the window, some come inside, fewer pick something up, and only some of those buy. Your website works the same way. Traffic is footfall. Orders are completed purchases. The conversion rate tells you how efficiently the site turns visits into outcomes.
The formula that matters
The standard formula is:
Conversions / Visitors x 100
If 1,000 visitors land on your site and 30 place an order, your ecommerce conversion rate is 3%.
That sounds straightforward, but teams often get into trouble because they stop at the formula and never agree on what counts as a conversion. For an ecommerce business, the primary conversion is usually a purchase. But depending on what you’re analysing, a conversion can also be a newsletter sign-up, an add-to-cart, a checkout start, or a product quiz completion.
Why the definition needs discipline
If one team member reports conversion based on all site visitors and another uses product-page visitors, both may be technically correct and still create confusion. The fix is consistency.
Use one clear definition for your headline metric, then track supporting micro-conversions separately. That gives you a clean top-line number and still lets you diagnose where intent weakens.
A practical setup usually includes:
- Primary conversion: completed purchase
- Mid-funnel conversion: add to cart or begin checkout
- Lead capture conversion: email sign-up, account creation, waitlist join
- Page-level conversion: action tied to a specific landing or product page
Practical rule: Never discuss conversion rate without naming the audience and action behind it.
That one habit prevents a lot of bad decisions.
If your team needs a simple refresher on calculation, this guide to how to figure out conversion rate is useful for aligning everyone on the same maths. For a broader CRO lens, Aureate Labs has a solid primer on improving eCommerce conversions that’s worth reviewing alongside your own analytics.
What the number can’t tell you on its own
A store-wide conversion rate is an average of many different behaviours. It blends new visitors and loyal customers. It combines mobile browsing with desktop buying. It hides whether your issue is weak product pages, poor checkout UX, or low-intent traffic.
That’s why the raw number matters less than commonly believed.
A 2.8% conversion rate could signal excellent performance for one business and wasted demand for another. Until you break it apart, you don’t know which.
UK Ecommerce Conversion Rate Benchmarks for 2026
A “good” UK ecommerce conversion rate is a weak target on its own.
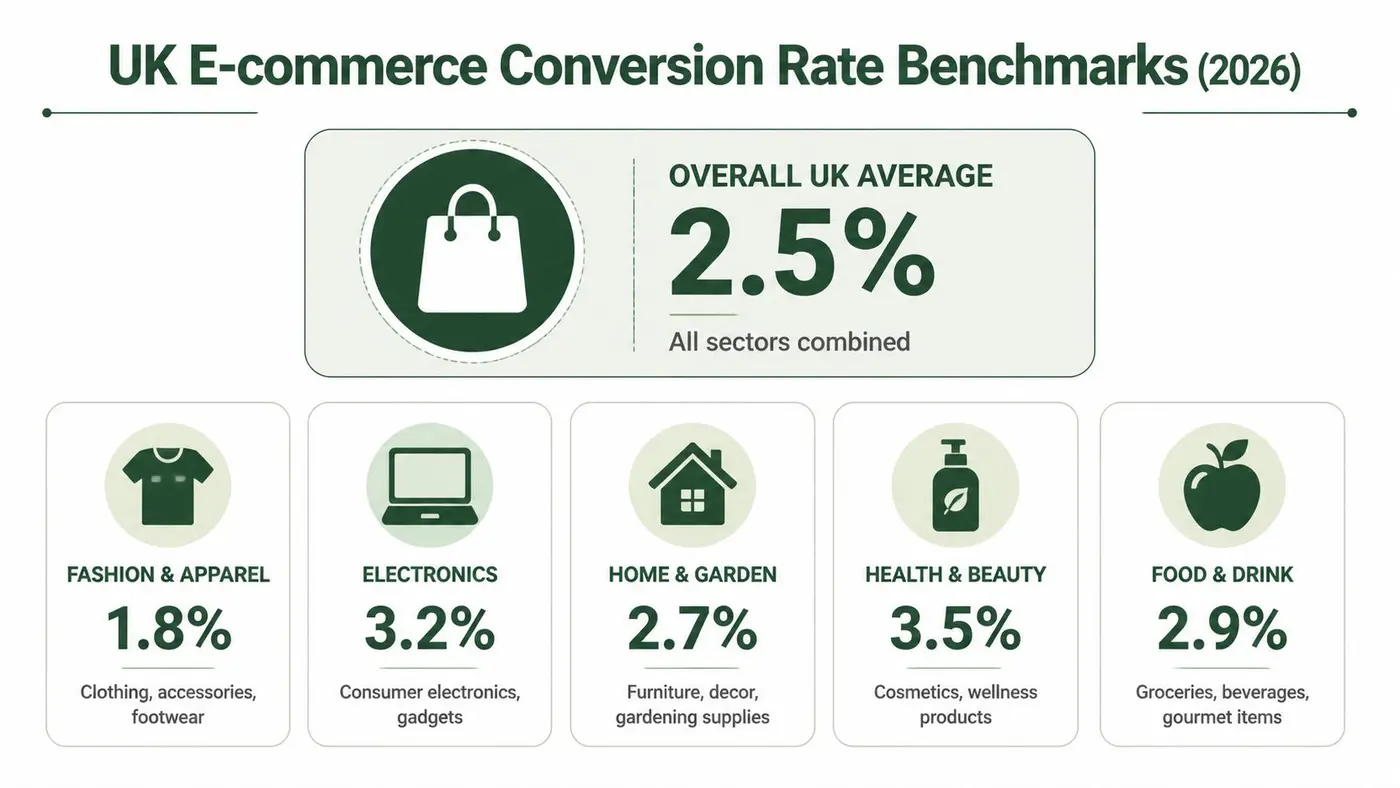
What matters is whether your rate is healthy for your product, traffic mix, device split, and customer type. Data from Smart Insights' ecommerce conversion rate benchmarks gives a useful reference point for 2025. It shows overall UK retail ecommerce conversion rates commonly landing in the 2.5% to 3.5% range, with higher-performing Shopify stores often reaching 3% to 4% or more.
Use that as orientation, not a KPI.
The UK range most teams should know
Smart Insights’ benchmark data also shows why broad averages mislead teams. In the same dataset, fashion averages 3.1%, while electronics sits at 1.9%. Device performance also splits sharply, with mobile at 2.0% to 2.5% and desktop at 3.5% to 4.5%.
Those gaps are normal. They reflect buying behaviour, price sensitivity, research time, and how hard the purchase is to complete on a smaller screen.
A fashion brand with strong repeat purchase behaviour and polished mobile PDPs should not compare itself to a higher-consideration electronics retailer. A store with consistent high-quality product images may also outperform category peers on product page engagement before any checkout changes show up in the blended conversion rate.
Benchmarks by industry and device
Read benchmark data in slices that match how your business acquires and converts customers.
| Industry / Channel | Average Conversion Rate Range |
|---|---|
| Overall UK retail | 2.5% to 3.5% |
| Top-performing Shopify stores in the UK | 3% to 4% or higher |
| Fashion ecommerce | 3.1% |
| Electronics ecommerce | 1.9% |
| Mobile traffic | 2.0% to 2.5% |
| Desktop traffic | 3.5% to 4.5% |
That table is useful because it sets guardrails. It becomes dangerous when teams treat it as a universal target.
I’ve seen stores improve their headline conversion rate just by shifting budget into warmer channels or pulling back on prospecting. The percentage went up. Revenue quality did not always improve at the same pace.
Use benchmarks to find the right problem
Benchmarks work best in three specific ways:
- Health check: If your store sits well below the relevant category or device range, there is probably friction worth investigating.
- Segmentation prompt: Compare performance by device, traffic source, landing page type, and new versus returning users before judging the whole account.
- Prioritisation tool: Put effort where conversion weakness overlaps with meaningful traffic and margin.
That is the practical use case.
A blended conversion rate can rise because you discounted harder, reduced paid social spend, or sent more email to loyal buyers. None of those changes automatically mean the site experience improved. If your team needs a plain-English definition to align less technical stakeholders, this guide on what are conversion rates is a helpful reference.
The better question is not whether your store has reached some generic UK benchmark. The better question is which segment of your funnel is underperforming, and whether fixing it will produce more profitable revenue.
Key Factors That Influence Your Conversion Rate
Two stores can have the same overall conversion rate and completely different problems.
One may have strong product pages but weak mobile checkout. Another may convert returning customers well and fail badly with first-time visitors. If you only look at the blended number, both look identical. In practice, they need different fixes.
Customer familiarity changes everything
The largest split I look for first is new versus returning visitors. According to Convertibles' ecommerce conversion rate analysis, returning customers convert at 4.5% to 6.0%, while first-time visitors convert at 1.0% to 2.0%.
That gap shouldn’t surprise anyone who’s worked in CRO. Returning customers already know your delivery standards, your product quality, and whether your sizing or support can be trusted. First-time visitors still need reassurance on all of it.
If your repeat audience is carrying the account, a decent overall conversion rate can hide a serious acquisition problem.
Traffic source shapes intent
Traffic source is the next filter. The same Convertibles benchmark shows email marketing converts at 4.0% to 5.3%, while paid social converts at 0.7% to 1.2%.
Those numbers explain why broad channel comparisons are usually misleading. Email reaches opted-in users who already recognise the brand. Paid social often captures interrupted attention. The landing page job is different. The offer framing is different. The amount of proof and reassurance required is different.
Here’s the practical consequence. If you redesign a product page and see conversion rate rise, check whether the page changed behaviour or whether your traffic mix shifted towards email and away from paid social during the same period.
Device friction is rarely distributed evenly
Desktop and mobile don’t fail in the same places.
On desktop, shoppers tolerate more comparison, more tabs, and longer scanning. On mobile, thumb reach, field length, sticky bars, image load, and payment method visibility matter much more. Teams often assume they have a “site conversion issue” when they really have a mobile interaction problem.
That’s why one store-wide metric is so limiting. You need to know where conversion falls, for whom, and under what conditions.
Merchandising quality affects trust before copy does
A lot of teams jump straight into headline testing. Sometimes that’s right. Often it isn’t.
If the shopper can’t quickly understand the product, no CTA rewrite is going to rescue the page. In practical terms, product imagery often does more heavy lifting than teams admit. Clear angles, scale cues, texture detail, and consistent presentation reduce uncertainty fast. If your catalogue needs work in that area, this guide to consistent high-quality product images is a helpful reference.
When users hesitate on a product page, the problem often isn't persuasion. It's unresolved doubt.
What usually matters most in real audits
I tend to evaluate conversion influences in this order:
- Traffic intent: Are the people arriving likely to buy, or just likely to click?
- Offer clarity: Does the page explain what the product is, who it’s for, and why it’s worth the price?
- Trust load: Are returns, shipping, quality signals, and policies visible without effort?
- Device experience: Is mobile carrying too much friction?
- Customer stage: Are you treating new and returning visitors as if they need the same message?
Each one changes what a “good” rate should look like. That’s why asking for a single target before segmenting your data usually leads to weak analysis.
How to Diagnose Your Conversion Funnel Issues
When a doctor sees a patient with fatigue, they don’t prescribe treatment after hearing one symptom. They check where the breakdown starts and what else is happening around it. Funnel diagnosis works the same way.
You’re not trying to prove that conversion is “low”. You’re trying to find where buyers lose momentum and why.
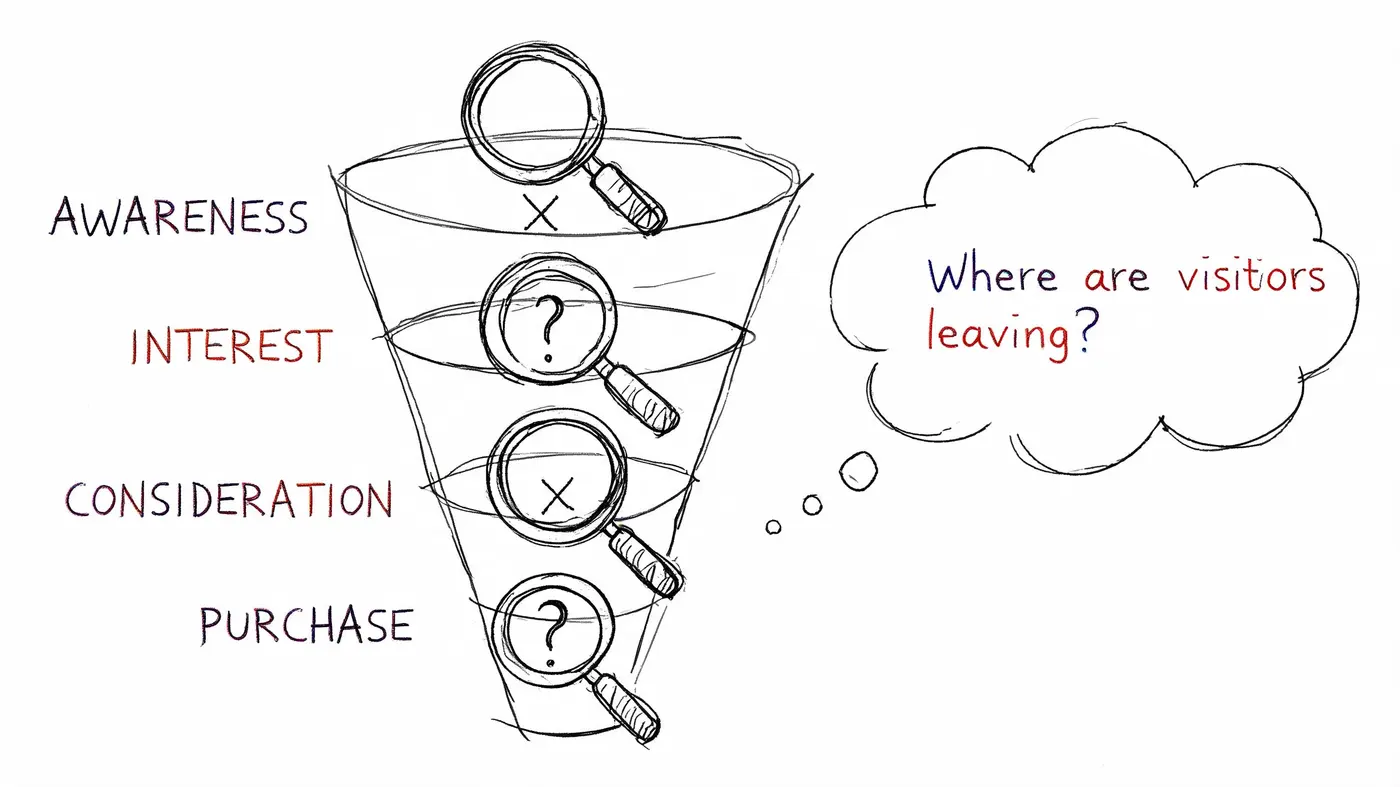
Start with funnel drop-off, not page opinions
Begin in your analytics stack. Look at the path from landing page to product page, product page to cart, cart to checkout, and checkout to purchase. The objective is simple. Identify the stage where the drop-off is disproportionate.
A useful diagnostic sequence looks like this:
- Check landing pages by source. If paid traffic bounces hard while email doesn’t, the issue may be audience match or message continuity.
- Review product-page progression. If shoppers view products but rarely add to cart, inspect offer clarity, imagery, shipping visibility, and trust signals.
- Inspect cart abandonment patterns. If carts are healthy but checkout starts are weak, hidden costs or confusing next steps may be the problem.
- Audit checkout completion. If checkout begins but doesn’t finish, forms, payment options, field errors, or mobile usability usually deserve scrutiny.
This is less glamorous than redesigning a page, but it’s what keeps teams from solving the wrong problem.
Speed is a diagnostic issue, not just a technical one
Page speed often gets discussed as an engineering concern. It’s a conversion concern first.
According to Blend Commerce's ecommerce speed and conversion benchmark analysis, pages loading in about 2.4 seconds convert at 1.9%, while pages loading at 5.7 seconds or more drop to 0.6%, a 68% decline. The same source cites Walmart’s empirical finding that each 1-second improvement in load time delivered a +2% conversion lift.
That doesn’t mean every store should launch a speed project before doing anything else. It does mean you shouldn’t diagnose funnel issues without checking performance at the page and device level. If the product page is slow on mobile data, any copy or design test running on top of it is being judged in degraded conditions.
Slow pages don't just annoy users. They distort your understanding of what the funnel is capable of.
Use qualitative evidence after analytics points to the problem
Once the drop-off point is clear, switch to session recordings, heatmaps, and on-page behaviour review.
Ask sharper questions than “Do people like this page?”
- Where do users stop scrolling?
- What do they tap that isn’t clickable?
- Do they revisit shipping or returns before leaving?
- Do coupon fields trigger hesitation?
- Do mobile users fight the gallery, size selector, or sticky CTA?
Those observations turn a vague hunch into a testable diagnosis.
A short walkthrough like the one below can help teams align on what to look for during funnel reviews.
Separate symptoms from causes
A low checkout completion rate is a symptom. The cause might be shipping surprises, poor autofill support, forced account creation, payment friction, or mobile keyboard errors.
A low add-to-cart rate is also a symptom. The cause might be weak product communication, lack of trust, or low-intent traffic.
That distinction matters because teams often test solutions before confirming the problem. Diagnosis should narrow the field. If it doesn’t, you’ll waste weeks testing variants that were never likely to move the metric.
The A/B Testing Workflow for Driving Improvements
Good CRO work is closer to lab discipline than creative debate.
The reason A/B testing matters isn’t that it makes optimisation look impressive. It matters because most strong-sounding ideas are only partly right. A cleaner layout may improve clarity but weaken urgency. A stronger CTA may lift clicks but reduce average order value if it pulls in lower-intent buyers. Testing keeps the team honest.
Start with a narrow hypothesis
Don’t begin with “let’s improve the product page”. That’s not a hypothesis. It’s a vague ambition.
A useful hypothesis ties together the observed problem, the proposed change, and the expected outcome. For example: changing the shipping message placement on the product page may increase add-to-cart rate because first-time visitors currently need to scroll to find delivery information.
That kind of statement gives the team something falsifiable. If the result doesn’t move, you learn something. If you test a bundle module, a CTA label, a sticky cart button, and social proof placement all at once, you learn very little.
Prioritise tests by business impact
Not every experiment deserves equal attention. I usually sort candidates into three groups:
- High-impact friction: payment confusion, shipping surprise, broken mobile interaction, weak product information
- Persuasion improvements: trust signal placement, reviews visibility, guarantee language, image order
- Cosmetic ideas: stylistic tweaks with no clear behavioural rationale
Many teams stumble here. They spend too much time on cosmetic ideas because they’re easy to launch and easy to argue about.
If you need a practical framework for prioritising experimentation ideas, this piece on deciding what to A/B test is a good resource for structuring the backlog.
Keep the test clean
A clean test changes one meaningful thing at a time. That doesn’t mean one pixel. It means one core variable.
Examples of clean tests include:
- Headline framing: value-led versus urgency-led
- CTA language: action-focused versus reassurance-focused
- Product page layout: reviews above the fold versus below the fold
- Offer presentation: bundle visibility present versus absent
For teams building a repeatable experimentation practice, Figr’s guide to A/B testing best practices is a helpful operational reference.
The point of a test isn't to prove your instinct was right. It's to reduce uncertainty before you scale a decision.
Measure more than conversion rate
Weak testing programmes often break here.
A variant can improve conversion rate while lowering order quality, increasing returns risk, or attracting bargain-driven purchases that hurt the economics of the channel. That’s why serious teams monitor supporting outcomes alongside the main conversion metric. Revenue per visitor, average order value direction, and segment-specific effects often tell a more complete story than conversion rate alone.
You don’t need a bloated dashboard. You do need enough instrumentation to avoid celebrating a win that doesn’t help the business.
Analyse segment behaviour before declaring a winner
Even when a variant wins overall, check whether the lift is concentrated in one audience. New visitors may respond well while returning customers ignore the change. Mobile may benefit while desktop remains flat. Paid social visitors may need stronger reassurance than branded traffic.
That’s not a reason to avoid rollout. It’s a reason to understand what happened so your next experiment starts from evidence, not folklore.
The best testing teams build knowledge, not just winners. A result that tells you “trust placement matters more for first-time mobile visitors than for email traffic” is far more useful than a generic “Variant B won”.
Measure Real Wins with a Smarter Testing Tool
A weak testing setup creates fake certainty.
Teams launch an experiment, see a lift or a drop, and start debating the creative. But if the variant loads late, flickers on page render, or slows the product page, the result is contaminated before analysis even starts. That is not a learning problem. It is an execution problem.
I see this pattern often on ecommerce teams with decent test ideas and unreliable delivery. Marketing wants to test a new product-page hero. Design produces two strong directions. Development squeezes the experiment into an already full sprint. The test goes live with rendering issues, inconsistent tracking, and no clean way to tie the outcome back to revenue. At that point, the team is not measuring customer response. They are measuring a mix of customer response and implementation noise.
A testing tool should reduce that noise.
At minimum, it needs to do three jobs well:
- Run experiments without visible flicker or page-speed drag
- Track outcomes that matter to the business, not just a headline conversion number
- Break results down by meaningful segments such as device, channel, landing page type, or customer cohort
Anything less makes it harder to tell whether a change improved the store or just moved a top-line metric.
That matters because a single store-wide conversion rate is already a blunt instrument. Add weak experimentation on top of that, and teams end up making rollout decisions from blended averages that hide where the gain came from. A variant might help first-time mobile visitors from paid search while doing nothing for returning email traffic. If the tool cannot show that clearly, the team learns very little.
The standard for a real win is higher than “Variant B converted better.”
For a growth team, the result should answer four questions:
- Did the change improve the primary action we wanted?
- Did revenue per visitor, average order value, or another commercial metric hold up or improve?
- Did the effect appear in the audience that matters most?
- Did we learn something specific enough to shape the next test?
That is the shift most stores need. Stop chasing a universal “good” conversion rate. Build a testing system that helps the team find specific friction, measure the commercial effect of changes, and repeat that process without corrupting the data.
Strong CRO programmes rarely depend on one dramatic win. They stack small, verified gains, keep the ones that improve economics, and keep segmenting until the average stops hiding the complete story.
Frequently Asked Questions
How do I know if my conversion rate is actually bad?
Don’t judge it from the store-wide average alone. Compare it against the most relevant benchmark for your business model, then break it down by channel, device, and customer type. If one segment is healthy and another is weak, you don’t have one conversion problem. You have a specific funnel problem hidden inside an average.
Should I optimise for conversion rate or revenue?
Revenue is the better business metric. Conversion rate is useful because it reacts quickly and helps diagnose friction, but it can rise for the wrong reasons. Heavy discounting, low-intent offer hooks, or narrower traffic targeting can all make conversion look better while weakening margin or growth quality.
A higher conversion rate isn't automatically a better business outcome.
What should I test first on an ecommerce site?
Start where the funnel shows the biggest commercial leak. That often means product pages for low add-to-cart rates or checkout for poor completion. If your analytics are unclear, begin with the pages that combine high traffic with obvious friction, such as unclear shipping information, weak mobile usability, or missing trust elements.
How long should an A/B test run?
Run it until you have enough data to trust the result, not until the dashboard tells a pleasing story. Avoid stopping early because one variant looks ahead for a day or two. Let the test capture normal weekday and weekend behaviour, and make sure traffic quality hasn’t shifted during the run.
Can a high conversion rate be misleading?
Yes. A high rate can hide over-reliance on returning customers, branded traffic, aggressive promotions, or a narrow audience that limits scale. It can also conceal weak average order quality. If the number rises while profitability or acquisition efficiency worsens, the celebration is premature.
Why does mobile often underperform desktop?
Mobile users deal with smaller screens, more interruptions, and less tolerance for friction. They’re also more likely to browse casually and return later on another device. That means mobile conversion issues often come from usability details, not just weaker intent.
Is it worth testing small changes like button text?
Sometimes, but only after the bigger blockers are under control. Minor UI changes can help when the page is already solid and traffic volume is high enough to detect meaningful differences. If your offer is unclear or checkout is clumsy, button text won’t save the funnel.
What’s the biggest mistake teams make with conversion rate optimisation?
They jump to solutions before diagnosing the problem. The second biggest mistake is treating all visitors as one audience. Most wasted tests come from one of those two errors.
If you want a faster way to run clean experiments and measure outcomes that matter, try Otter A/B. It lets teams test headlines, CTAs, and layouts without flicker, track purchases and revenue per variant, and get clear significance reporting so you can make decisions from evidence instead of opinion.
Stop guessing
Ready to start testing?
Set up your first A/B test in under five minutes. No credit card required.
- 14-day free trial
- No credit card required
- Cancel anytime