What is a Good Website Bounce Rate? A 2026 UK Guide
What is a good website bounce rate? Discover 2026 UK benchmarks, learn why a low rate isn't always good, and get tactics to reduce bounces and boost revenue.

Most bounce rate advice is too blunt to be useful. Teams see a high number, assume something is broken, and start redesigning pages that may be doing their job perfectly well.
That’s how good content gets “optimised” into underperforming content. A visitor can land on a blog post, read the answer they needed, and leave. Analytics records a bounce. The user records a success.
A better question than “is my bounce rate low enough?” is what is a good website bounce rate for this page, this audience, and this traffic source? If you don’t answer that first, site-wide averages will push you towards the wrong fixes.
Why Your Obsession with a Low Bounce Rate is Wrong
A bounce rate only tells you that a session included one page and no further tracked engagement. It doesn’t tell you whether the visit was useless, frustrating, efficient, or commercially valuable.
That’s why teams get misled by the metric. They treat every bounce as a failure, even though some pages are supposed to satisfy intent quickly. A contact page, a pricing explainer, or a glossary entry can all have a bounce that reflects task completion rather than rejection.
If you need a clean definition first, Otter A/B’s explanation of bounce rate on a website covers the mechanics well. The commercial mistake happens after the definition, when teams stop thinking.
High bounce can mean success
A blog reader who finds the answer and leaves is different from a shopper who lands on a product page, hesitates, and exits. Both sessions may count as bounces. Only one is a problem.
The primary variable is intent. Informational visitors often want one answer. Commercial visitors usually need reassurance, comparison, and a next step. Expecting both groups to behave the same way is where bad diagnosis starts.
Practical rule: Don’t ask whether bounce rate is high. Ask whether the user should have taken a next step on that page.
Low bounce can also hide problems
Teams often celebrate a low bounce rate without checking what caused it. Sometimes visitors click because they’re engaged. Sometimes they click because the page is unclear and they’re hunting for basic information.
That distinction matters. If someone has to move from homepage to pricing to FAQ to contact because the first page failed to explain the offer, a lower bounce rate doesn’t mean a better experience. It may just mean your users are working harder than they should.
Treat bounce rate as a diagnostic signal, not a scoreboard. Used properly, it helps you spot mismatched intent, weak messaging, slow pages, and poor traffic quality. Used badly, it sends your team chasing the wrong target.
Website Bounce Rate Benchmarks for 2026
A single site-wide bounce rate is one of the fastest ways to misread performance.
The number only becomes useful after you split it by traffic source and page intent. A 62% bounce rate from organic blog traffic can be healthy. A 62% bounce rate from paid search landing pages built to generate leads usually means you are paying for clicks that never got past first contact.
For broad context, Plausible’s bounce rate benchmark summary cites a 44.04% cross-industry median from Semrush’s September 2024 data, suggests under 50% as a reasonable site-wide reference point, and notes lower ranges for e-commerce and service businesses. Use that as orientation only. It is not a target to force across every channel.
2026 UK Website Bounce Rate Benchmarks by Page Type
| Page Type | Excellent | Good | Average | Needs Improvement |
|---|---|---|---|---|
| E-commerce site-wide | Under 30% | 20% to 45% | Around cross-industry median | Above 50% |
| Service business site-wide | 15% to 30% | 15% to 50% | Around cross-industry median | 60%+ on slower sites |
| B2B website | 25% to 40% | 30% to 55% | 50% to 70% in service sectors | Above the normal range for the site type |
| Lead generation site | 30% to 40% | 30% to 55% | Mid to upper end of that range | Above the normal range for the page type |
| Blog or content-led pages | Not the main benchmark to chase | Often naturally high | 70% to 90% can be normal | Only a concern when intent is mismatched |
The B2B, lead generation, service-sector, and blog ranges above come from CausalFunnel’s UK benchmark summary, which also warns that bounce rates under 20% can point to tracking problems rather than exceptional performance.
The practical mistake is comparing these rows as if they carry the same commercial meaning. They do not. An e-commerce category page should create movement into product views, basket, or search refinement. A content page from organic search may do its job in a single visit. A lead generation page from Google Ads has far less room for waste, because every bounce has a direct acquisition cost attached to it.
Traffic source changes the benchmark again.
Paid search usually deserves the strictest standard because message match is under your control. If branded PPC traffic bounces at the same rate as cold display traffic, the issue is rarely “user behaviour.” It is usually weak ad-to-page alignment, a poor first screen, or an offer that does not justify the click. Email traffic should also bounce lower than colder channels if the audience and promise are tightly matched. Social and top-of-funnel content traffic often sit higher, especially on mobile, because intent is lighter and session depth is naturally lower.
That is why I do not use one benchmark table as the final answer. I use it to ask better questions.
If organic blog traffic bounces at 78% but still drives assisted conversions, newsletter signups, or strong engaged time, that can be acceptable. If paid non-brand traffic bounces at 78%, I would first audit search terms, ad copy, landing page message match, mobile speed, and form friction before touching anything else. Same metric. Different commercial priority.
A good bounce rate is the rate that fits the page’s job and the channel sending the visit.
Use benchmarks in layers. Start with page type. Then segment by source, device, and campaign intent. Only after that should you decide whether the number signals a problem worth testing.
Understanding the Causes of High and Low Bounce Rates
High bounce rate is not a diagnosis. It is a symptom. The job is to identify which part of the journey failed, and traffic source is often the fastest way to get there.
A 70% bounce rate from TikTok traffic can mean one thing. A 70% bounce rate from branded search can mean something completely different. One audience clicked with light intent and low commitment. The other arrived expecting a close match between their query and your page. If you treat both numbers the same, you will test the wrong fix.
When a high bounce rate is bad
High bounce rate is a problem on pages that are supposed to move visitors deeper into a commercial journey. That includes lead gen landing pages, service pages, product category pages, and pricing pages.
In those cases, the cause is usually visible near the top of the experience. The ad or search snippet sets one expectation. The landing page delivers another. Or the page takes too long to load, especially on mobile. Or the first screen does not answer the basic commercial questions quickly enough: What is this, who is it for, why should I trust it, and what should I do next?
For UK B2B SaaS, Virtual Stacks’ bounce rate summary reports average bounce rates of 45% to 56%, with below 40% described as excellent. It also notes that high bounce often ties back to technical issues, weak mobile responsiveness, and short dwell time. That lines up with what I see in audits. Teams often rewrite headlines before fixing page speed, layout hierarchy, or mobile form friction, even though those issues stop the visit before the message has a chance to work.
Traffic source sharpens the diagnosis. If paid search traffic bounces hard while organic traffic on the same page holds up, start with message match, keyword intent, and offer clarity. If display or paid social traffic bounces at a higher rate, the page may be fine and the targeting may be broad. Different channels create different failure points, so the test plan should change with the source.
When a high bounce rate is fine
Some pages are meant to complete the job in one visit. A visitor checks your shipping policy, reads a definition, finds a phone number, or gets a quick answer from a blog post. That can still be a successful session.
The mistake is assuming every single-page session reflects dissatisfaction. On content and support pages, bounce rate needs context from the page’s purpose and the channel sending the traffic. Organic visitors who searched for one specific answer often leave once they get it. Referral visitors from a review site may do the same after validating a point.
Use a few checks before calling it a problem:
- Time on page: Longer engaged visits with high bounce often indicate the page answered the question.
- Conversion assists: A page can bounce high and still support later signups, demos, or purchases.
- Source intent: Colder traffic will abandon faster, even when the page is doing its job.
- Page type: Articles, glossary pages, contact pages, and help content often attract single-page sessions by design.
That distinction matters for ecommerce too. A campaign can send top-of-funnel traffic to a buying guide, show a high bounce rate, and still lift downstream product discovery. Teams that track only page-level bounce miss that broader contribution. That is why bounce rate should sit alongside e-commerce key performance indicators, not replace them.
When a low bounce rate is good
Low bounce rate is encouraging when it reflects clarity and momentum. Visitors understand the offer, find the information they need without effort, and take the next step.
That usually happens when the source, promise, and page are tightly aligned. Branded search traffic lands on a relevant service page. Email traffic arrives on a campaign page that repeats the same offer and CTA. Returning users hit a product page that loads fast, shows proof early, and removes friction from the path forward.
In those cases, low bounce is not just a nice number. It is evidence that the page is matching intent well enough to keep qualified traffic moving.
When a low bounce rate is misleading
Low bounce can also hide confusion. Visitors click deeper because the first page failed to answer basic questions, so they hunt for pricing, proof, delivery details, or product specifics across multiple pages.
That pattern shows up often on sites with weak information hierarchy. The bounce rate looks healthy, but exit rate rises later in the session and conversion rate stays flat. The site is generating extra clicks, not stronger buying intent.
The practical fix is to compare bounce rate with downstream behaviour. Look at scroll depth, time on page, exit rate, assisted conversions, and form completion by traffic source. If one channel shows low bounce but poor conversion, test stronger first-screen clarity, clearer CTAs, tighter proof placement, or better page structure before celebrating the number.
How to Accurately Measure and Segment Your Bounce Rate
A single site-wide average is close to useless for optimisation. It blends together branded traffic, cold social clicks, blog readers, product page visitors, and returning customers into one number that tells you almost nothing about what to fix.
The strongest bounce-rate insight usually appears after segmentation by traffic source, device, landing page, and visitor type.
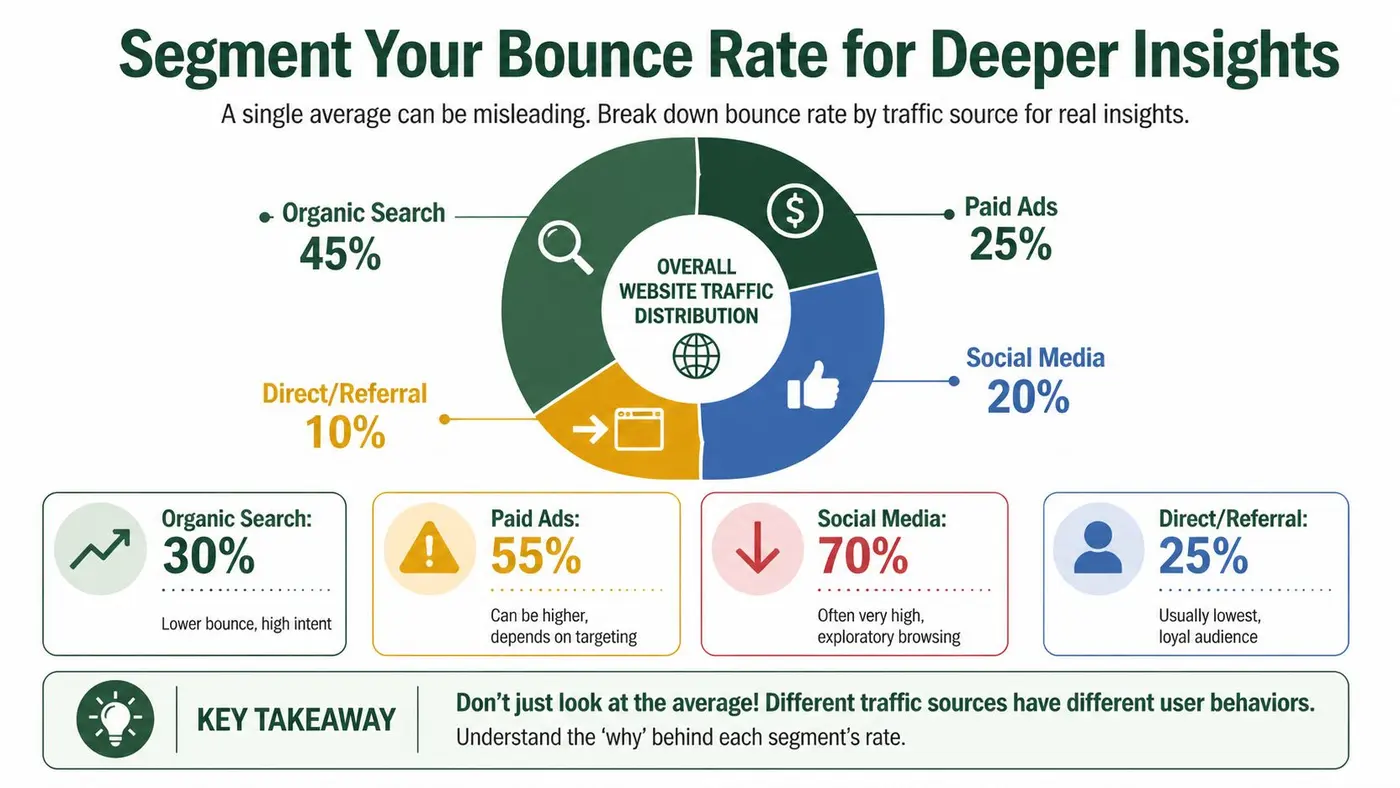
Start with traffic source
This is the most overlooked cut of the data, and usually the most revealing. According to CXL’s bounce rate benchmarks, organic search sits at 43.60%, paid search at 44.10%, and referral traffic at 37.50%, while social media reaches 54% and direct traffic 66.5%.
The same benchmark summary points out that social visitors bounce 24% more frequently than organic visitors because social traffic tends to have lower intent. That’s the key diagnostic move. Don’t compare your social landing page against your organic blog traffic and conclude the page is broken. The visitors are arriving in different states of mind.
Then cut by landing page and device
After traffic source, look at the specific entry pages inside each channel. A homepage may perform acceptably for branded organic traffic but poorly for paid social. A category page may be strong on desktop and weak on mobile because filters are awkward on smaller screens.
Use this sequence in GA4 or your analytics tool:
- Open landing page reporting and add bounce rate as a visible metric.
- Apply a traffic-source comparison such as organic, paid, social, referral, and direct.
- Add device category to see whether mobile is distorting the picture.
- Separate new and returning users so you don’t mix discovery behaviour with brand familiarity.
- Review conversion context before acting, because a bounce problem that doesn’t affect commercial outcomes is usually not the first priority.
Build decisions around intent, not averages
If one channel drives a high bounce rate, ask what that channel promised and what the page delivered. Organic traffic often arrives with clearer intent. Social traffic often needs faster orientation, stronger relevance cues, and less friction above the fold.
That’s why bounce rate should sit next to your broader measurement stack. If you need a practical refresher on how bounce relates to commercial health, this guide to e-commerce key performance indicators is worth reviewing because it keeps the focus on the metrics that matter after the click.
Working rule: Segment first, diagnose second, redesign last.
Teams that skip that order usually “optimise” the wrong page for the wrong audience.
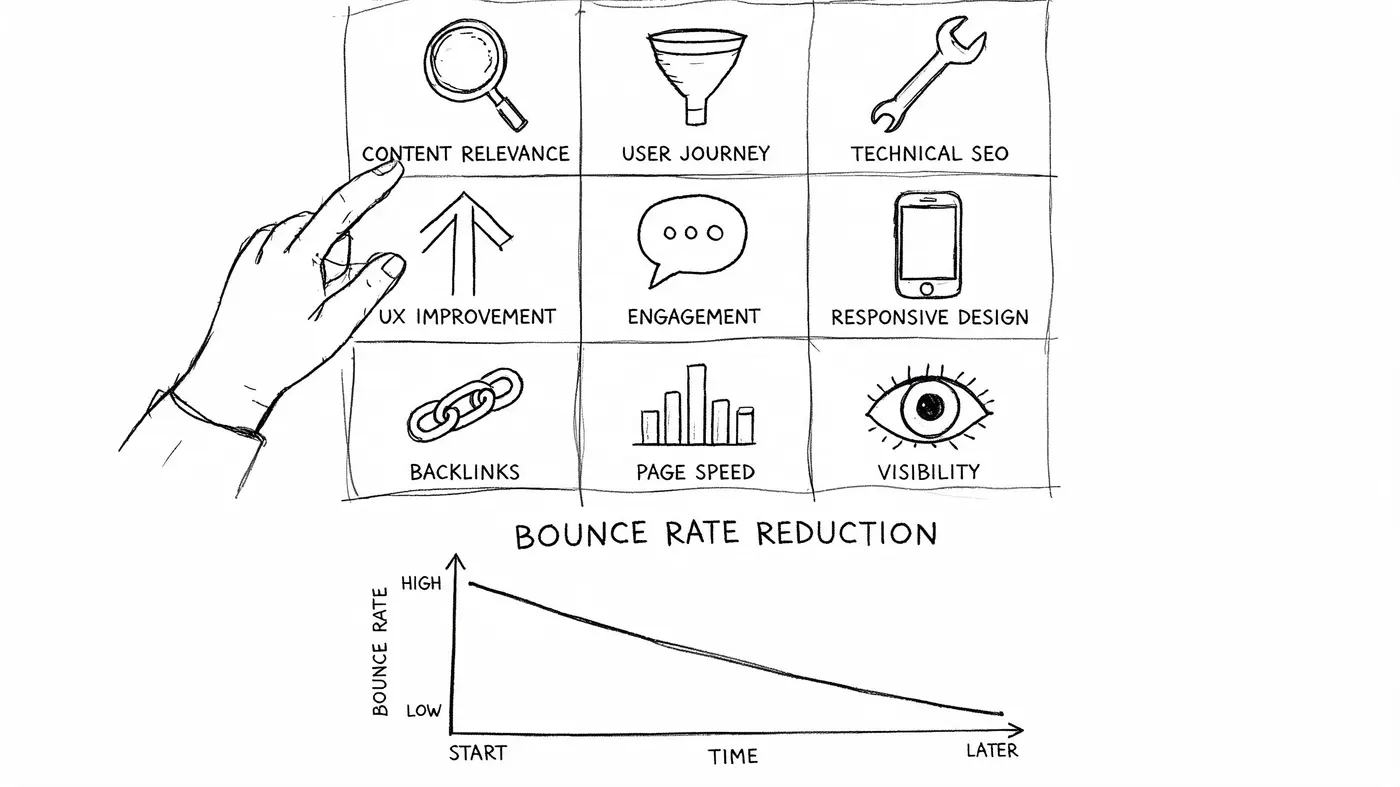
9 Actionable Tactics to Intelligently Reduce Your Bounce Rate
A lower site-wide bounce rate can hide bad decisions.
I’ve seen teams celebrate a small overall improvement while paid social still bounced badly, organic kept doing the heavy lifting, and high-intent landing pages underperformed. The job is not to push one average down. The job is to stop the wrong visitors leaving the wrong pages for avoidable reasons.
For UK e-commerce, Semrush’s bounce rate overview places good performance around 40% to 50%, with stronger sites under 35%, and notes that slower pages often see materially higher bounce rates. Use that as context, not a target. A branded organic landing page, a paid social offer page, and a blog article should not be judged the same way.
If you want another practical reference after this section, Otter A/B’s guide on how to reduce website bounce rate adds useful examples.
1. Tighten message match by channel
Start with the promise that earned the click. If a Google Ads visitor searched for pricing, lead with pricing context. If a paid social visitor clicked a problem-aware ad, open with the pain point and the next step.
Bounce is often a relevance problem before it is a design problem. Organic traffic usually arrives with clearer intent. Social, display, and upper-funnel paid traffic need faster orientation and stronger proof that they are in the right place.
2. Build channel-specific landing pages
One page rarely serves every source well. Email traffic already knows your brand. Referral traffic may need trust signals. Paid social often needs shorter copy, clearer hierarchy, and a more obvious first action.
If multiple channels land on the same URL, create variants and test them against source or campaign group. That is usually faster than trying to make one page acceptable for everyone.
3. Rewrite the first screen for clarity, not brand theatre
Visitors decide quickly whether to continue. The opening screen should answer three questions fast: where am I, what is this offer, and what should I do next?
Brand slogans, vague headlines, and oversized visuals often hurt this first decision. Clear value confirmation beats clever copy on entry pages.
4. Make the next action easy to spot
A bounce often means the page did not create a clear path forward. Product pages need a visible route to product detail, cart, or category refinement. Service pages need an obvious enquiry step. Content pages need a relevant internal path that matches the visitor’s original intent.
Weak hierarchy becomes apparent if the CTA blends into the page, competes with secondary links, or appears too late, leading to a drop in engagement.
5. Cut above-the-fold friction that blocks progression
Pop-ups, sticky bars, crowded navigation, and oversized trust sections can all delay comprehension. The first screen should confirm relevance and reduce uncertainty, not force visitors to work out where to look.
I usually review this by source. A returning email visitor may tolerate more detail. A cold paid visitor often needs a cleaner entry experience.
6. Fix mobile interactions before testing cosmetic changes
On many accounts, “high bounce” really means “hard to use on a phone.” Filters are awkward. Buttons are cramped. Forms are too long. Comparison tables break. Cookie banners and promos eat the screen.
If mobile traffic is a large share of a channel, test mobile-first improvements on the highest-volume landing pages before running headline experiments. You will learn more, faster.
Here’s a practical walkthrough that complements the tactical side of this work:
7. Prioritise speed on entry pages with commercial intent
Slow pages waste paid traffic and depress qualified engagement. Focus first on landing pages that carry revenue intent, such as product, service, pricing, and campaign pages.
Do not spread effort evenly across the site. If paid search lands on three templates that account for most spend, fix those first. That is where bounce reduction can translate into better commercial outcomes.
8. Remove technical interruptions that trigger exits
Layout shifts, broken elements, delayed rendering, autoplay media, and intrusive overlays create exits that have nothing to do with offer quality. These issues are especially damaging on cold traffic because visitors have less motivation to push through friction.
Technical cleanup usually beats visual redesign in the first round of optimisation. It is less exciting. It is often more profitable.
9. Test one hypothesis at a time and judge it by downstream behaviour
Teams lose time arguing about whether the headline, CTA, form, or layout is “the issue.” Run controlled tests instead. Keep the hypothesis tied to a specific source and page type.
Examples:
- Paid search landing page: Does a headline that mirrors the keyword theme reduce bounces and increase form starts?
- Paid social product page: Does a shorter first screen increase product views and add-to-cart rate?
- Organic blog article: Does a stronger contextual internal CTA move more readers to a product or service page?
Bounce rate should be one readout, not the verdict. The better question is whether the change improved progression, conversion quality, or revenue. Teams working on optimizing B2B revenue conversions already use that standard, because lower bounce only matters when more of the right visitors keep moving.
Connecting Bounce Rate Optimisation to Revenue Growth
A lower bounce rate does not automatically mean a more profitable website.
Teams lose money when they treat bounce rate as the win condition instead of a clue. The job is to find out which visits are abandoning, which traffic sources are still progressing, and where revenue improves. A site-wide average hides too much. Paid social traffic can bounce heavily and still assist pipeline. Branded search traffic can post a tidy bounce rate while underperforming on qualified leads.
Bounce rate earns its place when it helps you make better commercial decisions. I use it to spot mismatches between acquisition intent and landing page experience, then I judge the change by what happened next.
What to track alongside bounce rate
The useful reporting view is segmented by landing page and traffic source, then tied to business outcomes. Without that segmentation, teams end up fixing the wrong page or cutting a channel that was doing its job.
Track bounce rate next to:
- Conversion rate by channel: Did non-bouncing visitors from paid search, organic, referral, or email complete the action you care about?
- Revenue per session or per landing page: Which source-page combination produced more money, not just more pageviews?
- Lead quality or pipeline progression: For B2B teams, did lower bounce rates produce sales-accepted leads, booked meetings, or opportunities?
- Assisted conversions: Some high-bounce channels still introduce buyers who return later through branded search or direct traffic.
- Average order value or deal size: A page can keep more visitors and still attract lower-value customers.
Bounce rate informs operational decision-making. If paid social has a high bounce rate and weak assisted conversion value, tighten audience targeting or rewrite the first screen to match the ad promise. If organic blog traffic bounces at a high rate but drives strong assisted conversions, the smarter move may be stronger internal paths and better CTA placement rather than a full content rewrite.
The trade-off revenue teams need to accept
Some pages should repel the wrong visitor.
That is common on pricing pages, demo pages, and service pages built for narrow-fit buyers. A stricter message can raise bounce rate while improving sales efficiency because weak-fit traffic leaves early and qualified traffic converts at a higher rate. In practice, that often means fewer leads for marketing and more revenue for the business.
The wrong way to evaluate that page is, "Did bounce rate go down?" The right question is, "Did qualified pipeline per 100 visits go up by source?"
That distinction matters even more for teams working on optimizing B2B revenue conversions, because sales outcomes depend on lead quality, not just lead volume.
For teams trying to connect testing more closely to business performance, this guide on how to improve website conversion rates is a useful reference. The standard is simple. Use bounce rate to diagnose friction and intent mismatch. Decide winners by revenue, pipeline, and customer value.
Frequently Asked Questions About Bounce Rate
What’s the difference between bounce rate and exit rate
Bounce rate applies to entry sessions that involve one page and no further engagement. Exit rate looks at the percentage of visits that end on a given page, regardless of where the session started.
A pricing page can have a modest bounce rate and still have a high exit rate. Those metrics answer different questions, so don’t swap them interchangeably.
Is 0% or 100% bounce rate a technical problem
It can be. Extreme numbers often mean you should review tracking before changing the page itself.
A very low number may indicate duplicate tracking or event configuration issues. A very high number can also reflect broken event collection, especially if it appears suddenly across many pages.
How does GA4 handle bounce rate differently
GA4 frames bounce rate around unengaged sessions, not the old universal analytics model many teams still have in mind. In practical terms, the reported number depends on whether a session met engagement criteria, which is why implementation details matter.
That’s another reason cross-site comparisons can be shaky. Two sites may define engagement differently.
Should bounce rate be a primary KPI
Usually, no. It’s best used as a diagnostic metric.
If you run content, lead generation, and e-commerce journeys on the same domain, one universal bounce target will mislead your team. Use bounce rate to identify likely friction. Use conversion and revenue metrics to decide whether the friction is commercially important.
If your team wants to move from generic bounce-rate reporting to experimentation, Otter A/B helps you test headlines, CTAs, and layouts without slowing down the site. You can measure what wins, not just what lowers a top-line engagement metric.
Stop guessing
Ready to start testing?
Set up your first A/B test in under five minutes. No credit card required.
- 14-day free trial
- No credit card required
- Cancel anytime