Alternative Hypothesis Definition: Master the Concept
Grasp the alternative hypothesis definition with clear examples. See how it contrasts with the null, its role in A/B testing, and interpret results.
You've probably been in this meeting before. Variant B is ahead. The dashboard shows a higher conversion rate. Someone says, “Great, ship it.”
Then the uncomfortable question lands. Is B better, or did you just get a noisy result from a short test, mixed traffic, or messy data?
That's where it becomes clear that “alternative hypothesis definition” isn't just exam vocabulary. It's the line between disciplined decision-making and expensive guesswork. If you run A/B tests on headlines, landing pages, email subject lines, or pricing layouts, you need a precise way to say what result would count as evidence and what would count as randomness.
The alternative hypothesis gives you that precision. It tells you what claim your test is trying to support if the evidence is strong enough. Once you understand it properly, p-values, significance thresholds, and test decisions stop feeling abstract. They become practical tools for choosing whether to launch, hold, or investigate further.
Why 'Just Looking at the Numbers' Is Not Enough
A raw lift on a dashboard can fool smart people.
Suppose you test a new headline on a product page. By Friday afternoon, the challenger is slightly ahead. That might mean the new headline is better. It might also mean the sample happened to lean towards higher-intent visitors, a paid campaign changed audience quality, or plain chance gave one version a temporary bump.
Marketing teams often trust visible movement because visible movement feels like evidence. But a small difference in observed results doesn't automatically tell you whether there's a real underlying difference in the wider audience.
Why intuition breaks down in A/B testing
Humans are pattern-seeking. That's useful in creative work and terrible for noisy data.
Three habits cause trouble fast:
- We overreact to early leads. A variant can look strong before enough data accumulate.
- We treat observed difference as real difference. The two are not the same thing.
- We forget the baseline possibility of no effect. Many test ideas sound plausible and still change nothing.
That's why hypothesis testing exists. It gives you a formal way to compare two competing explanations for your results rather than relying on gut feel.
The two competing ideas behind every test
At the centre of a standard A/B test are two statements:
- The first says there is no real difference.
- The second says there is a real difference.
Those statements are the null hypothesis and the alternative hypothesis.
Practical rule: If you don't define what “no effect” and “real effect” mean before looking at results, your interpretation becomes much easier to bend after the fact.
For a marketing team, that matters because every test creates pressure. A designer wants the cleaner layout to win. A copywriter wants the new message to work. A paid media lead wants the landing page update to justify the campaign.
Hypothesis testing gives the team a shared standard. Instead of arguing from preference, you ask a cleaner question: do these results give us enough evidence to move away from the default assumption of no effect?
That default assumption is the starting point. The alternative hypothesis is the challenger.
The Null Versus the Alternative Hypothesis
The clearest alternative hypothesis definition is this: it's the statement your test is designed to support when the data provide enough evidence against the null hypothesis. In UK statistical practice, guidance used in health and social science describes the null hypothesis, written as H0, as no statistical significance or no difference, and the alternative hypothesis, written as Ha, as a statistical significance or difference between variables, as explained in National Library of Medicine guidance on null and alternative hypotheses.
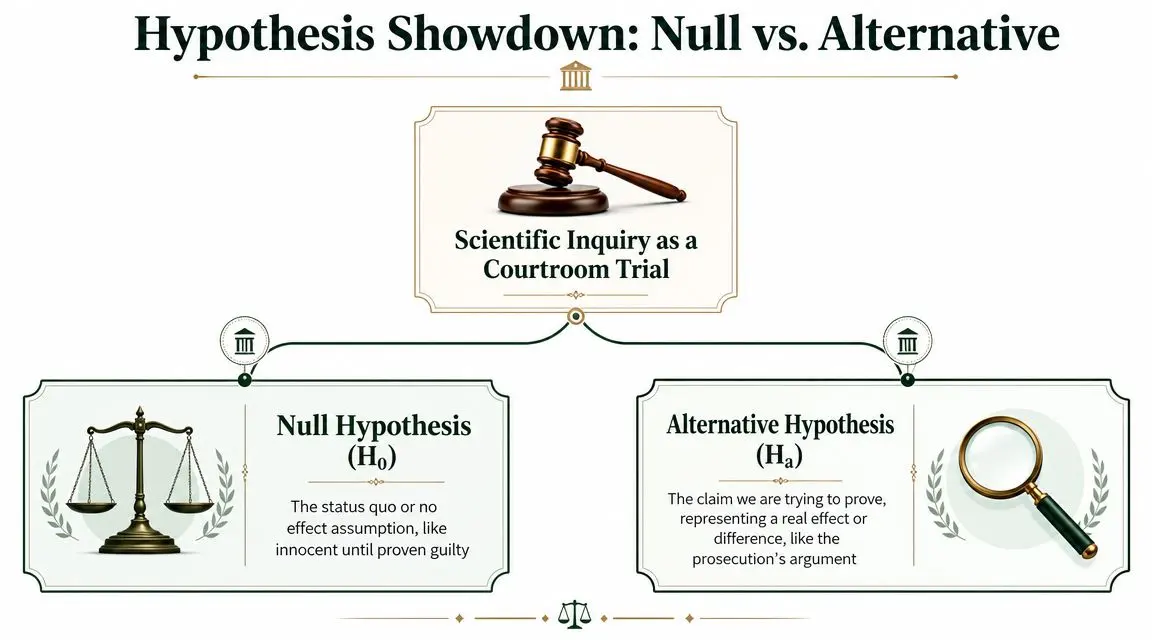
The courtroom analogy that makes this click
Think of a hypothesis test like a courtroom trial.
The null hypothesis is the presumption of innocence. It says the current state stands. In an A/B test, that usually means the new version and the control do not differ in a meaningful statistical sense.
The alternative hypothesis is the competing claim. It says there is a detectable difference, or in some cases a difference in a particular direction.
You don't begin by assuming the challenger is right. You begin by assuming the status quo holds unless the evidence pushes you away from it.
The null says, “nothing has changed.”
The alternative says, “something has changed.”
Your test asks whether the observed data are strong enough to stop treating “nothing has changed” as the best working assumption.
That's why good analysts say reject the null or fail to reject the null. They don't usually say they have “proved” the alternative in an absolute sense.
A plain-language comparison
| Attribute | Null Hypothesis (H₀) | Alternative Hypothesis (Hₐ or H₁) |
|---|---|---|
| Core idea | No difference or no effect | A difference or effect exists |
| Role in testing | Default starting assumption | Competing claim the test is set up to support |
| In an A/B test | Version A and B perform the same | Version A and B perform differently |
| Courtroom analogy | Presumption of innocence | Prosecution's claim |
| Decision language | Reject or fail to reject | Supported only when evidence against H₀ is strong enough |
What this looks like in a business setting
Say your current pricing page is Version A and a redesigned pricing page is Version B.
- H0: The redesign does not change conversion rate.
- Ha: The redesign changes conversion rate.
That's it. Clean, testable, and useful.
The most important thing to notice is that the alternative hypothesis is not a wish. It isn't “the version the team likes more”. It's the explicit claim that a real population-level difference exists, not just a gap in this one observed sample.
If you skip that distinction, you'll start treating every apparent uplift as truth. That's where weak experiments create strong opinions.
Choosing Between One-Tailed and Two-Tailed Tests
Once you understand the alternative hypothesis itself, the next decision is direction. Are you testing for any difference, or are you testing for a difference in one specific direction?
That choice changes the structure of the test.
In UK statistical practice, the alternative hypothesis is treated as the explicit competing claim against the null and is typically written with an inequality such as ≠, <, or >. Guidance aimed at learners also stresses that researchers should pre-specify the alternative before examining the data, otherwise the p-value no longer matches the intended error rate, as outlined in this explanation of null and alternative hypotheses and pre-specification.
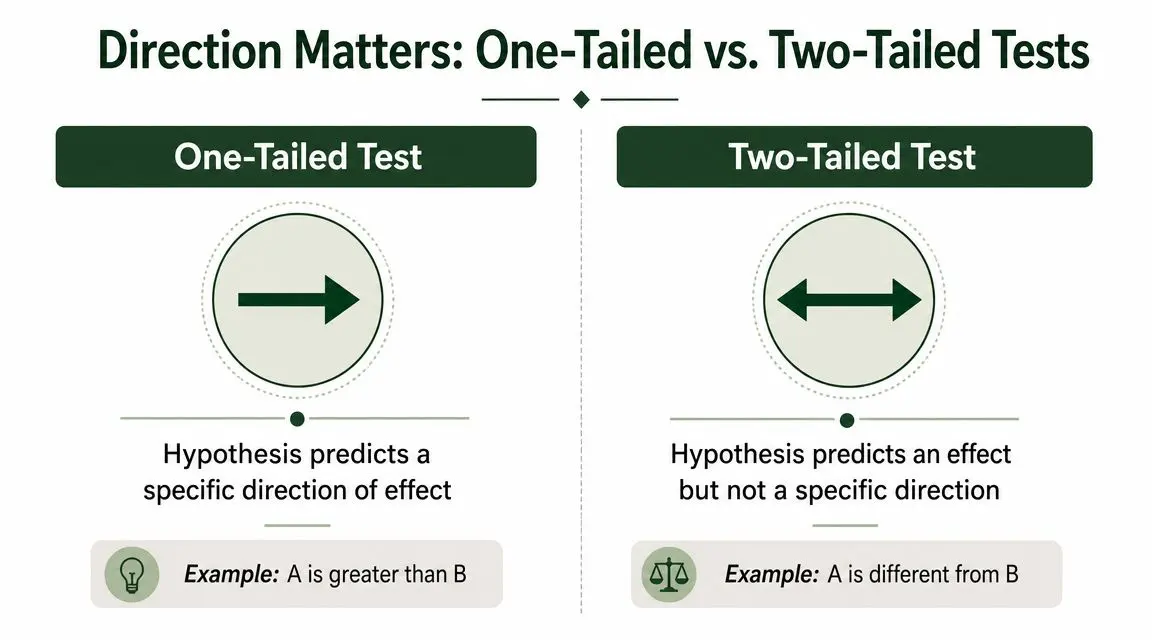
Two-tailed means any meaningful change
A two-tailed test asks whether the new version is different from the old one, without committing to whether that difference will be up or down.
Example:
- H0: The new button colour does not change conversion rate.
- Ha: The new button colour changes conversion rate.
This is often the safer choice when you have a genuine reason to think the variant could help or hurt. That's common in website optimisation, where a cleaner design might improve clarity for one audience and reduce urgency for another.
One-tailed means one specific direction
A one-tailed test asks whether the new version moves the metric in one direction only.
Example:
- H0: The new checkout headline does not increase completion rate.
- Ha: The new checkout headline increases completion rate.
This structure can make sense when only one direction matters to your decision rule. But it comes with responsibility. You must choose it before the test starts, not after seeing the result.
Decision habit: If you'd care whether the change made results worse, a two-tailed framing is usually more honest.
How marketers get this wrong
Teams often back into a one-tailed story after looking at the dashboard.
They run a test with no clear directional commitment, see a positive gap, then talk as if the original hypothesis had always been “B will increase conversions”. That creates a mismatch between the test they ran and the claim they now want to make.
A better workflow is:
- State the business question first. Do you care about any difference, or only an increase?
- Write the hypothesis before launch. Put it in the experiment brief.
- Match the test rule to that choice. Don't retrofit it later.
If you want a practical breakdown of when each option fits, this guide on one-tailed vs two-tailed tests is a useful companion.
How to Formulate Hypotheses for A/B Testing
Teams generally don't struggle with the definition once they see it. They struggle when they have to write one for a real experiment.
The fix is simple. Start with the business decision, then translate it into a measurable claim.

A simple template that works
Use this sequence:
-
Name the change
What exactly are you altering? -
Name the metric
Conversion rate, click-through rate, signup completion, revenue per visitor, or another defined metric. -
Write the null hypothesis
Say there is no difference. -
Write the alternative hypothesis
Say there is a difference, or a direction-specific difference if that was pre-decided.
If you want a prompt-based helper for drafting tests, Otter's hypothesis generator can speed up the wording stage.
Example one with a homepage headline
Business question: Will a clearer headline increase demo bookings?
Possible hypotheses:
- H0: The new homepage headline does not change the demo booking rate.
- Ha: The new homepage headline increases the demo booking rate.
This is directional. It makes sense if the team only cares whether the new message improves bookings and has already agreed on that framing before launch.
But note the wording. The alternative is not “the new headline is better”. “Better” is too vague. “Increases the demo booking rate” is measurable.
Example two with a CTA button
Business question: Does changing the CTA from “Start Free Trial” to “See Plans” alter clicks?
Possible hypotheses:
- H0: The CTA change does not affect click-through rate.
- Ha: The CTA change affects click-through rate.
This one is non-directional. That's often the right move when user intent could shift either way. “See Plans” might attract more qualified clicks or it might reduce urgency.
For teams working on search landing pages, hypothesis quality matters even more because ranking, intent, and conversion all interact. This article on optimizing SEO through A/B testing is useful if you're testing pages where acquisition quality and on-page behaviour need to be considered together.
Example three with pricing display
Business question: Will showing monthly pricing first change purchases?
Possible hypotheses:
- H0: Showing monthly pricing first does not change purchase rate.
- Ha: Showing monthly pricing first changes purchase rate.
This framing keeps the claim honest. Pricing presentation can improve comprehension, but it can also anchor visitors in a lower-commitment mindset. You don't want the wording to assume the outcome before data arrive.
Here's a short explainer before the next example:
Good hypotheses need clean inputs
Even perfectly written hypotheses won't save a dirty test.
If your event tracking is inconsistent, your traffic mix changes mid-test, or your email experiment is sent to a low-quality list, the result becomes harder to trust. For email A/B tests in particular, list hygiene matters before statistics ever enter the picture. If you're testing subject lines or send strategies, using a verified list from a tool like CleanMyList helps reduce noise caused by invalid or low-quality addresses.
You can think of it this way:
- A weak hypothesis creates confusion before the test.
- Dirty data creates confusion during the test.
- Poor interpretation creates confusion after the test.
When teams tighten all three, experimentation becomes much more useful. You stop asking, “Did B look a bit better?” and start asking, “What exact claim did we test, and what evidence do we have for it?”
Connecting Hypotheses to P-Values and Decisions
A written hypothesis matters because it gives the p-value a job to do.
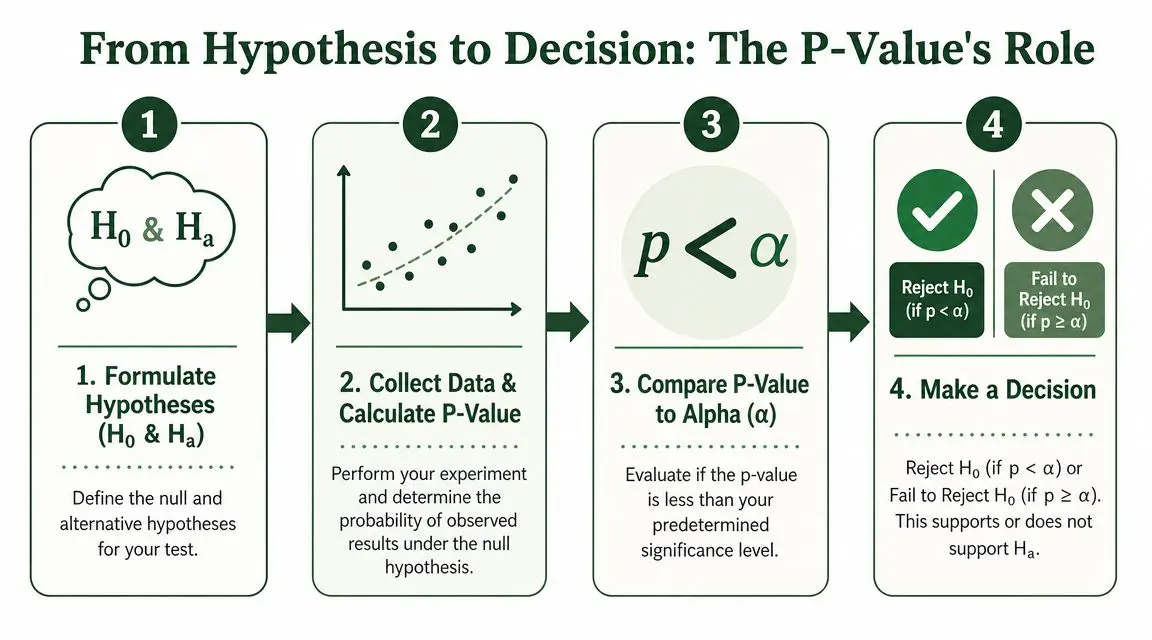
Without that setup, the p-value is just a number in a report. With the setup, it becomes part of a decision rule. You specify the null hypothesis, state the alternative, run the test, calculate the p-value, and compare that p-value with your chosen significance threshold.
What the p-value is actually doing
In plain language, the p-value tells you how compatible your observed result is with the null hypothesis.
A small p-value means your observed data would be relatively unlikely if there really were no difference. When that value is smaller than your pre-set significance level, you reject the null hypothesis. That gives support to the alternative.
The logic is procedural, not mystical:
| Step | Question |
|---|---|
| Form hypotheses | What counts as no effect, and what counts as an effect? |
| Run experiment | What happened in the observed sample? |
| Calculate p-value | How surprising would these data be if H0 were true? |
| Compare with threshold | Is the evidence strong enough to reject H0? |
Why 0.05 keeps appearing
In clinical trials, a conventional Type I error rate of 5% is widely used, meaning researchers accept a 1-in-20 chance of falsely rejecting the null hypothesis. The same literature notes that Type II error is commonly set between 10% and 20%, corresponding to 80% to 90% power, as described in this overview of hypothesis testing, Type I error, Type II error, and power in clinical research.
For marketers, the exact threshold might be chosen by the platform or by your testing policy, but the underlying trade-off is the same. A stricter threshold reduces false positives, while a looser one makes it easier to call winners.
Working interpretation: A significance threshold is a risk policy. It's not a truth machine.
If your testing platform reports results at a confidence threshold, that's closely related to this decision framework. If you want to understand the reporting layer better, this guide to what a confidence interval means in statistics helps translate test output into clearer business interpretation.
How to make the final decision without overreaching
Suppose your p-value falls below the chosen threshold.
The correct conclusion is not “the alternative hypothesis is definitely true”. The correct conclusion is that the data provide enough evidence to reject the null hypothesis under the rules you set before the test.
If the p-value doesn't cross the threshold, the correct conclusion is not “the two versions are identical”. It means you failed to reject the null based on the evidence collected.
That distinction matters in practice because a non-significant result can come from several situations:
- There may be no meaningful effect.
- The effect may exist but be too small to detect clearly in this run.
- Noise in traffic, tracking, or implementation may have blurred the signal.
Teams that understand this make better calls. They don't celebrate every low p-value as proof, and they don't treat every non-significant result as a dead idea. They ask what the test was designed to detect, what evidence was gathered, and whether the business impact justifies action.
Three Common Misconceptions to Avoid
Most bad A/B testing decisions don't come from complicated maths. They come from simple misunderstandings repeated with confidence.
Mistaking support for proof
A low p-value does not prove the alternative hypothesis with certainty.
It gives you evidence against the null under a defined testing framework. That's a narrower claim, but it's the honest one. When teams turn “evidence against H0” into “we proved B works”, they oversell the result to stakeholders and create fragile confidence.
Treating the alternative as “the better version”
This one causes endless confusion.
The alternative hypothesis does not mean “the version we hoped would win”. It means there is a detectable population effect. That effect can be positive, negative, or different depending on how you framed the test. Guidance aimed at practical readers makes this point clearly: the alternative can support a worse outcome just as readily as a better one, and a statistically significant result may still be too small to matter commercially, as explained in this discussion of what an alternative hypothesis means in practice.
A statistically significant result answers a statistics question first. It does not automatically answer the business question.
A variant might produce a detectable change while still being a poor decision operationally. Maybe it increases clicks but lowers lead quality. Maybe it nudges form completions without affecting purchases. Maybe it creates a tiny gain that doesn't justify engineering time or brand risk.
Reading the p-value as the probability the alternative is true
This is probably the most common verbal shortcut, and it's wrong.
The p-value is not the probability that the alternative hypothesis is true. It is not the probability that the null is false either. It's a statement about how unusual your observed data would be if the null hypothesis were true.
That sounds technical, but the practical consequence is simple. Don't tell your team, “There's a 95% chance B is the winner,” unless your method supports that statement. In a standard frequentist A/B testing workflow, that isn't what the p-value means.
A better stakeholder summary sounds like this:
- We defined no difference as the starting assumption.
- We observed results that would be unlikely under that assumption.
- Under our pre-set decision rule, we rejected the null.
- The result appears statistically persuasive, but we still need to judge commercial importance.
That last line is where profitable testing lives. Statistical evidence helps you avoid random launches. Business judgement helps you avoid pointless ones.
If you want a simpler way to run disciplined experiments, Otter A/B helps teams set up website tests, split traffic, track outcomes, and interpret results within a frequentist testing workflow, so your decisions about headlines, CTAs, and layouts rest on a clear hypothesis instead of a hunch.
Stop guessing
Ready to start testing?
Set up your first A/B test in under five minutes. No credit card required.
- 14-day free trial
- No credit card required
- Cancel anytime