Data Driven Decision Making: Your 2026 Guide to Growth
Adopt data driven decision making for your team. Our 2026 guide provides a step-by-step framework to set goals, run A/B tests, and boost outcomes.
Your team already has data. The problem is that it often arrives too late, lives in too many tools, or never gets tied to an actual decision.
That's why so many e-commerce and growth teams still argue the old way. A headline review turns into a taste debate. A pricing page change gets approved because the founder prefers one version. A promo banner stays live because nobody wants to touch something that might be “working”. None of that is a process. It's just organised guesswork.
Data driven decision making fixes that when you keep it practical. You don't need an enterprise analytics department to start. You need a clear goal, trustworthy tracking, a steady testing rhythm, and a team that knows how to interpret what they're seeing. Lightweight A/B testing is what makes that realistic for growing teams, because it turns “we should look into this” into a fast, measurable decision loop.
Moving Beyond Gut Feel in Marketing Decisions
A familiar scene plays out in most marketing teams.
One person wants the homepage headline to sound bold and brand-led. Another wants it stripped back to a direct value proposition. The designer prefers the cleaner option. The paid team wants message match with ads. The founder likes the line that “feels premium”. If nobody tests it, the winner is usually the most senior voice in the room.
That's expensive. Not because every instinct is wrong, but because you never learn why one version works better.
A better approach is simple. Put both messages in front of real visitors, split traffic, define the success metric before launch, and let the result guide the rollout. Instead of debating whether “Shop the Collection” or “Find Your Perfect Fit” is stronger, you measure what happens when each version meets real buying intent.
Practical rule: If a page element can influence behaviour, it can be tested instead of argued about.
This shift isn't niche or theoretical. The UK already has a mature commercial ecosystem around data use. The market includes approximately 9,600 active, VAT-registered data-driven companies, with 5,500 specialising in data infrastructure or software according to the UK data-driven market report. That matters because it shows the practice has moved well beyond boardroom jargon. Teams across the UK already buy, build, and operate around data-informed workflows.
What changes when teams stop guessing
The biggest change isn't just better reporting. It's better decision quality.
When teams rely on gut feel alone, three things usually happen:
- Opinions outrank evidence and meetings take longer than they should.
- Changes stack up without attribution so nobody knows which edit moved performance.
- Learning gets lost because the team remembers the outcome, not the logic behind it.
When teams use data driven decision making properly, they create a repeatable loop. They spot a problem, form a hypothesis, test a version, review the outcome, and store the insight. Over time, that process becomes more valuable than any single winning test.
Why lightweight experimentation matters
A lot of guidance on data driven decision making still sounds like it was written for large companies with analysts, engineers, and six approval layers.
Growing teams need something leaner. They need a workflow that fits inside live campaigns, product launches, seasonal pushes, and weekly trading reviews. That's where lightweight experimentation becomes useful. You can validate messaging, navigation, offer framing, product page layout, or checkout friction without turning every question into a large technical project.
The point isn't to remove judgement. The point is to give judgement evidence.
Laying the Foundation with Goals and Clean Data
Most failed experimentation programmes don't fail because the test idea was bad. They fail because the team launched on top of weak tracking and vague objectives.
If the goal is “improve the site”, you can't prioritise properly. If tracking is inconsistent, you can't trust the outcome. That's the part many teams try to skip, then they wonder why every dashboard tells a different story.
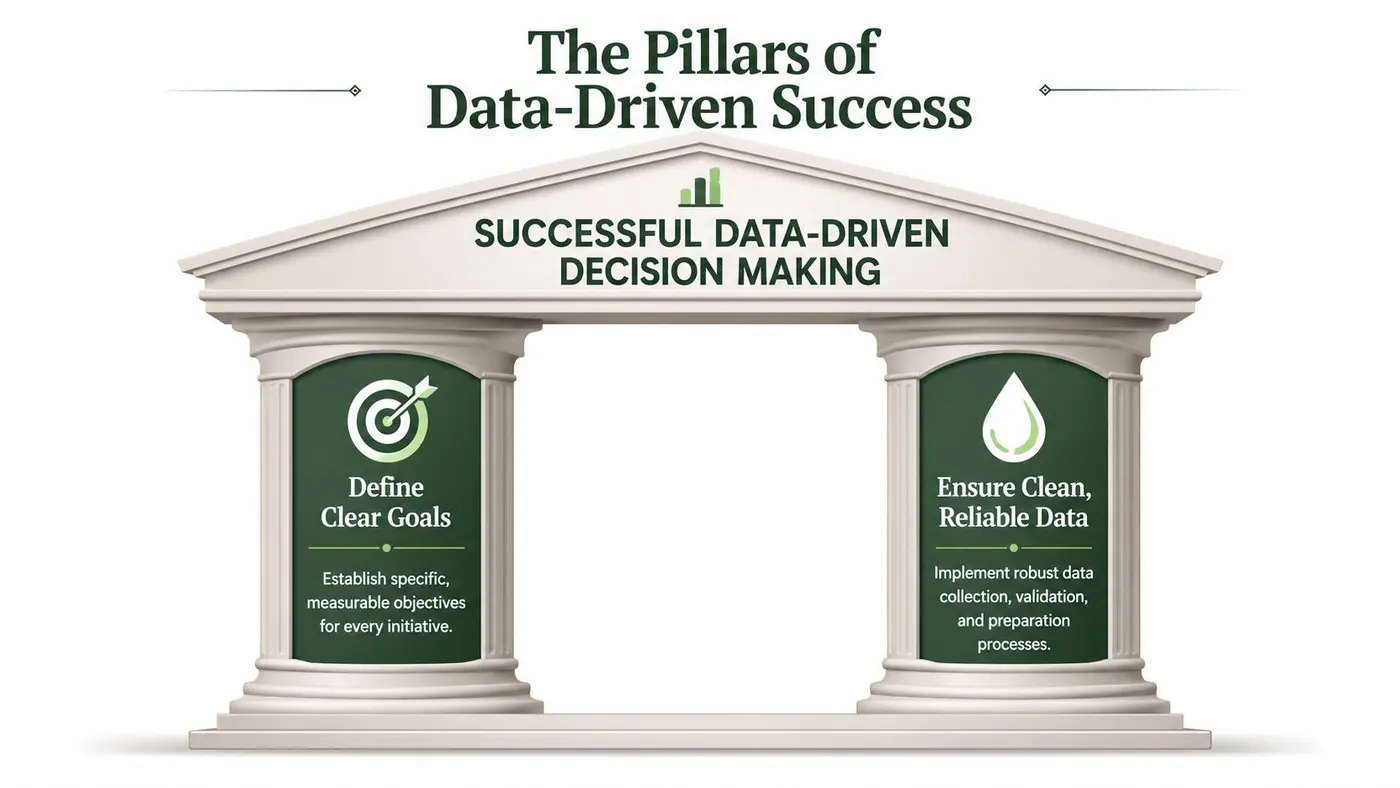
Start with one decision that matters
A disciplined approach works better than a broad transformation promise. In the UK, effective data driven decision making is often handled as a 90-day organisational framework, with the first 30 days focused on building data collection infrastructure and selecting decisions where data is already available according to this 90-day framework for data-driven decision making.
That's a useful operating model for e-commerce teams because it forces focus.
Pick one commercial decision such as:
- Homepage messaging if your bounce rate is high and paid traffic quality is solid.
- Product detail page layout if visitors view products but hesitate before adding to basket.
- Checkout completion if intent is strong but sales don't convert cleanly.
A single decision with a clear owner is better than a long optimisation wishlist.
Write goals that can survive scrutiny
A useful goal has three parts:
- The page or flow
- The behaviour you want
- The metric that proves it
“Improve the homepage” is weak.
“Increase clicks from the homepage hero to collection pages” is testable.
“Increase completed purchases from product page sessions” is stronger still, because it ties the experiment to a business outcome rather than a vanity interaction.
Don't choose a KPI because it's easy to see in a dashboard. Choose it because a win on that KPI would justify shipping the change.
Clean data means consistent definitions
Clean data isn't glamorous. It's also where real optimisation starts.
If one team defines a conversion as a checkout start, another defines it as a purchase, and a third uses platform-reported sales with different attribution logic, your test analysis will drift before the first variant even launches. The same happens when event names are inconsistent, tags fire twice, or mobile and desktop journeys aren't recorded the same way.
In practice, I'd treat data hygiene as a pre-launch checklist:
- Event accuracy: Confirm the key events fire once, at the right moment, and on the right pages.
- Naming consistency: Keep metrics and event labels standard across platforms.
- Source alignment: Make sure the analytics tool, storefront platform, and test platform describe the same action the same way.
- Fallback handling: Decide how you'll treat incomplete sessions, consent gaps, and missing values before analysis starts.
Missing values warrant more attention than they typically receive. If you're cleaning exports or joining multiple sources, this guide on PlotStudio AI on missing data is a useful reference for deciding when to remove, impute, or flag gaps instead of ignoring them.
For a practical workflow on audit routines, naming conventions, and validation habits, this post on data cleaning best practices is worth keeping in your team's playbook.
What clean setup looks like in the real world
You don't need perfect instrumentation across the whole business before you start. You do need reliability where you're testing.
That usually means:
| Area | What to confirm before launch |
|---|---|
| Primary metric | The core goal is recorded consistently |
| Secondary metrics | You can spot hidden trade-offs such as weaker downstream sales |
| Device coverage | Mobile, tablet, and desktop all behave as expected |
| QA process | Someone checks variants, events, and reporting before traffic is split |
Teams that skip this phase often call the result “inconclusive” when the underlying issue was bad setup.
Running Experiments with a Lightweight A/B Testing Workflow
Once your goal and tracking are stable, experimentation becomes operational rather than theoretical. Lightweight A/B testing then earns its place. You can move from idea to live test quickly, without turning a copy change into a development sprint.
For a growing e-commerce or SaaS team, the biggest advantage is speed with control. You can test a page element, isolate the variable, and collect evidence before the next planning cycle buries the idea.
Build one hypothesis, not five
A clean test starts with a narrow hypothesis.
Good example: changing the primary CTA on a SaaS landing page from “Get a Demo” to “Start Your Free Trial” will increase qualified sign-ups because it reduces perceived friction.
Weak example: update the headline, swap the CTA, shorten the form, add testimonials, and test a different hero image all at once.
The first version lets you interpret the result. The second creates noise.
A simple workflow looks like this:
-
Identify the friction point
Use session behaviour, funnel drop-offs, on-site search terms, sales objections, or support logs to locate hesitation. -
Write the hypothesis
Tie the proposed change to a user motivation. Don't test random design preferences. -
Create the control and variant
Keep everything else stable so the result stays interpretable. -
Choose the goal before launch
Primary goal first. Secondary metrics after that. -
Split traffic and QA the experience
Check rendering, event firing, and device behaviour before you expose the test to meaningful traffic.
If your team needs a refresher on process discipline, this guide on how to conduct A/B testing gives a solid walkthrough of the basic mechanics.
A concrete landing page example
Say your landing page currently leads with a CTA that asks for a demo request. That can work when buying intent is high and the audience expects a sales conversation. It can also suppress action if visitors are still evaluating.
A lightweight test would keep the page structure intact and only change the CTA language and supporting microcopy. The control remains “Get a Demo”. The variant becomes “Start Your Free Trial”, with nearby copy clarifying that setup is quick and commitment is low.
That setup does three useful things:
- It isolates intent framing rather than redesigning the whole page.
- It reduces interpretation risk because the variable is obvious.
- It creates a shipping decision you can defend once data comes in.
When you're documenting test setup, use a standard build checklist so anyone on the team can review targeting, variants, and goals consistently. A practical example lives in this guide to creating a test.
Keep the workflow fast but not sloppy
Fast testing doesn't mean careless testing.
The teams that get value from experimentation usually have a lightweight operating rhythm:
- Weekly idea intake: pull ideas from analytics, merchandising, UX reviews, support, and paid search.
- Simple prioritisation: favour tests with clear reach, clear reasoning, and low implementation effort.
- Tight QA: one person builds, another verifies.
- Decision logs: write down what changed, why it changed, and what happened.
A fast experiment is only useful if the team can trust it enough to act on it.
This is also where lightweight tools help. If the mechanics of launching a test are simple, marketers and product teams can own more of the process directly. That keeps experimentation close to the people who understand the customer journey.
A useful primer on the mindset behind rapid iteration is below.
What works and what usually doesn't
A few patterns show up repeatedly.
What works
- Single-variable tests on high-visibility elements such as headlines, CTAs, offer framing, and key layout blocks.
- Clear audience targeting when traffic source or device meaningfully changes intent.
- Short feedback loops where the team reviews outcomes quickly and either ships, iterates, or archives.
What doesn't
- Testing cosmetic tweaks with no behavioural logic
- Launching too many variants too early
- Running experiments with unclear ownership
- Treating every result as a universal truth across all audiences
Good experimentation is less about volume and more about disciplined repetition.
Analysing Results and Proving Business Value
Many teams lose momentum at this point. They launch the test, wait for a dashboard to move, and then stop at “Variant B won”. That isn't enough.
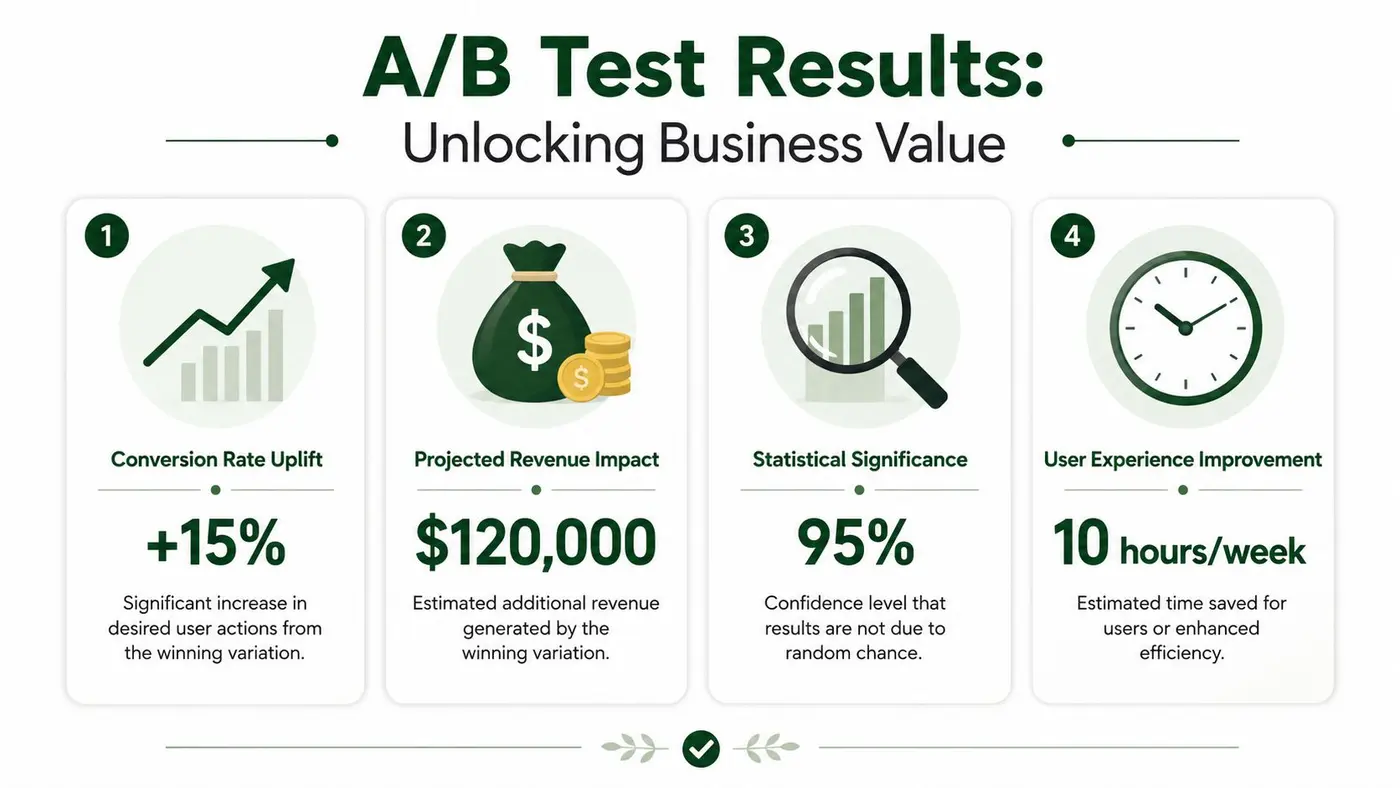
A result matters when you can explain three things clearly. What changed, how confident you are in the result, and whether the win holds up against business metrics that matter beyond the page itself.
Read the result before you celebrate it
A/B test analysis gets messy when teams focus on the first encouraging signal they see.
A variant might lift clicks on the hero CTA but lower completed purchases. A product page layout might improve add-to-basket rate while dragging average order quality. A shorter form might increase leads while weakening lead quality. If you only watch the first conversion event, you can ship a change that creates more activity but less value.
That's why I prefer a simple analysis stack:
| Metric layer | What it tells you |
|---|---|
| Primary metric | Did the tested behaviour improve |
| Secondary conversion metric | Did the downstream journey stay healthy |
| Commercial metric | Did the change support revenue, order value, or lead value |
| Segment view | Did performance differ by device, region, or traffic source |
Confidence matters, but so does context
Statistical significance sounds intimidating, but the practical question is simple. Are you seeing a real pattern, or could random chance explain the difference?
The danger is reacting too early. Teams spot a temporary lead, declare a winner, and roll out a version before the sample is mature enough to justify the decision. The opposite problem is waiting forever because they don't trust any result unless it looks perfect.
UK marketers using structured data driven decision making report a 27% median increase in conversion rates after 90 days, but 53% of programmes suffer from analysis paralysis caused by 5+ disconnected data sources, which leads to a 31% delay in decision velocity according to SuperOffice's UK article on data-driven decision making. This is the core tension. Better analysis creates value, but fragmented analysis slows action.
The right question isn't “Do we have more data?” It's “Do we have enough trustworthy evidence to make the next decision?”
Tie test outcomes to the numbers stakeholders care about
Executives rarely care that a button colour changed or a headline improved click-through on its own. They care whether the change improved the commercial path.
So when you present a result, don't stop at conversion rate. Show the chain:
- What user behaviour shifted
- What happened further down the funnel
- Whether the change improved business outcomes
- Whether the result is worth shipping, iterating, or discarding
For founders and operators who need reporting tied more closely to commercial performance than surface-level engagement, this piece on revenue-focused data for founders is a useful framing device.
For internal reporting, consistency matters more than fancy dashboards. Use one reporting structure every time: hypothesis, setup, result, decision, next action. If your team needs a stronger reporting template, review these reporting best practices.
A strong readout sounds like this
Not: “Variant B looked better and we should probably ship it.”
Better: “The revised CTA improved the primary action without weakening downstream purchase behaviour. The lift held across the main traffic segments we reviewed, and the result is strong enough to justify rollout. The next test should focus on the supporting copy, because that's now the most visible source of friction.”
That's what proves business value. Not the screenshot. The decision.
Building a Sustainable Data Culture and Governance
A single winning test helps a page. A data culture helps the whole team make better calls under pressure.
The hard part isn't buying tools. It's getting marketers, merchandisers, designers, product managers, and stakeholders to use evidence consistently when deadlines are tight and opinions are loud.
Data literacy decides whether the system works
Many data driven decision making programmes stall because the people closest to the work don't feel confident interpreting results. In the UK, only 34% of employees feel confident interpreting data for decision-making according to Sage's article on data-driven decision making. That's a serious operational issue, not a training footnote.
If a growth manager can launch a test but can't explain confidence, trade-offs, or metric quality, the workflow breaks at the point where the business needs judgement.
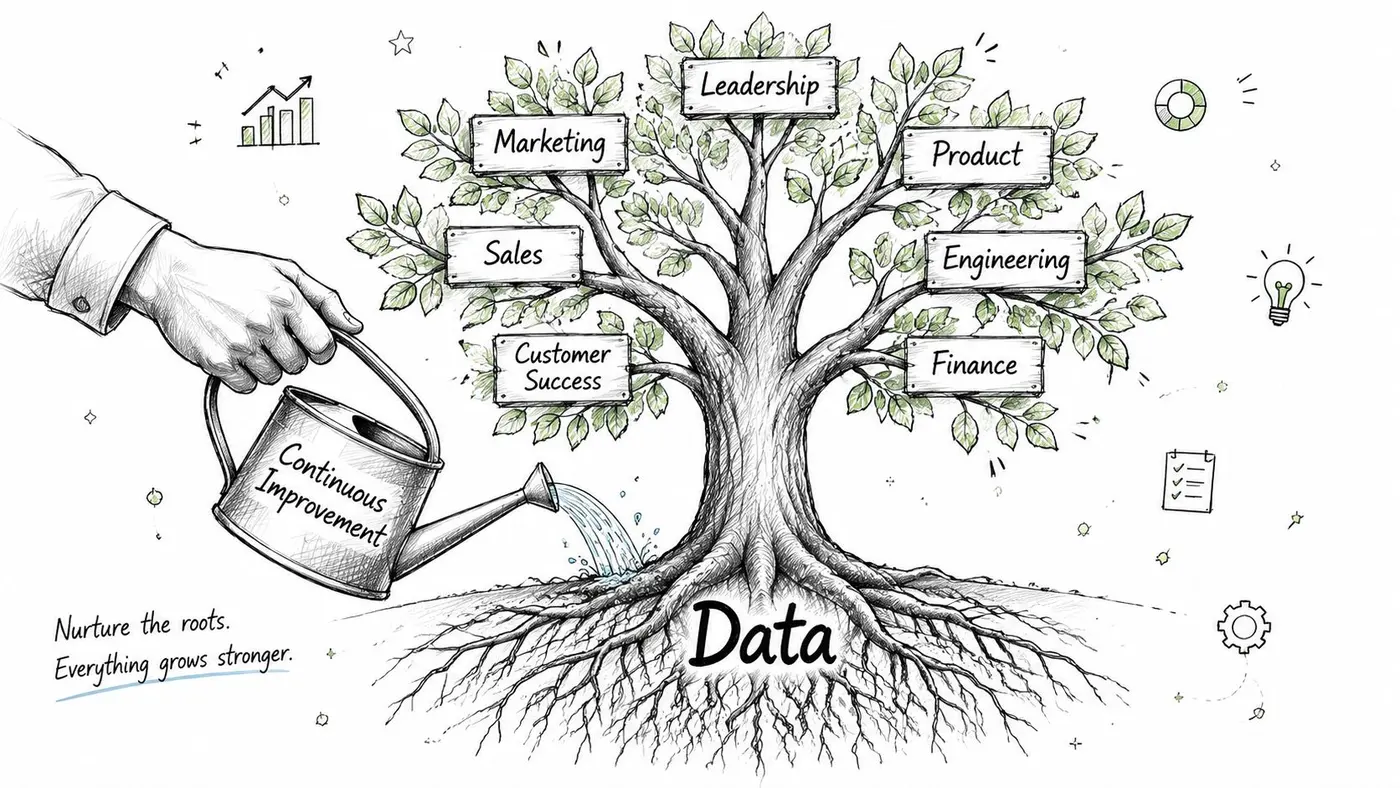
What a workable culture looks like
A strong data culture doesn't require everyone to become an analyst. It requires shared operating habits.
Those habits usually include:
- Clear ownership: someone owns the experimentation roadmap, someone owns implementation QA, and someone signs off final rollouts.
- Shared language: the team agrees on what counts as a conversion, a valid test, and a decision-ready result.
- Visible learning: wins, losses, and inconclusive tests are documented where the whole team can access them.
- Routine review: insights are discussed in trading, product, or growth meetings rather than left inside a specialist channel.
Governance should remove friction
Governance sounds heavy, but the useful kind is lightweight. It answers practical questions before confusion appears.
For example:
| Governance question | Useful answer |
|---|---|
| Who can approve a live test | Named owners, not a vague group |
| Where test ideas go | One backlog, not scattered messages |
| How results are shared | Standard reports with the same decision format |
| When a winner ships | Clear threshold and rollout responsibility |
That structure protects speed. Without it, teams rerun old tests, misread prior outcomes, or ship changes that conflict with each other.
Teams don't need more dashboards. They need enough confidence to challenge assumptions without turning every decision into a debate.
Train for interpretation, not just tool usage
The weakest enablement sessions focus on which buttons to click. The stronger ones teach people how to think.
Train non-technical staff to ask questions like:
- Is this metric the right one for the business decision?
- Could another change have influenced the result?
- Are we seeing a real behavioural improvement or just more low-quality activity?
- What would make this result unsafe to ship broadly?
When people can answer those questions, data becomes a working language inside the team instead of a specialist output passed around after the fact.
Common Pitfalls and Your Implementation Checklist
The most common mistakes in data driven decision making aren't dramatic. They're small habits repeated often enough to distort the whole programme.
One team ends tests too early. Another chooses metrics that look good in slides but don't affect revenue. Another trusts dashboards but never checks whether users had a better experience. These aren't technical edge cases. They're the day-to-day reasons optimisation programmes flatten out.
Common data driven decision making pitfalls and how to avoid them
| Pitfall | Why It's a Problem | Solution |
|---|---|---|
| Ending tests too early | Early movement can reflect noise rather than a stable pattern | Decide your review rules before launch and wait for a result you can defend |
| Testing multiple major changes at once | You won't know which change caused the outcome | Keep early tests narrow and interpretable |
| Using vanity metrics | More clicks or form starts may not improve the business outcome | Pair the primary metric with a downstream commercial metric |
| Confirmation bias | Teams see what they hoped to see and ignore contrary signals | Write the hypothesis and success criteria before the test starts |
| Poor tracking hygiene | Inconsistent event definitions distort analysis | Audit tracking and metric naming before traffic is split |
| Ignoring qualitative inputs | Numbers alone can miss confusion, distrust, or UX friction | Add user feedback, support themes, and session evidence to the readout |
One pitfall deserves extra emphasis. Over-reliance on quantitative data can damage customer experience if teams optimise purely for mechanical wins. In the UK, 42% of consumers say poor data-driven experiences reduce trust, and combining data with qualitative insight leads to 28% higher campaign success rates in the UK retail sector according to Social Finance on what we've learned about data-driven decision making. That's why high-performing teams don't treat analytics as the whole story. They pair it with customer context.
Your implementation checklist
Use this as a working routine, not a one-off project plan.
- Choose one decision first: start with a page, flow, or funnel step that affects a meaningful business outcome.
- Define the KPI clearly: write down the primary metric and the secondary checks before launch.
- Clean the data path: validate tags, events, naming, and reporting consistency.
- Write a real hypothesis: connect the change to a user motivation or friction point.
- Keep the test focused: avoid stacking several major changes into one variant.
- Review with discipline: analyse the primary metric, downstream effects, and commercial impact together.
- Document the learning: store the hypothesis, result, and rollout decision where the team can find it later.
- Train the team continuously: build confidence in interpretation, not just dashboard use.
- Blend quant and qual: check what the data says and why the customer may have behaved that way.
- Repeat the cycle: the advantage comes from accumulation, not one winning test.
Data driven decision making works when it becomes a habit. Not an annual initiative. Not a reporting exercise. A habit.
If you want to make experimentation part of that habit, Otter A/B gives growing teams a lightweight way to test headlines, CTAs, and layouts without turning every experiment into a heavy engineering project. It's a practical fit for marketers, CRO specialists, and e-commerce teams that need faster answers, cleaner reporting, and a simpler path from idea to decision.
Stop guessing
Ready to start testing?
Set up your first A/B test in under five minutes. No credit card required.
- 14-day free trial
- No credit card required
- Cancel anytime