Inconclusive Test Results: Why A/B Tests Fail & How to Fix
Get clarity on inconclusive test results. Discover why your A/B tests fail and learn actionable strategies to fix them, boosting your optimization in 2026.
You launch a test with a clear hypothesis. The new headline should sharpen value. The shorter form should reduce friction. The redesigned product page should help more visitors buy.
Two weeks later, the dashboard gives you almost nothing back.
The lines sit on top of each other. Control and variant move a little, then flatten. No winner. No obvious loser. Just an inconclusive result that feels like wasted effort.
If you run enough experiments, this isn't an exception. It's normal. Industry data indicates that anywhere from 50% to 80% of A/B test results are inconclusive depending on the vertical and testing stage, often because the probability of a winner doesn't clear the standard 90% to 95% significance threshold (Better2Know).
That's frustrating, but it isn't failure.
A flat result still tells you something useful. It may tell you the sample was too small, the tracking was noisy, the variant was too timid, the traffic mix shifted, or the change didn't matter to users. Good CRO work starts when you stop treating inconclusive test results as a dead end and start treating them as a diagnosis problem.
That Frustrating Flat Line an Introduction
A familiar pattern shows up in nearly every testing programme.
A team spots a weak page, writes a reasonable hypothesis, builds a variant, and pushes traffic into a clean split. The early numbers look promising for one side. Then they reverse. Then they compress. Then the tool tells you there isn't enough evidence to call it.
The first mistake is emotional. People read “inconclusive” as “the platform failed”, “the idea was bad”, or “testing takes too long”. None of those is necessarily true. The more useful reading is simpler: the experiment produced uncertainty that needs handling.
In optimisation, the costly mistake isn't getting an inconclusive result. It's reacting to one with guesswork.
That matters because inconclusive test results are common enough that every serious growth team needs a repeatable response. If your programme depends on every experiment producing a neat winner, you'll end up stopping too early, overreading noise, or shipping changes that never had solid evidence behind them.
The practical question isn't “Why didn't this work?” in the abstract. It's “What kind of inconclusive result is this?” A weak hypothesis and a broken event pipeline can look similar in a dashboard. They require completely different next steps.
Teams often don't need more theory. They need a way to decide whether to extend, rerun, redesign, or kill the test.
The Anatomy of an Inconclusive Result
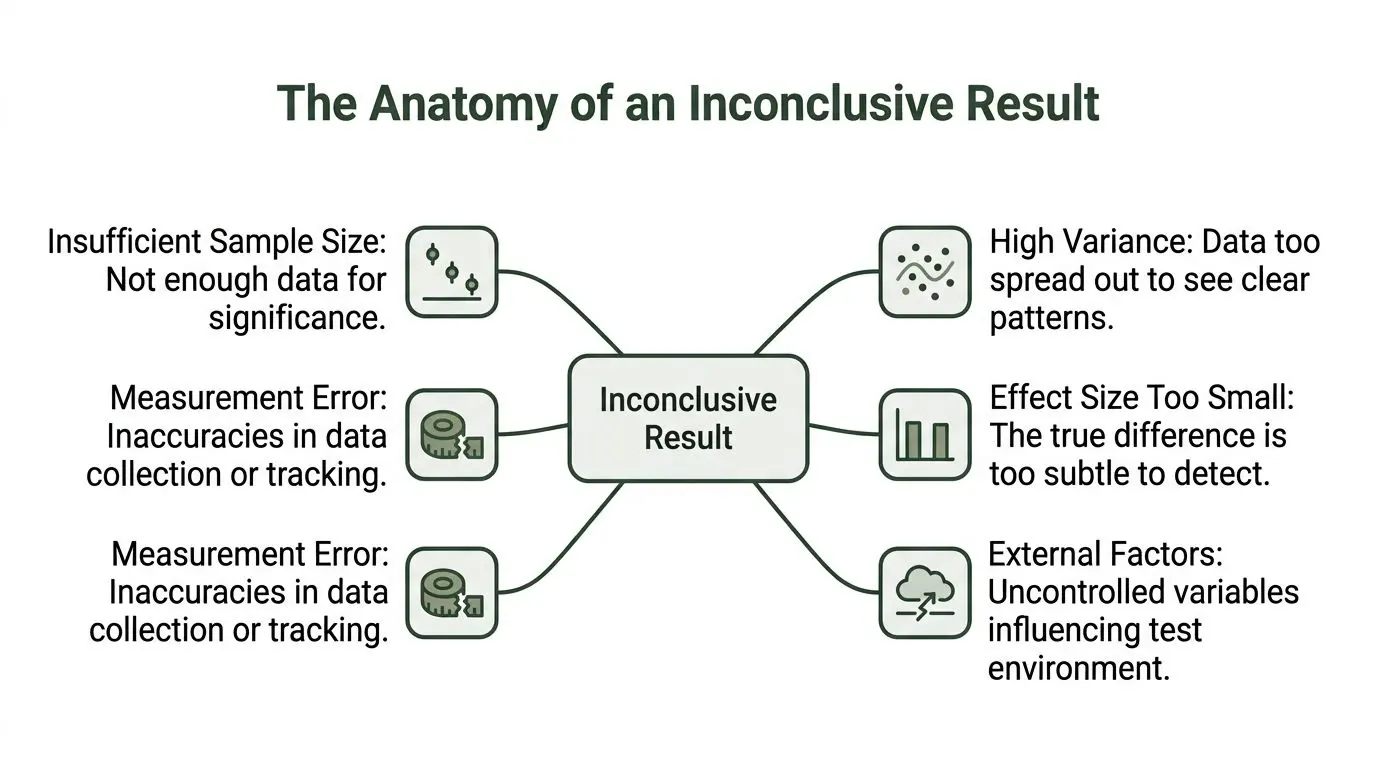
An inconclusive result means the test did not reduce uncertainty enough to support a decision with confidence. That is a measurement problem first, and only sometimes a creative problem.
A common scenario looks like this. A new variant leads for two or three days, then control catches up, then both versions sit inside a narrow range where every update feels meaningful and none of it is stable enough to ship against. In practice, that flat line can hide several very different situations: weak evidence, noisy behaviour, bad instrumentation, or a real effect that is too small to matter to the business.
What significance actually tells you
Teams often treat significance as a verdict. It is better used as a decision threshold.
A 95% significance threshold is a common bar for calling a winner, but the useful interpretation is simpler than the jargon suggests. If the test does not clear your threshold, the current evidence is still consistent with more than one outcome. The variant might be better. It might be worse. It might be functionally the same. You do not have enough signal to separate those cases cleanly.
Four concepts shape that judgment:
- Statistical significance asks whether the observed gap is likely to be more than random variation.
- P-value is one way to quantify that uncertainty.
- Confidence interval shows the range of effects still plausibly supported by the data.
- Power determines whether the test had a fair chance to detect the kind of lift you cared about.
The operational point is straightforward. An inconclusive test usually means the experiment failed to narrow the range of plausible answers enough for a business decision.
Why power changes the outcome before the test even starts
Power is where many teams slowly lose ground.
If the expected lift is small and traffic is limited, the test can run cleanly and still fail to answer the question. This happens often on sites with modest traffic, especially those below roughly 50,000 monthly visitors or pages where only a small share of users reach the tested step. On those tests, a subtle headline change or minor layout adjustment may never generate enough separation to produce a confident read in a reasonable timeframe.
That does not make the test worthless. It changes the decision you should design for. If a programme can only detect larger effects, the variant needs to be stronger, the target metric needs to sit closer to the change, or the team needs to accept a longer run time before reading the result.
There is a useful parallel in performance analysis. The guide to 90th percentile in web performance shows why averages can hide the experience of real users at the edge. Experiment readouts have the same weakness. A tidy topline conversion rate can hide unstable segment behaviour, a wide spread in outcomes, or a small pocket of users driving most of the movement.
Clean data before interpreting behaviour
A surprising share of inconclusive tests start in the tracking setup, not in the hypothesis.
If events fire twice on one variant, revenue is delayed in one browser, or assignment logic breaks for returning users, the result will look noisy even when user behaviour is not. I always check instrumentation before debating whether the idea itself failed. A practical set of data cleaning best practices helps catch the kind of issues that waste weeks of test time and send teams into the wrong post-test discussion.
This is also where a platform matters. Otter A/B is most useful when it helps teams judge result quality, not just report a probability. Segment visibility, cleaner experiment tracking, and faster validation of setup issues make it easier to tell whether a flat result deserves more time, a redesign, or a hard stop.
Practical rule: Do not interpret an inconclusive result until you trust the sample, the tracking, and the size of effect the test was actually capable of detecting.
Diagnosing the Five Main Causes of Inconclusiveness
When a test stalls, I don't start by asking whether the variant “won”. I start by asking what kind of failure mode showed up.
Most inconclusive test results trace back to five causes. Some are statistical. Some are operational. Some are just discipline problems dressed up as analytics.
The diagnostic checklist
| Potential Cause | Symptom | How to Verify |
|---|---|---|
| Insufficient sample size | Early swings, wide uncertainty, no stable direction | Recheck your original sample assumptions and whether traffic was enough for the expected effect |
| High variance in user behaviour | Daily results jump around with no consistent pattern | Review segments, traffic sources, device mix, and unusual campaign or merchandising changes |
| Test ran for the wrong duration | The test stopped before behaviour normalised, or ran through distorted periods | Compare results against business cycles such as weekday patterns, promotions, launches, and holidays |
| Measurement or tracking error | Conversion counts don't reconcile with analytics or revenue systems | Validate event firing, attribution rules, checkout tracking, and variant assignment |
| Minimal or no meaningful effect | Metrics remain tightly clustered despite clean data | Revisit the hypothesis and ask whether the change was strong enough to alter behaviour |
Cause one is usually volume, but not always
The most common culprit is simple. You didn't collect enough data for the size of effect you hoped to detect.
This doesn't just happen on low-traffic sites. It also happens when teams test cosmetic changes against stubborn metrics. A button shade, a short headline edit, or a single trust badge may be worth testing, but you shouldn't expect fast clarity from tiny interventions on important business outcomes.
The fix isn't “always run longer”. The fix is matching test ambition to traffic reality.
Cause two hides in unstable traffic
Variance ruins more tests than people admit. Paid traffic quality shifts. Email sends spike low-intent visitors. A promotion changes buying urgency. Mobile traffic dominates one week and falls the next.
When user behaviour gets noisy, the signal from your variant gets buried. For this reason, proper segmentation and stable experiment conditions matter. Teams building stronger measurement discipline often lean on broader growth marketing analytics solutions to connect campaign, product, and revenue data before they trust experiment calls.
If your traffic mix changed, your test question changed too.
Cause three is bad timing
An experiment can be technically live and still be badly timed.
Stopping too early is obvious, but running through distorted periods can be just as harmful. A site redesign, stock issue, pricing change, PR surge, or checkout bug can contaminate the read. The dashboard won't always warn you. Someone has to connect the experiment data to what the business was doing during the test window.
Cause four is instrumentation
This is the most expensive kind of inconclusive result because teams often mislabel it as “user behaviour”.
Check the basics:
- Variant assignment: Are users being consistently bucketed?
- Goal firing: Does the conversion event trigger in the same way across both experiences?
- Revenue tracking: Are refunds, duplicate orders, or delayed purchase events skewing one side?
- Cross-device paths: Are users starting on one device and converting on another in a way your setup misses?
If you need a refresher on how sample planning and decision confidence connect, this explainer on how to calculate statistical power helps ground the discussion before you rerun anything.
Cause five is the hardest to accept
Sometimes the variant didn't move behaviour in a meaningful way.
That doesn't mean the effort was wasted. It means the hypothesis didn't create enough user impact to matter on the metric you chose. Experienced optimisers learn to separate “good idea in theory” from “material change in observed behaviour”.
That discipline saves months.
Your Decision Framework What to Do Next
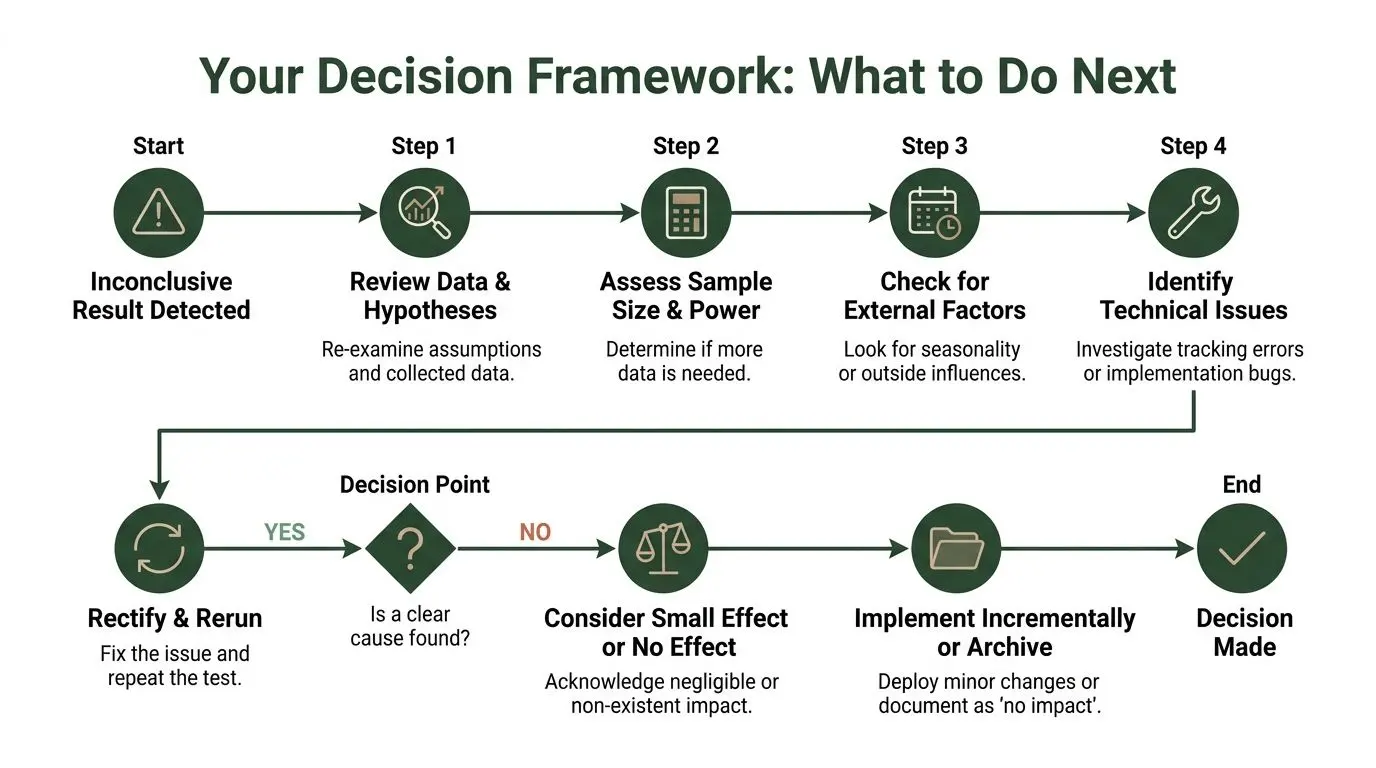
Once you've identified the likely cause, the next move should be procedural, not emotional. An inconclusive result needs a decision. The wrong decision is usually one of two extremes: keep the test limping on forever, or end it in frustration and ship whichever version someone prefers.
A better approach is to use a short decision framework.
Decision one extends the test only when the logic is sound
Extend the test if three things are true:
- The data collection is trustworthy
- Traffic conditions remain stable enough to preserve the original question
- You still have a realistic path to enough evidence
If those conditions aren't met, more time usually gives you more ambiguity, not more clarity.
A lot of teams extend tests by default because it feels cautious. It often isn't. It can tie up traffic that would be better used on a stronger experiment.
Decision two increases power by changing the setup
Sometimes the smartest move is not to wait longer but to redesign the test conditions.
That might mean:
- Sending higher-intent traffic: If the audience is too broad, narrow to the users most likely to respond.
- Choosing a more sensitive metric: A micro-conversion, engagement milestone, or qualified click can reveal directional movement earlier than a final purchase.
- Adjusting the expected effect: Stop planning as if a tiny design tweak will transform revenue behaviour.
- Simplifying the experiment: Fewer variants mean faster learning per version.
This isn't statistical compromise. It's better test design.
Decision three rewrites the variant
If the implementation is clean and the traffic is adequate, a flat result often means the change wasn't bold enough.
That's common in mature programmes. Teams optimise for internal comfort, not user impact. They test polite edits instead of meaningful differences in value proposition, information hierarchy, proof, pricing presentation, or friction removal.
A useful reset is to ask a harder question: would a new visitor even notice the difference without being told?
If the honest answer is no, the test probably asked too little of the user and too much of the data.
Field note: The safest-looking variant is often the least testable one.
Decision four looks beyond the primary conversion rate
Primary conversion rate matters, but it doesn't always tell the whole story.
You may have an experiment where checkout starts stay flat while order composition improves. Or sign-ups remain similar while downstream purchase behaviour looks stronger. That's why experienced teams review supporting metrics such as revenue per visitor, average order value, lead quality, or completion depth before declaring a result useless.
This step needs restraint. You're not fishing for a winner. You're checking whether the original metric was too narrow to capture the business effect of the change.
Decision five sets a stop-loss rule
Every experiment should have a point where you stop spending attention on it.
A practical stop-loss rule might end the test when one of these happens:
- A clear data quality issue appears and can't be corrected without restarting
- External conditions materially change and make the comparison unfair
- The estimated effect remains too small to matter operationally
- A stronger hypothesis is ready and traffic would be better allocated there
This protects the programme from indecision. Good optimisation isn't about squeezing certainty out of every test. It's about allocating learning effort where it has the highest expected value.
How Otter A/B Helps Prevent Inconclusive Tests
Some inconclusive test results come from reality. Others come from the tooling layer. You can't fix weak hypotheses with software, but you can reduce the avoidable noise that makes decent experiments unreadable.
That starts with speed and implementation quality.

A testing setup that slows the page, introduces flicker, or applies variants inconsistently can create the exact kind of instability that leads teams to misread user behaviour. Otter A/B is designed to stay out of that trap. Its lightweight SDK, zero-flicker delivery, and broad site integrations reduce the implementation friction that often sits behind noisy outcomes.
Cleaner implementation reduces false ambiguity
When teams test on Shopify, WordPress, Webflow, WooCommerce, Wix, Squarespace, ClickFunnels, Framer, Next.js, or through Google Tag Manager, the hidden risk is rarely the idea itself. It's mismatched tracking, brittle scripts, or front-end behaviour that changes across templates.
That's why reliable setup matters so much. If the platform makes variant control clear and instrumentation easier to trust, you spend less time asking whether the experiment broke the page and more time asking whether the hypothesis was right.
For teams that want a stronger process around monitoring test quality, the experiment health guidance is useful because it keeps attention on implementation checks rather than just topline numbers.
Revenue metrics often break the tie
Conversion rate alone can leave good experiments looking flat. Revenue measures often reveal whether a variant changed purchase quality, basket composition, or value per visitor.
Otter A/B's ability to track purchases, average order value, revenue per variant, and revenue trends helps with that practical problem. Instead of staring at a near-identical sign-up rate, a team can inspect whether one experience led to stronger commercial behaviour. That doesn't mean forcing a winner. It means using the metric that best matches the business question.
Better operational discipline improves decisions
There's also a workflow advantage in not ending tests too early.
Slack notifications when significance is reached help teams avoid the common pattern of manually checking dashboards, second-guessing partial data, and stopping at the first convenient moment. Password-protected reports and easier sharing reduce another frequent source of test drift, where stakeholders work from screenshots or hearsay instead of the same live result set.
If you're looking for inspiration on stronger hypotheses before you even launch, this collection of actionable marketing experiments for growth is a useful prompt library. Stronger test ideas won't remove uncertainty entirely, but they do reduce the odds that you spend weeks measuring changes users barely notice.
Advanced Thinking for Inconclusive Outcomes
A flat result at the end of a high-stakes test creates a specific kind of problem. The team still has to decide whether to ship, rerun, segment, or walk away, and an “inconclusive” label does not answer any of that.
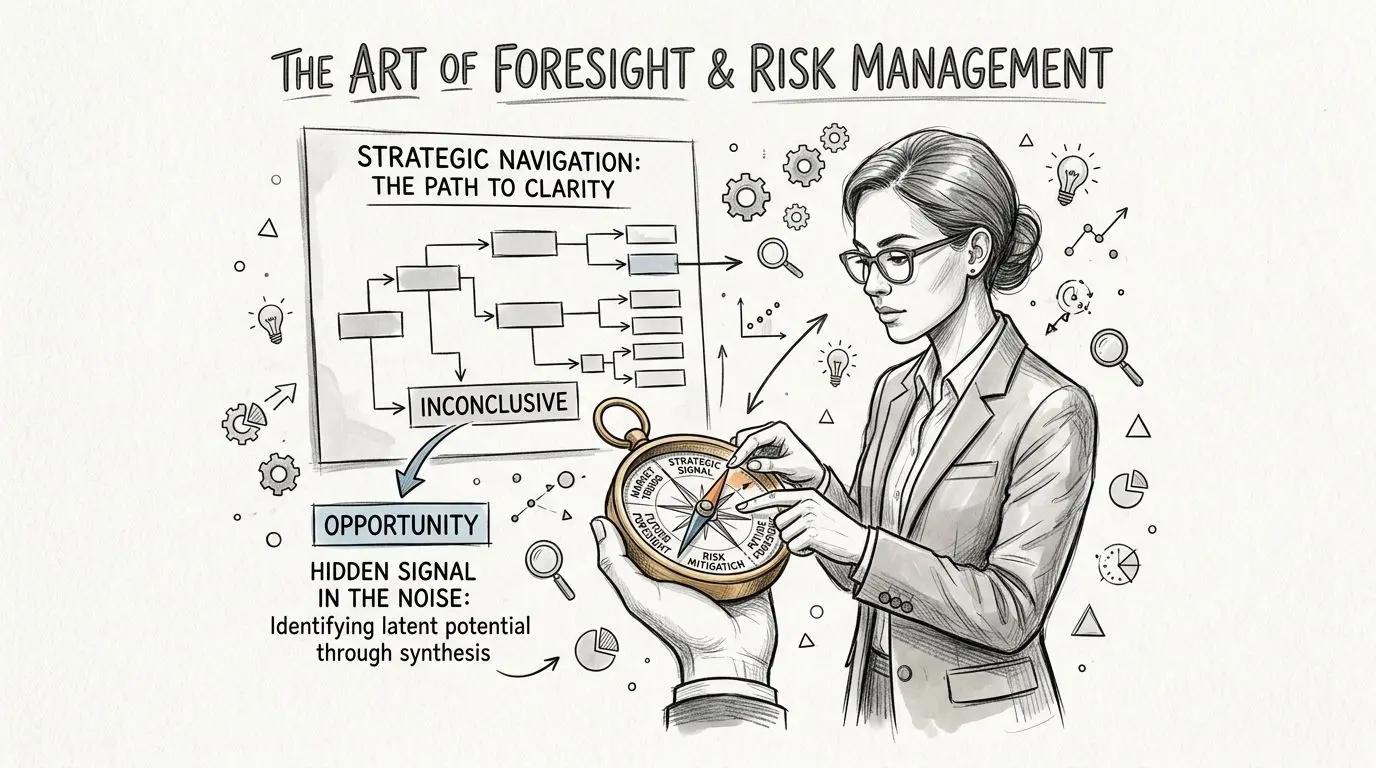
The stronger teams I've worked with treat inconclusive outcomes as a decision problem, not a reporting problem. Uncertainty has practical value because it shows where the business is exposed. It may point to a weak hypothesis, noisy measurement, unstable behaviour across segments, or an effect too small to matter commercially.
Other fields already treat inconclusive outcomes as risk markers
A useful comparison comes from the UK's bovine tuberculosis testing programme. In England's High Risk Area, 40% of officially TB-free herds contain at least one animal with an inconclusive test result, and animals with an inconclusive result were found to be 18.22 times more likely to be confirmed as reactors later, which shows that an inconclusive outcome can signal increased future risk (UK Parliament written question response).
That logic applies well in CRO.
If a pricing page test, checkout test, or sign-up flow test stalls without a clear winner, the right conclusion is often that this part of the journey deserves tighter scrutiny. Instrumentation may need work. The hypothesis may be too broad. The decision threshold may have been vague from the start. A mature testing programme records that risk and responds to it, instead of filing the result away as “nothing happened.”
The bigger cost is organisational drift
An inconclusive result creates a vacuum, and different stakeholders fill it in different ways.
Design stakeholders may prefer the cleaner interface. Paid media teams may argue for the variant with stronger click-through. Product managers may push to close the ticket and move on. Leadership may start questioning why testing is not producing clearer outcomes. Once that starts, the discussion shifts from evidence to preference.
That is the actual cost.
Ambiguous experiments also slow operating speed. Teams wait for one more week of data, one more segmented read, one more meeting to interpret the same chart. In health screening, inconclusive outcomes often lead to delay and retesting. The business version is slower, but familiar. Work stalls, ownership blurs, and confidence gets mistaken for proof.
Uncertainty affects operating speed as much as analysis quality.
Mature programmes build rules for weak evidence
The practical question is not whether every test reaches significance. It is whether the team knows what to do when one does not.
That usually means setting actions in advance for three different outcomes. Ship when the result is clear and commercially relevant. Stop when the likely effect is too small to justify more traffic. Investigate when the pattern suggests segment variance, measurement problems, or a mismatch between the primary metric and the business goal.
This is also where more advanced methods earn their keep. Sequential testing, for example, gives teams a structured way to evaluate evidence against pre-set significance and futility boundaries during the run of the experiment. The benefit is straightforward. Teams stop earlier when they have a strong answer, and they also stop earlier when further traffic is unlikely to change a weak commercial case.
Otter A/B supports that more disciplined approach because it keeps the decision grounded in the metrics that matter to operators, not just analysts. Revenue tracking by variant, purchase visibility, trend reporting, and clear reporting views help teams separate “no statistical winner” from “no business difference.” Those are not the same thing.
An inconclusive outcome does not mean the programme failed. It means the team needs a rule for acting under uncertainty, and the teams with that rule waste less traffic, spend less time debating, and make better calls.
Stop guessing
Ready to start testing?
Set up your first A/B test in under five minutes. No credit card required.
- 14-day free trial
- No credit card required
- Cancel anytime