Unlock Growth: Real Time Reporting for E-commerce
Learn how real time reporting transforms A/B testing and e-commerce. This guide covers benefits, risks, pitfalls, and implementation.

You launch a homepage test before a major promotion. The design team wants to know whether the new hero layout is helping. Paid traffic is already flowing. The merchandising team is nervous because the wrong variant could depress revenue all afternoon. But your reporting stack won't show a clean view until tomorrow morning.
That lag is where a lot of e-commerce teams lose momentum.
Real time reporting matters because CRO decisions are time-sensitive by nature. A checkout bug, a confusing CTA, or a weak mobile layout can start hurting performance the moment it goes live. If you only learn that after a delayed export or an overnight dashboard refresh, you haven't just lost time. You've lost the chance to act while the result still matters.
Marketing teams usually don't need more data. They need faster trust in the right data.
The Agonising Wait for Actionable Data
A familiar scene plays out in most e-commerce teams.
A marketer launches a new landing page for a paid campaign. The creative looks strong. The offer is clear. Traffic starts coming in, but the team can't tell whether the page is lifting add-to-cart behaviour or damaging checkout completion. Analytics is delayed, the experiment tool only updates on a schedule, and the first serious review meeting won't happen until later.
That delay creates bad habits. Teams start relying on instinct, Slack opinions, or isolated snapshots from different tools. One person watches sessions. Another watches purchases. Someone else checks ad platform click-through data and assumes the landing page must be fine. Nobody has one shared, current picture of what's happening.
When waiting becomes expensive
The problem gets worse during peak trading moments.
If you're running tests during a launch, seasonal promotion, or a high-traffic weekend, every hour matters. A losing variation on a product page doesn't become an interesting report later. It can shape what customers see while intent is high and budgets are active.
For CRO teams, the main issue isn't reporting for reporting's sake. It's the gap between a customer action and your ability to respond. That gap affects:
- Experiment velocity: Slow feedback means fewer completed tests and slower learning.
- Revenue protection: A poor variant can stay live longer than it should.
- Cross-team confidence: Marketing, product, and commercial teams start debating whose numbers are correct.
- Prioritisation: Urgent issues get buried because evidence arrives too late.
A practical way to reduce that confusion is to agree on a small set of metrics that reflect store health. If your team needs a clearer baseline, this guide to key metrics for Shopify stores is a useful reference because it helps separate meaningful indicators from vanity noise.
Practical rule: If a report arrives after the team's best chance to act, it's operationally late even if it's technically accurate.
That's why real time reporting has become so important for modern e-commerce. It gives teams visibility while a campaign, test, or release is still in motion. Instead of waiting for yesterday's summary, you can monitor what customers are doing now and decide whether to keep going, investigate, or stop the damage.
Understanding Your Data's Speed Real-Time vs Batch
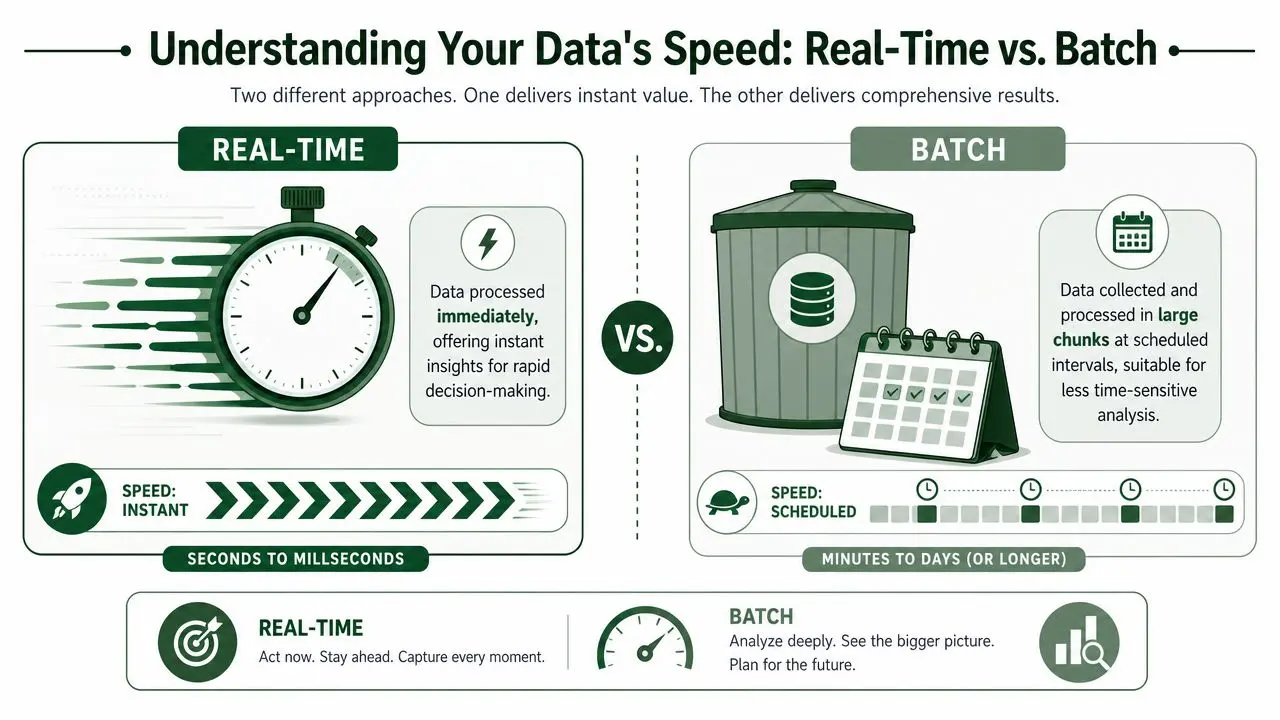
Most confusion around real time reporting comes from one simple issue. Teams use the phrase loosely.
Some systems are immediate. Others update every few minutes. Others still collect data all day and process it later in one large run. Those are not the same thing, and they support very different decisions.
A simple analogy that sticks
Think of your data like water moving from a source to your dashboard.
Batch reporting is a delivery truck. It collects lots of containers, drives them on a schedule, and unloads them later. That works well for finance summaries, weekly planning, or trend analysis where speed isn't the main issue.
Near-real-time reporting is more like a courier service. Updates arrive often, but not continuously. For many operational dashboards, that's good enough.
Real time reporting is a river. The flow never really stops. Actions appear as they happen, or close enough that your team can respond during the event rather than after it.
What the difference means in practice
The UK payroll system offers a useful real-world example of true immediacy. Under the UK's Real Time Information system, employers must report payroll data at each pay event rather than waiting for annual returns, which created continuous transactional reporting instead of a delayed year-end process, as described by Cintra's explanation of RTI payroll reporting.
That's the core idea. The reporting event is tied closely to actual action.
For a marketing team, the equivalent event might be:
| Reporting style | What happens | Best use case |
|---|---|---|
| Batch | Data is collected and processed later | Weekly summaries, board reporting, retrospective analysis |
| Near-real-time | Data appears after a short delay | Operational dashboards, campaign monitoring |
| Real time | Data updates as actions happen | Live experimentation, checkout monitoring, rapid intervention |
A lot of teams discover they don't need every metric in real time. They need the right ones in real time. Revenue by variant, conversion events, checkout drop-offs, and experiment status are good examples because they directly affect decisions.
If your team wants another lens on how immediate analytics changes day-to-day product work, this piece on real-time analytics for product teams is worth reading.
The question isn't “Can we make all data faster?” It's “Which decisions become better when the data arrives sooner?”
That distinction helps avoid an expensive mistake. Real time reporting isn't automatically better for every workflow. It's better when delay has a business cost.
How Real-Time Insights Drive E-commerce Growth
Real time reporting becomes valuable the moment it changes a decision.
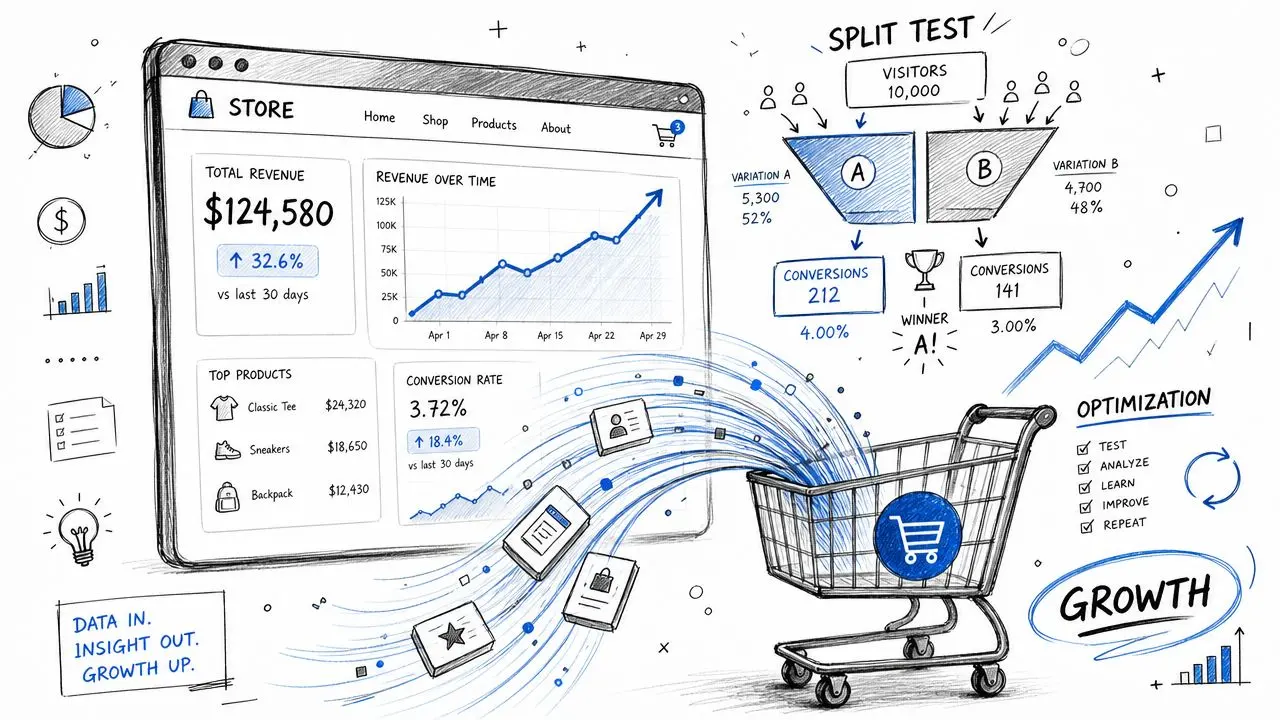
In e-commerce, that usually happens inside live experiments, promotional windows, and checkout flows. Those are the places where customer behaviour shifts quickly and where delayed visibility can leave a weak experience in place for too long.
Faster testing means faster learning
A/B testing is often framed as a design exercise. In practice, it's an operational discipline.
When results appear quickly, teams can spot whether a variant is directionally healthy, whether tracking is behaving properly, and whether a page change has unintended side effects further down the funnel. That doesn't mean declaring a winner instantly. It means reducing the dead time between launch, observation, and informed action.
For example, if a new product page headline increases clicks into the funnel but hurts completed purchases, you want to know that while the test is still live. If a revised cart layout improves revenue quality, you want confidence soon enough to roll the experience out without waiting for a slow reporting cycle.
Real time is not the same as correct
There's also a less obvious benefit. Real time reporting exposes data issues sooner.
A 2026 CIPP report noted a gap in payroll operations where organisations relying only on standard sign-off reports missed errors in their real-time submissions, showing that immediate submission without proper reconciliation still creates operational risk, as summarised in Deel's glossary entry on RTI. The CRO version of that problem is easy to recognise. A dashboard may update quickly, but if events are misfiring, attribution rules are wrong, or revenue isn't mapped correctly, speed alone won't help.
That's why good teams pair live visibility with disciplined checks. They review whether the numbers line up across the experiment platform, analytics stack, and commerce backend. They don't assume a fast dashboard is automatically a trustworthy one.
For a useful companion read, these reporting best practices highlight the habits that keep experiment data usable when several stakeholders are involved.
The metrics that matter most
In CRO, the highest-value real time metrics are usually the ones closest to commercial outcomes:
- Revenue per variant: Helpful when conversion rate alone hides basket quality.
- Purchase completion: Essential for spotting checkout friction.
- Average order value trends: Useful when one variation changes buying behaviour.
- Goal completion by device or segment: Important for understanding who is responding, not just whether the test moved overall.
Here's a short explainer that shows why speed matters when stores optimise live customer journeys:
Good experimentation teams don't move faster because they rush. They move faster because the feedback loop is shorter.
That's the core business impact. Better reporting cadence increases experimentation velocity. More tests finish cleanly. More weak ideas get rejected early. More strong ideas reach customers sooner.
The Architecture of Instant Data Pipelines
Real time reporting can sound abstract until you break it into small parts.
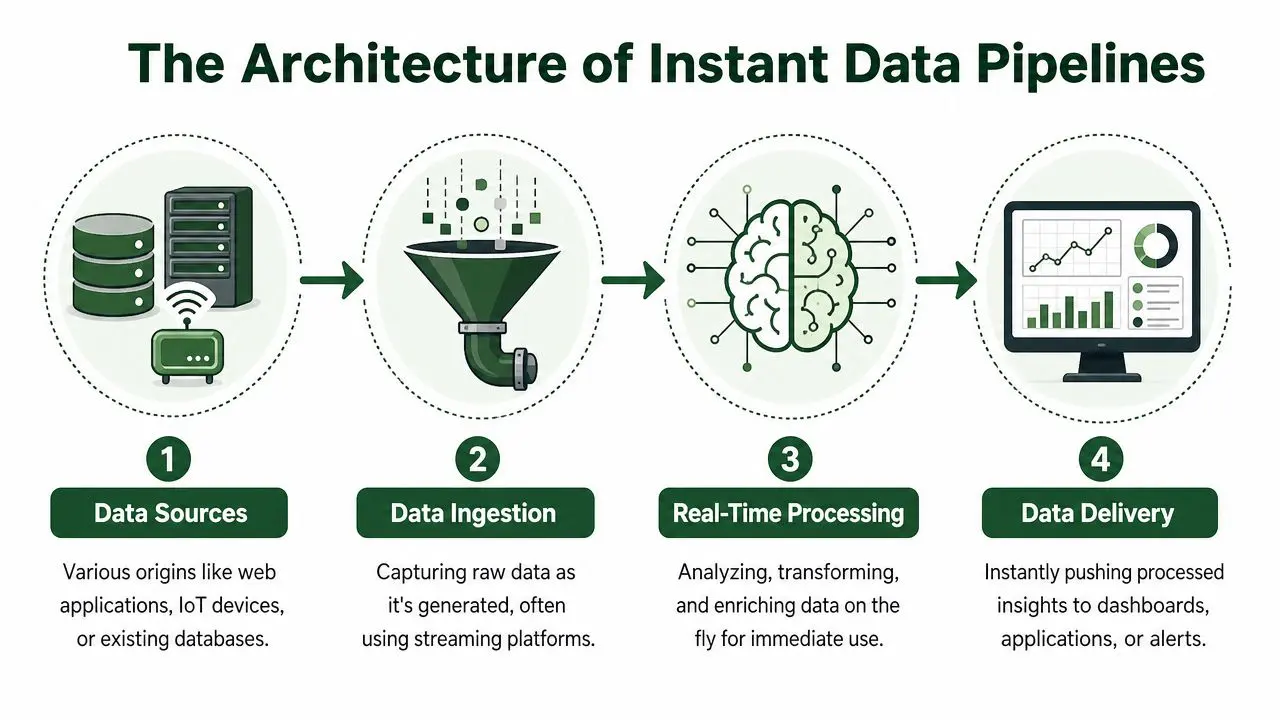
At a technical level, the process is simple. A customer does something on your site. That action gets captured as an event. The event is sent through a pipeline. The pipeline processes it and pushes the result into a dashboard or alert.
The complexity sits underneath. The basic logic does not.
What actually happens after a click
Say a shopper clicks “Add to cart”.
A lightweight script or SDK on the site records that action. It might attach details like the experiment variant, page context, device type, product, and session. That event is then sent to a backend service built to ingest high volumes of small messages quickly. Processing rules clean it up, enrich it, and route it to the places that need it, such as reporting views, alerts, or experiment summaries.
The payroll world uses a tightly defined version of the same principle. Under HMRC's RTI model, employers must send a Full Payment Submission for each pay event with specified fields such as National Insurance numbers, pay figures, tax, and pension contributions, creating transaction-level accountability at the moment of reporting, as explained in Inform Direct's guide to RTI reporting.
That example matters because it shows the architectural mindset. The event is the unit of truth.
The four moving parts
Most instant pipelines for web experimentation include four layers:
-
Capture
A browser event, purchase, form submission, or page view gets recorded the moment it happens. -
Transport
The event moves from the browser or app into a backend system built for fast ingestion. -
Processing
The platform validates fields, groups related events, and prepares them for reporting. -
Delivery
Dashboards, alerts, and experiment views update so the team can act.
Why managed systems appeal to marketing teams
A custom event pipeline can work. It can also become a burden.
When teams build everything themselves, they have to manage event schemas, delivery reliability, dashboard freshness, data validation, edge cases, and ongoing maintenance. That's a lot of responsibility for a workflow that most growth teams want to trust and use.
Managed platforms are appealing because they compress that operational work into a simpler setup. If you want a plain-language overview of what that kind of implementation looks like, how Otter A/B works gives a practical example of the managed approach without requiring a heavy engineering project.
A useful test for any reporting setup is this: can the marketing team understand the pipeline well enough to trust the output, without needing a data engineer to decode every anomaly?
That's where architecture affects business outcomes. Simpler pipelines usually mean fewer blind spots, less internal waiting, and faster experimentation cycles.
The Statistical Danger of Peeking at Your Results
Real time reporting creates a new temptation. You open the dashboard constantly.
That feels responsible. In practice, it can produce bad decisions.
When teams keep checking an A/B test and try to call a winner too early, they increase the chance of acting on noise. A variation can look strong for a short window because of timing, traffic mix, or random fluctuation. If you stop there, you may ship a false winner and build confidence around a result that won't hold up.
Why more frequent viewing can reduce decision quality
This is the part many teams miss. Faster data does not automatically mean better interpretation.
The UK Office for National Statistics made a related judgment call in a different context. As of March 2026, it focused its well-being dashboard on updating only a subset of measures annually, prioritising deeper interpretability over more frequent partial updates, according to the Financial Times report on ONS real-time indicators and reporting changes. The lesson for experimentation is clear. Data frequency and insight quality are not the same thing.
What marketers should do instead
A good discipline is to separate observation from decision-making.
You can watch live trends to confirm that tracking works, traffic is flowing, and nothing is obviously broken. But you shouldn't treat every wobble in the chart as a final answer. Decision thresholds need a statistical framework behind them.
That usually means asking:
- Is the sample mature enough? Early movement can be unstable.
- Is the observed difference consistent? One spike doesn't prove a durable lift.
- Does the method control false positives? Without that, repeated checking can mislead.
- Are we looking at the right business metric? A variant can lift clicks while hurting revenue quality.
For marketers who want a cleaner grounding in this topic, this explainer on confidence intervals in statistics is a helpful starting point because it shows why uncertainty matters as much as the headline result.
The mature view of real time reporting
The right takeaway isn't “don't use live dashboards”. It's “don't confuse live dashboards with final proof”.
Real time reporting is excellent for operational awareness. It helps you monitor tests, detect problems, and coordinate faster. But the final decision to ship a winner still needs statistical discipline. The strongest experimentation teams use both. They move quickly, but they don't guess.
Adopting Real-Time Reporting with Otter A/B
For many teams, the biggest blocker isn't believing in real time reporting. It's assuming adoption will be messy.
It doesn't need to be. The practical route is to start with one experiment, one decision-maker, and one set of business metrics that matter. Keep the setup narrow enough that the team can learn the workflow without turning implementation into its own project.
Start with a test that deserves speed
Choose a test where delayed reporting would clearly reduce value.
Good candidates include headline experiments on high-traffic landing pages, checkout messaging, cart friction fixes, or product detail page layouts. These are changes where quick visibility helps the team protect revenue or scale a good result sooner.
Then write a clear hypothesis. Not “let's try a new design”, but “we think this version will improve the purchase journey because it removes hesitation at a key step”.

Keep implementation light
The best real time reporting setups don't force teams into unnecessary complexity.
That principle echoes a recent policy decision in the UK. In April 2026, HMRC dropped a planned requirement for detailed employee hours data in RTI submissions to reduce administrative burden, as reported by the Chartered Institute of Payroll Professionals. There's a useful parallel for marketing teams. If a simpler managed route gives you the visibility you need, that's often better than building a larger system than the job requires.
A straightforward rollout usually looks like this:
-
Install the snippet
Add the platform's lightweight code through your site or tag manager. -
Create variants
Define the experience you want to compare, such as a new hero section or CTA. -
Set goals
Track the outcomes that matter commercially, such as purchases or revenue-related signals. -
Launch and monitor
Watch the live dashboard for data quality, directional movement, and any operational issues. -
Decide with discipline
Ship, stop, or iterate when the result is trustworthy.
Make reporting usable across the team
One reason real time reporting projects stall is that the output only makes sense to one specialist.
Keep the dashboard readable for marketers, designers, and commercial stakeholders. Use consistent experiment names. Define goals before launch. Decide who can pause a test if results look unhealthy. Write down what counts as a decision, not just what counts as activity.
That's how real time reporting becomes part of team behaviour rather than another tool sitting on the side.
Frequently Asked Questions
Will real time reporting slow down my website
It depends on the implementation. A heavy script can affect the experience. A lightweight one usually won't create the same concern. The key is to avoid bloated tracking setups and choose tooling designed for fast client-side delivery.
Is real time reporting always the best choice
No. Some decisions don't need instant data.
If you're reviewing quarterly trends, merchandising mix, or broader customer cohorts, batch reporting may be perfectly fine. Real time reporting is most valuable when delayed visibility changes what your team can do next. CRO, live testing, checkout monitoring, and promotional oversight fit that category well.
What's the difference between a live dashboard and a trustworthy result
A live dashboard shows movement quickly. A trustworthy result means the data has been collected, interpreted, and tested with enough discipline that you can act on it confidently. Those are related, but they aren't identical.
Can we avoid the peeking problem without a dedicated experimentation platform
You can try, but it's harder than many teams expect.
You'd need a consistent method for defining stopping rules, evaluating uncertainty, and preventing premature calls based on unstable early movement. That's possible with in-house analysis, but it requires more statistical care than most growth teams can apply in the middle of a busy launch cycle.
What should a marketing team watch first
Start with a short set of metrics tied to commercial outcomes. For most stores, that means conversion-related events, purchase completion, and variant-level revenue signals. Don't begin with dozens of charts. Begin with the metrics that would cause you to keep a test running, stop it, or ship the winner.
Does real time reporting replace batch analytics
Usually not. The best teams use both.
Real time reporting helps with immediate action. Batch analytics helps with deeper review, trend interpretation, and strategic planning. One supports speed. The other supports reflection. Mature reporting stacks keep those roles distinct.
If your team wants faster experiment feedback without turning setup into an engineering project, Otter A/B is a practical place to start. It gives marketers and CRO teams live reporting on tests, revenue-aware results, and a lightweight implementation path, so you can spend less time waiting for dashboards and more time making confident decisions.
Stop guessing
Ready to start testing?
Set up your first A/B test in under five minutes. No credit card required.
- 14-day free trial
- No credit card required
- Cancel anytime