What Is Statistical Power: Master A/B Tests in 2026
Discover what is statistical power & why it's vital for reliable A/B tests. Our 2026 guide explains components, sample sizes, and how to avoid false negatives.
You launch a headline test on Monday. By the end of the week, the challenger looks promising. A few days later, the result settles into the phrase every marketer hates: not statistically significant.
Nothing feels more wasteful. You used real traffic, waited patiently, argued for dev time, and still ended up with a shrug instead of a decision.
That outcome often isn't bad luck. It's usually a planning problem. If you want to answer the question what is statistical power, the practical answer is this: it tells you whether your test had a fair chance of finding a real effect in the first place. For A/B testers, that makes power less like an academic footnote and more like a pre-launch reality check on speed, budget, and confidence.
The Agony of an Inconclusive A/B Test
A common CRO story goes like this.
A team rewrites a product page headline. The old version feels vague. The new version is sharper, clearer, and better matched to search intent. Everyone expects a lift. The experiment goes live, runs for a while, and the dashboard ends with no clear winner.
The worst part is that the result sounds more informative than it really is. People hear “no significant difference” and assume the change had no effect. That conclusion might be wrong. The test may have been too weak to detect the difference.
When a test teaches you almost nothing
An inconclusive test creates three business problems at once:
- You lose time: the team waits for an answer that never arrives.
- You spend traffic: visitors go through an experiment that may never produce a usable signal.
- You weaken trust: stakeholders start doubting experimentation because the output feels fuzzy.
That's why seasoned testers don't treat analysis as something that begins after launch. They work backwards from the decision they want to make.
A test that cannot reliably detect a meaningful change isn't a neutral experiment. It's an expensive way to create ambiguity.
The hidden question behind every launch
Before any A/B test starts, one question matters more than often acknowledged: if a real improvement exists, how likely is this setup to catch it?
That's the question statistical power answers.
If you ignore it, you can run a technically correct test that is operationally useless. You might do everything “by the book” on targeting, implementation, and reporting, yet still end up unable to separate a weak idea from a strong one.
For growth teams, that's the actual cost. Statistical power isn't about sounding rigorous in a meeting. It's about protecting your testing programme from avoidable dead ends.
Statistical Power Explained with a Simple Analogy
The cleanest answer to what is statistical power is this: it's the probability that your test will detect a real effect if one exists. In plain terms, it measures how likely your experiment is to spot a genuine improvement rather than miss it.
A fire alarm is a useful analogy.
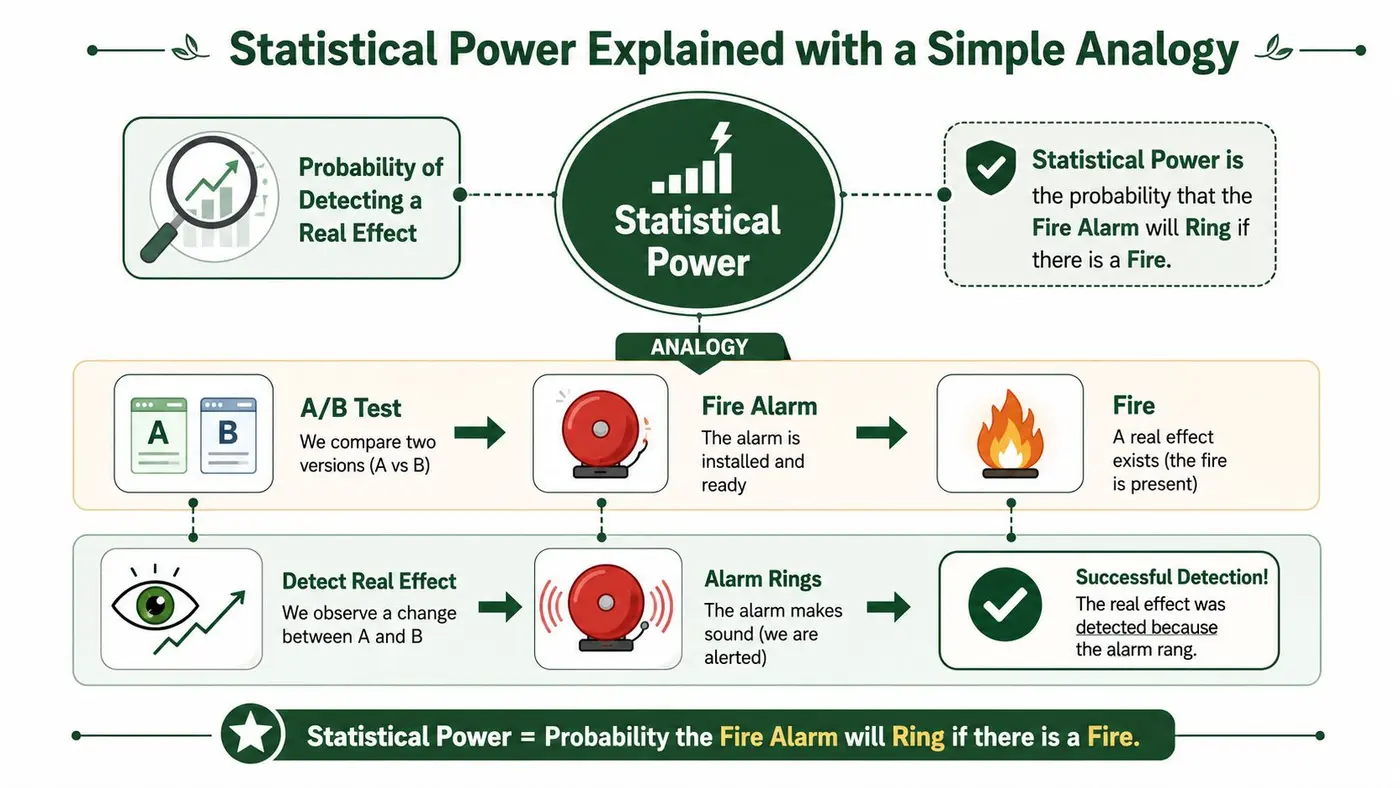
Think of your test like a fire alarm
In this analogy:
- The fire is a real change in performance.
- The alarm is your statistical test.
- Power is the chance the alarm rings when there is a fire.
That framing helps because every experiment can end in one of four basic outcomes.
| Situation | What happened in the test | What it means |
|---|---|---|
| Real effect, detected | The alarm rings when there's a fire | True positive |
| No real effect, no detection | The alarm stays quiet when there's no fire | True negative |
| No real effect, but detected anyway | The alarm rings for burnt toast | False positive, also called Type I error |
| Real effect, but not detected | The alarm stays quiet during a fire | False negative, also called Type II error |
Most beginner guides spend a lot of time on false positives. That matters. But CRO teams often suffer just as much from the opposite problem: a real improvement exists, but the test setup is too weak to find it.
Why this confuses so many people
People often treat power like a permanent label attached to a study. It isn't. In practice, power changes with the minimum effect you care about, the sample-size constraints you face, and the design of the test. That's one reason generic explainers can feel detached from real experimentation work. The Wikipedia entry on statistical power) is useful here because it anchors the core definition while pointing to the context-dependent nature of power in applied settings.
A second source of confusion is that a non-significant result doesn't automatically mean “nothing happened”. It can also mean the data were too noisy or too limited to detect the effect. If you've ever struggled with that distinction, it helps to pair power with an understanding of confidence intervals in statistics, because intervals show the range of plausible effects rather than forcing everything into win-or-lose language.
Here's a short video if you want a visual walk-through of the idea:
If your alarm almost never rings, you won't have many false alarms. You also won't catch many fires.
That's the operational trade-off. A/B testing isn't just about reducing noise. It's about building a test sensitive enough to hear a real signal.
The Four Levers That Control Your Test's Power
Power doesn't appear by magic. It comes from a set of trade-offs you control before the test starts.
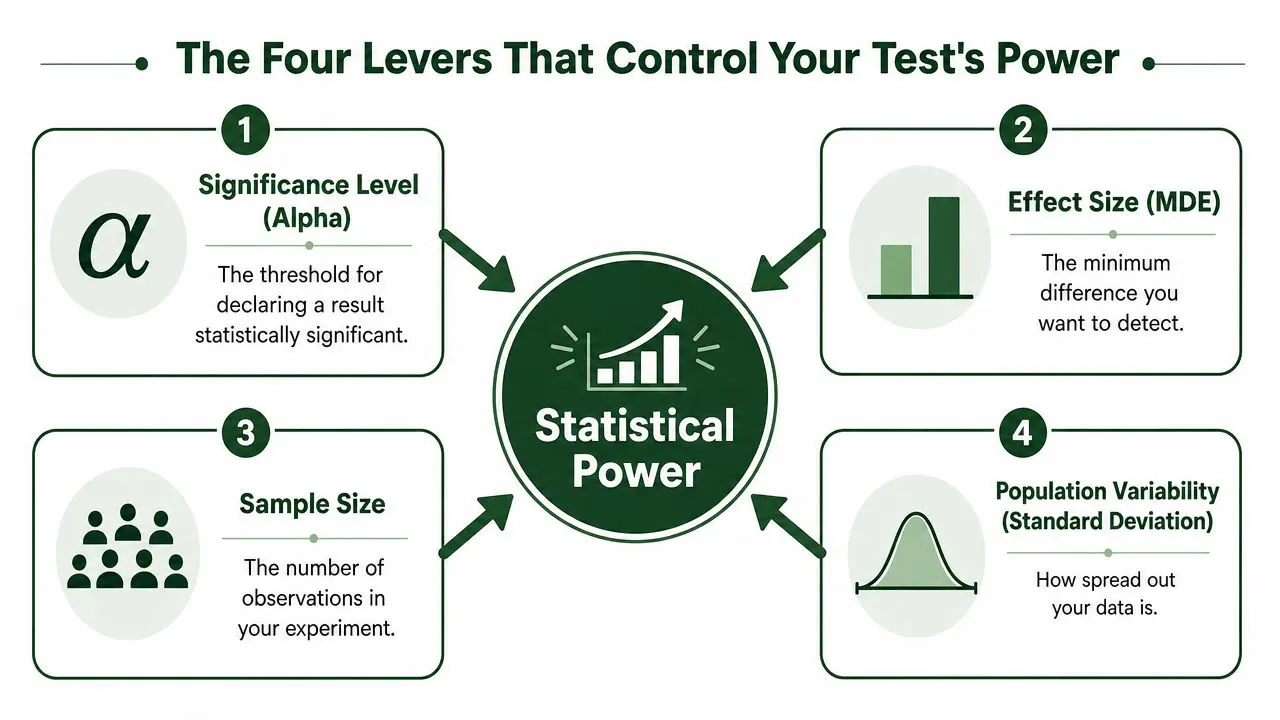
In experimentation work, statistical power is constrained by the relationship between sample size, effect size, and alpha. For a fixed significance threshold, larger samples or larger true effects increase power, while underpowered tests increase the risk of Type II errors. A common target is 80% power, which implies a 20% chance of missing a real difference even when one exists, so sample size should be planned before launch rather than guessed afterwards, as discussed in this NIH overview of power and sample-size planning.
Lever one: the effect size you care about
This is the first strategic choice, and teams often skip it.
Ask yourself: what is the smallest change worth detecting? Not the biggest lift you hope for. The smallest change that would still justify shipping the winner.
If you only care about a large, obvious uplift, your test can be less sensitive. If you care about a subtle conversion gain, your test needs more help elsewhere, usually through more traffic or a longer runtime.
Lever two: sample size
Sample size is the easiest lever to understand and the hardest to expand.
More observations give your test a better chance to distinguish real movement from ordinary variation. That doesn't mean “more is always better” in some abstract sense. It means your desired level of sensitivity has a cost, and that cost is often measured in visitors, sessions, or transactions.
For low-traffic sites, practical constraints become evident. You can't demand quick answers, tiny detectable effects, and strong protection against false negatives all at once.
Lever three: alpha, or your false-positive threshold
Alpha is your tolerance for being fooled by noise.
A stricter threshold makes it harder to declare a winner by accident. That sounds good, and often is, but it also makes detection harder unless you compensate elsewhere. In other words, if you tighten one part of the system, another part has to give.
That's why power planning always feels like a balancing act rather than a single setting.
Lever four: variability in the data
This lever is often forgotten because teams focus on conversion rate and traffic volume, not on how unstable the metric is.
Metrics with high variability are harder to read. Revenue per user, average order value, and seasonal purchasing behaviour can swing around enough to bury a real change. A clean metric acts like a calm pond. A noisy metric acts like choppy water. The same stone creates a harder-to-see ripple.
Practical rule: Power is not a quality badge. It's the result of choices you make about detectable effect, data volume, acceptable false positives, and how noisy the metric is.
How the levers work together
A useful mental model is a control panel:
- Want faster tests? You may need to target only larger effects.
- Want to detect smaller effects? You'll usually need more sample.
- Want stricter evidence? Prepare for a bigger burden on traffic or time.
- Using a noisy outcome metric? Don't expect the same sensitivity you'd get from a steadier one.
This is why experienced CRO teams scope tests before launch. They don't ask, “Shall we test this?” They ask, “Given our traffic and metric noise, can we detect an effect that matters?”
That small shift in thinking prevents a huge amount of wasted experimentation.
How to Plan Sample Size for Your A/B Tests
Sample-size planning sounds technical, but the workflow is straightforward once you stop treating it as a maths problem and start treating it as a decision problem.
The key is to define what would count as a meaningful win before the test starts. That means choosing the outcome metric, estimating your baseline, and deciding the smallest lift that would justify implementation effort.
Start with the business decision, not the calculator
A practical sequence looks like this:
- Pick one primary metric. Don't begin with a bundle of goals. Choose the one metric that will drive the final decision.
- Estimate your baseline. Use a recent, representative baseline rather than a best-ever week.
- Set your minimum detectable effect. This is the smallest relative improvement worth caring about.
- Choose your confidence and power targets. Those choices define how cautious you want to be about false positives and false negatives.
- Calculate the required sample before launch. If the answer is unrealistic, change the test scope before spending traffic.
If you want a quick way to sanity-check that plan, use a sample size calculator for A/B tests before implementation begins.
Why baseline stability matters more than teams expect
Many UK teams get caught out. The UK retail environment is noisy. The Office for National Statistics reports that the UK retail sector includes roughly 300,000 businesses, and retail sales show substantial month-to-month volatility across categories. In practice, that kind of volatility increases the spread of conversion or revenue metrics, which reduces power for a given sample size. Small uplift tests often need longer runtimes or more traffic allocation to achieve the same detection probability as steadier metrics, as explained in this power analysis discussion using UK retail context.
So if your store is dealing with seasonal swings, promotions, payday effects, or broad category demand shifts, don't assume a calculator's neat answer will hold perfectly in the wild. Noise stretches timelines.
A planning table you can use before launch
The exact sample requirement depends on your own baseline, desired effect, confidence setting, and metric behaviour. Use the table below as a scoping framework rather than a source of fixed universal values.
| Baseline Conversion Rate | Minimum Detectable Effect (Relative) | Required Sample Size per Variation |
|---|---|---|
| Low baseline | Small relative effect | Highest sample requirement |
| Low baseline | Large relative effect | Lower than small-effect scenario |
| Mid baseline | Small relative effect | High sample requirement |
| Mid baseline | Medium relative effect | Moderate sample requirement |
| High baseline | Small relative effect | Still substantial if metric is noisy |
| High baseline | Large relative effect | More achievable within shorter tests |
The practical question to ask before every launch
Don't ask, “Can we run this test next week?”
Ask, “Can we give this idea enough traffic and enough time to detect the smallest effect that matters to us?”
If the answer is no, you still have options:
- Narrow the hypothesis: test a larger, more meaningful change.
- Simplify the metric: use a cleaner primary outcome if possible.
- Wait for more traffic: sometimes the right move is patience.
- Drop the test: not every idea deserves a formal experiment.
That last option is underrated. A bad test plan doesn't become good just because you launch it.
Common Pitfalls That Destroy an Experiment's Validity
The biggest testing mistakes don't just lower quality. They can make the result impossible to trust.
Underpowered tests that look responsible
A team sets up a tidy experiment, tracks the right pages, and waits for significance. On the surface, everything looks disciplined.
But if the test never had enough sensitivity to detect the effect that mattered, the process was flawed from day one. Consequently, the usual 80% power convention deserves scrutiny. It's widely repeated, but the primary issue is whether that threshold is suitable for the decision in front of you. When effects are small and noisy, and when traffic or recruitment limits are real, the cost of false negatives can be more important than beginner guides suggest, as noted in this overview of statistical power and decision trade-offs.
Peeking at results and stopping early
This one is common because it feels harmless.
A marketer checks the dashboard every morning. On Wednesday the variant crosses the significance threshold. The team celebrates, stops the test, and ships the change.
The problem is that repeated checking without a proper stopping rule can distort the evidence. In operational terms, you're giving random variation more opportunities to masquerade as a winner.
A better habit is to decide the stopping logic before launch and stick to it.
Treating non-significant as proof of no effect
This is one of the most damaging interpretation errors in CRO.
“Didn't win” is not the same as “did nothing.” A weak test can fail to detect a useful change. That's exactly the business risk behind a Type II error in experimentation.
Non-significant can mean no effect. It can also mean no clear signal. Those are not the same thing.
Chasing tiny uplifts with short tests
Teams often want small gains and fast answers at the same time. That combination is usually where validity breaks down.
Watch for these warning signs:
- Tiny expected impact: if the change is subtle, the burden on the test goes up.
- Short planned runtime: if the calendar is fixed, sensitivity may collapse.
- Noisy primary metric: if revenue swings heavily, small changes become harder to detect.
- Stakeholder pressure: if someone already wants a winner by Friday, interpretation will suffer.
When these conditions pile up, the test isn't just challenging. It's structurally fragile.
Putting Power into Practice with Otter A/B
Knowing the theory is useful. Turning it into repeatable testing habits is what actually improves decisions.
The practical workflow is simple when teams stay disciplined. First, define the effect worth detecting. Next, estimate the sample required. Then launch the experiment and let it gather enough evidence before making a call.
What good execution looks like
The easiest way to stay power-aware is to separate planning from monitoring.
Before launch, the team decides:
- Which metric decides the winner
- What minimum effect matters
- How much traffic the test needs
- When the result is mature enough to act on
During the run, the team monitors implementation quality, traffic allocation, and data health, but doesn't keep changing the goalposts.
That sounds basic, yet it's where many programmes fail. The statistics are rarely the main problem. The underlying problem is operational drift. People get impatient, reinterpret the hypothesis mid-test, or stop as soon as the chart looks exciting.
Why tools help, but don't replace judgement
A platform can automate calculations, surface significance clearly, and make result-sharing easier. That removes a lot of friction. It doesn't remove the need for judgement.
Teams still need to decide whether the tested effect is meaningful, whether the metric is stable enough, and whether the experiment deserves the traffic it consumes. The platform can help you read the instrument panel. It can't decide which destination matters.
Good experimentation tools reduce manual error. Good experimentation teams reduce decision error.
That's the combination you want. Software should handle repetitive analysis cleanly. Humans should stay focused on test design, effect relevance, and business context.
Making Confident and Data-Driven Decisions
Statistical power isn't a classroom concept that marketers tolerate because analysts insist on it. It's a risk-management tool for deciding whether your experiment can teach you something.
When you plan for power, you're making a conscious trade-off. You're deciding how much uncertainty you can accept, how large an effect is worth chasing, and whether your traffic can support that ambition. That's disciplined experimentation.
When you skip power, you don't save time. You usually waste it. You run tests that feel active but can't produce clear answers, and then you ask the results to carry more certainty than they earned.
The strongest testing teams don't just launch more experiments. They launch experiments with a real chance of resolving the question at hand. That's the practical answer to what statistical power means in CRO. It's the difference between hoping your test will be informative and designing it so it can be.
If you want a lightweight way to run website experiments without turning analysis into a spreadsheet project, Otter A/B gives teams a simple workflow for testing headlines, CTAs, layouts, and other on-site changes. It's built for fast implementation, clear significance reporting, and practical decision-making, so you can spend less time wrestling with setup and more time running experiments that are worth the traffic.
Stop guessing
Ready to start testing?
Set up your first A/B test in under five minutes. No credit card required.
- 14-day free trial
- No credit card required
- Cancel anytime