Largest Contentful Paint: Boost Your SEO in 2026
Optimize your Largest Contentful Paint (LCP) for better SEO. Learn how to diagnose and fix issues to achieve a faster 2.5-second score.

Only 58% of UK websites currently pass Google's Largest Contentful Paint threshold, which means a large share of sites still fail to show their main visible content quickly enough to meet the standard for a good experience (Colorlib). That isn't just a developer metric. It sits right on the line between search visibility, user trust, and whether a visitor even stays long enough to see your offer.
For teams that care about SEO and conversion rate optimisation, largest contentful paint is one of the few performance metrics that directly maps to what users feel. They don't experience “render pipeline efficiency”. They experience a blank or half-finished page, then decide whether to wait.
The tricky part is that LCP work often gets split across silos. Marketing changes a hero, design adds a richer above-the-fold layout, product launches an experiment, and engineering inherits the performance fallout. The best results come when those teams treat LCP as shared commercial infrastructure, not a narrow front-end task.
Why Largest Contentful Paint Is a Critical Metric
Pages that load in 1 to 2 seconds tend to convert best, and 53% of mobile users leave after 3 seconds, according to Colorlib. That puts Largest Contentful Paint in commercial territory, not just technical reporting.
LCP tracks whether the part of the page doing the persuasion appears quickly enough to keep attention. On a category page that may be the lead product image. On a landing page it is often the hero, headline block, or video poster. If that element arrives late, paid clicks cost more to convert, organic traffic gets less value, and brand trust drops before the visitor has read a line.
For marketers, that shows up as weaker campaign efficiency. For developers, it usually points to a delivery issue near the top of the render path: an oversized image, render-blocking CSS, slow server response, or client-side experimentation code delaying the main content.
Practical rule: If the first screen sells the visit, its largest visible element needs to load like a priority, not an afterthought.
LCP also exposes a planning problem that many teams miss. Copy, design, SEO, and performance are tied together on the first screen. Strong page structure and best keyword usage for SEO help users and search engines understand the page, but neither helps much if the main message is still waiting on a heavy hero asset.
The same applies to broader website optimisation work. LCP directly influences both discoverability and the first meaningful impression, so it deserves attention early in roadmap discussions, not after launch.
One trade-off deserves special attention: experimentation. A/B testing often targets the exact area LCP cares about most, including hero banners, headlines, promotional media, and personalisation modules. If those tests rely on late client-side changes, teams can improve conversion on paper while making the user experience slower. Good CRO practice and good LCP practice should support each other. The test should answer the business question without delaying the element users came to see.
Mobile makes the consequences more obvious. Smaller screens give the above-the-fold region more influence, network conditions vary more, and a single large visual can dominate the viewport. When that asset is slow, the delay is impossible to hide.
Understanding What LCP Actually Measures
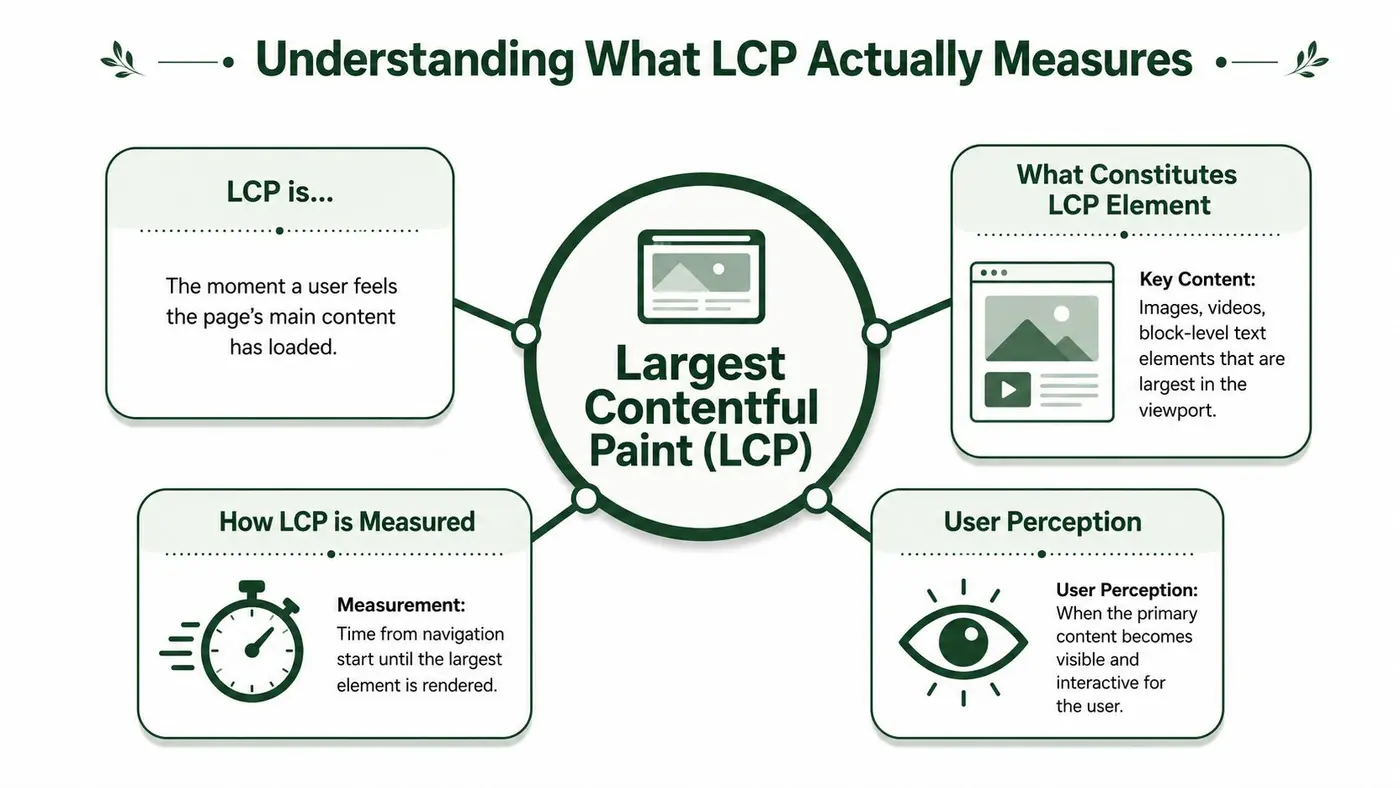
Largest Contentful Paint measures the elapsed time from page load until the largest visible element in the viewport is rendered. The easiest way to think about it is this: a shop can open the door quickly, but if the main display still isn't ready, customers don't feel that the shop is open. LCP tracks that moment of perceived readiness.
Google's threshold for a good score is under 2.5 seconds, and performance is assessed at the 75th percentile of page loads. That means at least three-quarters of user visits need to experience an LCP within that threshold for the page to pass (Cloudswitched).
What counts as the LCP element
The LCP element isn't just “the first thing that loads”. It's the largest visible content element in the viewport during the initial render window. That often includes:
- Hero images that dominate the top of the page
- Large text blocks such as a headline and introductory copy container
- Video poster images when a video area is above the fold
- Promotional media modules used on campaign landing pages
It doesn't centre on background decorations or content below the fold. It focuses on what users can see without scrolling and what most strongly shapes their impression of speed.
Why the 75th percentile matters
Teams often look at averages because they're tidy. Averages hide pain.
The 75th percentile is more useful because it forces you to optimise for typical real visits, not just your fastest sessions. If a page performs well for office Wi-Fi on a powerful laptop but drags on ordinary mobile devices, the percentile view exposes that gap.
The right question isn't “Can this page be fast?” It's “Is this page fast for most people who actually visit it?”
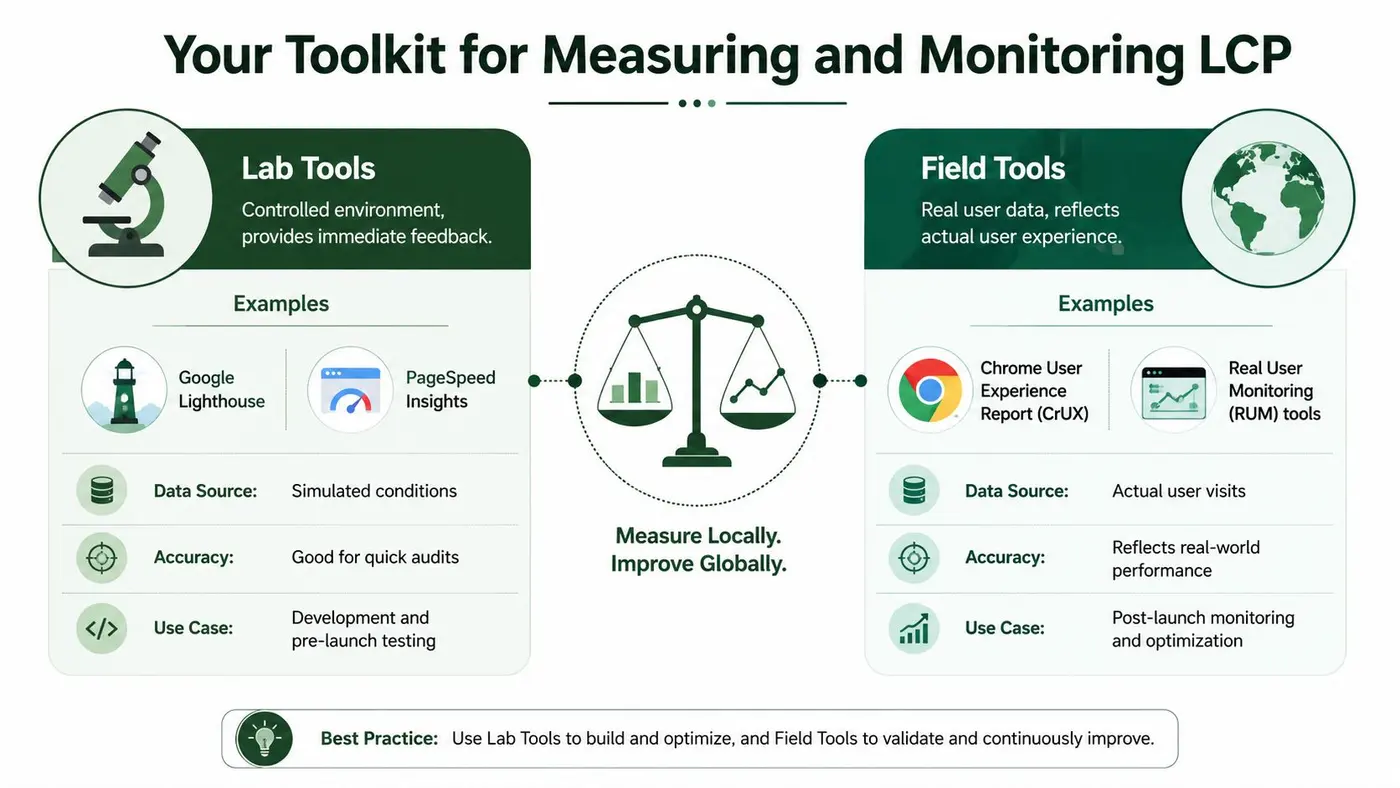
Lab data and field data serve different jobs
You need both perspectives.
| Tool view | What it tells you | Best use |
|---|---|---|
| Lab data | Simulated performance in a controlled environment | Debugging changes before release |
| Field data | What real users experience on real devices and networks | Prioritising fixes that affect business outcomes |
Lab tools are excellent for spotting render-blocking CSS, late-discovered images, and main-thread congestion. Field data tells you whether those issues are materially affecting users.
If a page shows a decent synthetic result but poor user outcomes, the answer usually sits in device mix, network variability, third-party code, or personalised content paths that synthetic tests don't reflect well.
Diagnosing and Fixing Common LCP Problems
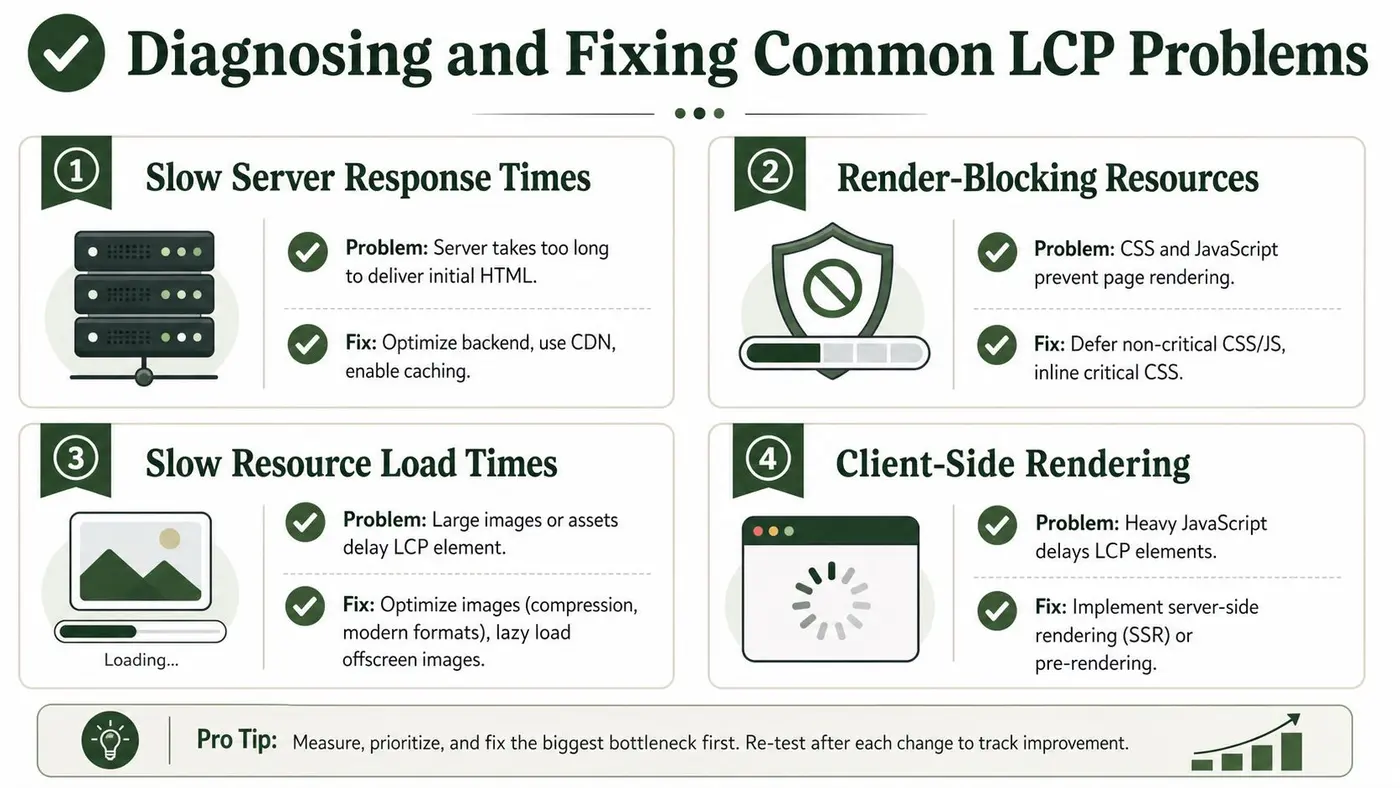
Most poor LCP scores come from a short list of causes. That's useful, because it means you can usually improve the metric without rewriting the whole site. The work is about identifying what sits on the critical path to the largest visible element, then removing anything that delays it.
A useful benchmark from HTTP Archive data is that, for most sites, the LCP element occupies 30% to 60% of the mobile viewport. If teams don't prioritise that bandwidth-heavy region by improving Time to First Byte and reducing render-blocking JavaScript, LCP degrades quickly (web.dev on LCP).
Slow server response times
If the initial HTML arrives late, everything else starts late. This is the first thing to check because no amount of image tuning can fully compensate for a slow first byte.
Look for pages where the browser spends too long waiting before it can even begin parsing the document. Common causes include overloaded application logic, cache misses, expensive personalisation at origin, or an architecture that generates too much on each request.
What tends to work:
- Page and edge caching for routes that don't need per-request assembly
- CDN delivery so critical assets and, where possible, HTML are served closer to users
- Reducing backend work on the initial request, especially for landing pages
- Separating critical and non-critical data so the visible shell can render first
What tends not to work is treating TTFB as “just a hosting issue”. Hosting can matter, but poor cache strategy and bloated request handling usually matter more.
Render-blocking CSS and JavaScript
A page can technically arrive on time and still paint late because the browser is busy waiting for stylesheets and scripts that block rendering.
Many teams sabotage themselves with marketing tags, visual widgets, consent tools, heatmaps, and experiment scripts. One extra script rarely looks dangerous in isolation. Ten of them can hold the page hostage.
Use this checklist when LCP is stuck:
- Inline critical CSS for the first viewport so the browser can paint the visible shell sooner
- Defer non-essential JavaScript that doesn't need to execute before the hero appears
- Audit third-party scripts and ask whether each one is worth its cost on first render
- Trim large CSS bundles that style components users won't see immediately
Engineering shortcut: If a script isn't needed before the hero appears, it shouldn't compete with the hero for bandwidth or main-thread time.
Later in the debugging process, a visual recording often helps teams see the issue more clearly than a score does.
The LCP asset itself is too heavy
This is often the most obvious issue and the easiest to underestimate. A beautifully art-directed hero can become the single biggest reason a landing page feels slow.
For many sites, images make up most of the page weight, so the fastest route to improvement is often to simplify and prioritise the hero asset. Practical steps include:
- Use modern formats such as WebP or AVIF when your stack supports them
- Serve appropriately sized images instead of relying on a large source asset to be scaled down in the browser
- Compress the hero thoughtfully so quality remains acceptable without wasting bytes
- Preload the true LCP image when you know what it is
The same discipline applies before assets even reach your CMS. If your content team regularly uploads oversized images from mobile devices, a simple workflow for batch resize photos on iPhone can prevent bloated uploads from becoming a recurring front-end problem.
Fonts and text rendering delays
When the LCP element is a text block, fonts often become the bottleneck. Teams chase images while ignoring the fact that a custom typeface is delaying the first meaningful paint of the headline.
The fix usually isn't “remove all custom fonts”. It's to load them more intelligently.
| Problem | Better approach |
|---|---|
| Critical text waits on font download | Preload the font resource used in the first viewport |
| Invisible text during load | Use font-display: swap so fallback text can render |
| Too many font files | Reduce weights and variants used above the fold |
Client-side rendering and late content assembly
Single-page applications and heavily hydrated pages can push the visible content behind JavaScript execution. If the browser has to download, parse, and run too much code before it can paint the main content, LCP suffers even when the network looks fine.
Server-side rendering, pre-rendering, or a lighter hydration strategy can help. The goal isn't ideological purity. It's to deliver the first visible state quickly, then enhance it.
In practice, the best fixes are often boring. Faster HTML delivery, fewer blockers, lighter hero assets, and stricter control over what gets loaded before the page becomes useful.
Your Toolkit for Measuring and Monitoring LCP
You don't need a giant observability stack to work on LCP well. You do need to choose the right tool for the question you're asking. Some tools are built for diagnosis. Others are built for trend monitoring after release.
When to use each tool
Here's the practical split teams should use:
| Tool | Best for | Who uses it most |
|---|---|---|
| PageSpeed Insights | Quick checks that combine lab and user data views | Marketers, SEOs, developers |
| Chrome DevTools | Local debugging of render blockers, waterfalls, and the LCP element | Front-end developers |
| Lighthouse | Repeatable pre-release audits in a controlled environment | Developers, QA |
| Google Search Console | Tracking site-wide Core Web Vitals health over time | SEO and product teams |
| CrUX data views | Understanding real-user performance trends | Performance teams |
| web-vitals library | Custom in-product monitoring and analytics pipelines | Engineering and analytics |
PageSpeed Insights for fast triage
PageSpeed Insights is usually the fastest starting point because it surfaces the likely LCP element and highlights obvious bottlenecks. It's especially useful when a marketer or product manager needs a shared reference point before handing the issue to engineering.
For broader reviews, a structured website audit checklist can help teams avoid treating LCP in isolation from image handling, script weight, and page template quality.
DevTools for real debugging
Chrome DevTools is where you answer the uncomfortable questions. Which resource started late. Which stylesheet blocked render. Which script monopolised the main thread. Whether the browser discovered the hero asset too late.
If your developers already keep a curated stack of front-end developer tools, DevTools and Lighthouse should sit near the top for performance work because they show both dependency timing and rendering impact.
Don't stop at the score. Inspect the waterfall, the main thread, and the actual LCP candidate. That's where the fix usually becomes obvious.
Field monitoring after launch
Post-launch monitoring matters because LCP changes when campaigns, assets, scripts, and layouts change. A page that passed before a seasonal refresh can fail after one oversized banner and two extra vendor tags.
Field data is what keeps teams honest. It reflects what users saw, not what a clean test run simulated on a fast machine.
Custom measurement for mature teams
For teams with enough engineering support, the web-vitals JavaScript library is the bridge between generic reporting and business-specific insight. It lets you collect performance data alongside experiment information, page types, templates, or device categories.
That's where LCP becomes operational rather than theoretical. You stop asking whether the site is fast in general, and start asking which pages, variants, and audiences are having a slower first experience.
Advanced LCP Optimisation Techniques
Once you've fixed the obvious bottlenecks, the next gains come from helping the browser make better prioritisation decisions. Advanced LCP work is less about broad clean-up and more about precision.
Prioritise the right resource
Browsers are good at loading pages, but they still need clear hints. If your LCP element is a hero image, make sure the browser discovers it early and understands that it matters more than less visible assets.
Useful tactics include:
- Preloading the LCP resource when it's predictable on the template
-
Using
fetchpriority="high"on the likely LCP image to push it up the queue - Avoiding indirect discovery through late JavaScript insertion or CSS background loading where a normal image element would be clearer
These changes don't replace fundamentals. They sharpen them.
Stop lazy-loading the thing users came to see
A frequent anti-pattern is lazy-loading the above-the-fold hero because a plugin or framework applies the same rule to every image. That directly conflicts with LCP.
One of the most effective interventions is disabling lazy-loading on above-the-fold images and preloading critical font resources, which can reduce LCP by 200 to 400ms by giving the browser a clearer path to the LCP candidate (Parachute Design).
That's why blanket lazy-loading often underperforms. It solves a general image-loading problem while creating a first-screen problem.
Tighten the first render path
Advanced teams also look at document streaming, partial server rendering, and reducing hydration pressure in the initial viewport. The principle is simple: send enough HTML and styling early enough that the browser can paint the visible experience without waiting for every enhancement.
A good discipline here is to rank every above-the-fold dependency into one of three buckets:
- Must load before paint
- Can load immediately after paint
- Can wait until interaction or scroll
Treat the first viewport like premium shelf space. Only critical assets deserve to be there.
When teams work this way, LCP improvements usually come from subtraction and sequencing, not from one magical trick.
Running Experiments Without Harming Your LCP Score
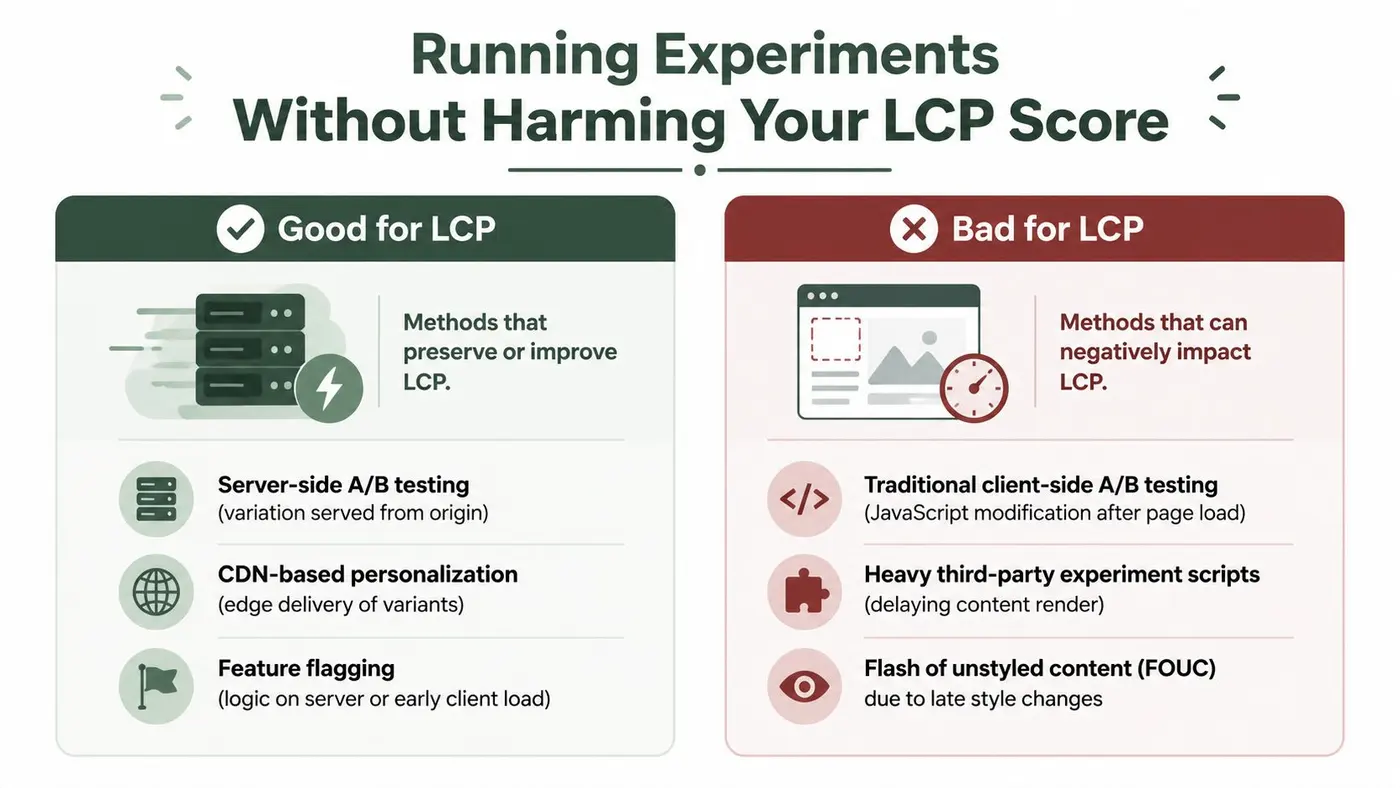
A/B testing gets blamed for poor performance because a lot of experimentation setups deserve the blame. Traditional client-side tools often inject heavy JavaScript, rewrite the page after load, and create visible flicker. That's bad for user trust and bad for largest contentful paint.
The problem isn't experimentation itself. The problem is late experimentation.
Many guides still treat LCP as if the page were static, but 22% of UK e-commerce sites now use dynamic hero content, which can inflate LCP measurements even when user experience is still strong. That makes it important to monitor performance by variant and understand how dynamic elements shape the metric (Shiftcode).
What harms LCP during testing
Client-side experimentation often hurts LCP in three ways:
- Late DOM mutation changes the hero or headline after the browser has already started rendering
- Heavy experiment SDKs compete with critical resources for bandwidth and main-thread time
- Anti-flicker treatments deliberately hide content until the experiment logic finishes
This creates a nasty trade-off. The variant may improve conversion logic while the delivery mechanism degrades the very first impression.
What works better
Teams that care about both CRO and performance usually choose one of these patterns:
| Approach | Why it's better for LCP |
|---|---|
| Server-side experiments | The user receives the chosen variant in the initial HTML |
| Edge-delivered personalisation | Variant selection happens earlier in the request path |
| Feature flags with early execution | Fewer late visual changes and less flicker risk |
If your team runs experiments on WordPress, the implementation details matter as much as the test idea. A good primer on the mechanics sits in this guide to A/B testing for WordPress, especially if you're trying to avoid visual instability on high-traffic pages.
Measure per variant, not just per page
This is the part many CRO programmes skip. They monitor conversion by variant but performance only at the page level. That hides the full impact.
A dynamic hero with personalised pricing, stock messaging, or audience-specific creative may produce a different LCP profile from the control. If you only review aggregate page performance, you can miss the fact that one variant is slower and still drawing a large share of traffic.
If a test changes above-the-fold content, it should own a performance review as well as a conversion review.
Sometimes a variant raises the formal LCP reading without making the page feel worse. Sometimes it delays useful content. The only reliable way to tell is to measure the experiment variants separately and inspect what users see.
Making Fast Experiences a Team Priority
Largest contentful paint improves when teams stop treating it as a specialist score and start treating it as part of the product. The winning pattern is simple: identify the true above-the-fold element, shorten its delivery path, remove blockers, and keep measuring after every design, content, and testing change.
Marketing owns part of this. Product owns part of it. Engineering owns part of it. No single team can protect LCP alone if someone else is shipping oversized heroes, extra scripts, or late-rendered experiments.
The fastest sites usually aren't the ones with the most elaborate optimisation playbook. They're the ones with disciplined defaults. They prioritise what appears first, challenge anything that competes with it, and review performance whenever they run changes that affect the first screen.
If you want to run experiments without dragging down Core Web Vitals, Otter A/B is built for that job. Its lightweight SDK is designed to avoid flicker and keep tests fast, so teams can compare headlines, CTAs, and layouts without turning experimentation into a performance problem.
Stop guessing
Ready to start testing?
Set up your first A/B test in under five minutes. No credit card required.
- 14-day free trial
- No credit card required
- Cancel anytime