Mastering Type 1 vs Type 2 Errors: A/B Test Success
Learn the difference between Type 1 vs Type 2 errors in A/B testing. Understand their causes, consequences, and how to manage them for reliable results.
Your latest test says the new variant won. The dashboard shows significance, the team feels vindicated, and the change goes live before the next sprint closes.
Then the commercial result doesn’t follow. Conversion rate looks flat in aggregate. Revenue doesn’t improve in the way the test suggested. Someone asks whether the experiment was wrong, and that’s the moment it becomes clear they haven’t just been running tests. They’ve been making risk decisions.
That’s what type 1 vs type 2 errors really are in practice. They’re not classroom definitions. They’re the two ways an experimentation programme can mislead a business: by shipping a false win or by dismissing a real one.
The Hidden Risks in Your A/B Testing Decisions
A common pattern in CRO looks like this. A team tests a headline, CTA, or product page layout. The result appears strong enough to call. Designers celebrate. Developers implement. The report goes into Slack. Weeks later, nobody can find the same effect in live business performance.
That isn’t always bad execution. Sometimes it’s a decision error.

In marketing experimentation, every conclusion sits on uncertainty. You never observe the full truth directly. You infer it from a sample of visitors, sessions, and conversions. If your team needs a quick refresher on what A/B testing in marketing entails, it helps to remember that the method is straightforward, but the decision-making around it is where teams get into trouble.
Where the real risk sits
A common focus is on whether a test is “significant”. Practitioners focus on what kind of mistake the team is most likely to make.
You can make two broad errors:
- Type I error: You decide the variant changed performance when it didn’t.
- Type II error: You decide the variant didn’t matter when it did.
The first one creates false momentum. The second one creates hidden stagnation.
A testing programme rarely fails because teams don’t have ideas. It fails because they trust the wrong winners and kill the right challengers.
That’s why this topic matters far beyond analytics. A false positive wastes design and engineering time, adds noise to the product, and can weaken trust in experimentation. A false negative does the opposite. It tells the business to stand still when a real improvement was available.
Why smart teams still get caught
These mistakes don’t only happen to inexperienced marketers. They happen to organised teams under pressure.
Seasonality, impatient stakeholders, short test durations, weak sample sizes, and constant dashboard checking all push teams towards bad calls. The problem isn’t that people don’t care about rigour. It’s that commercial urgency makes weak evidence feel good enough.
If you run experiments on Shopify, WooCommerce, Webflow, WordPress, or a custom front end, the practical question isn’t whether errors exist. They do. The useful question is which error you’re currently more exposed to, and what operating rules reduce that exposure without killing testing velocity.
Defining Type I and Type II Errors
A team runs a homepage test, sees a lift after three days, ships the variant, and watches conversion settle back to baseline a week later. That is the practical reason these definitions matter. In A/B testing, the statistical label maps directly to a business decision you either can trust or cannot.
Start with the null hypothesis. In an experiment, the null hypothesis is the assumption that there is no real performance difference between control and variant. The test asks whether the observed gap is strong enough to reject that default position.
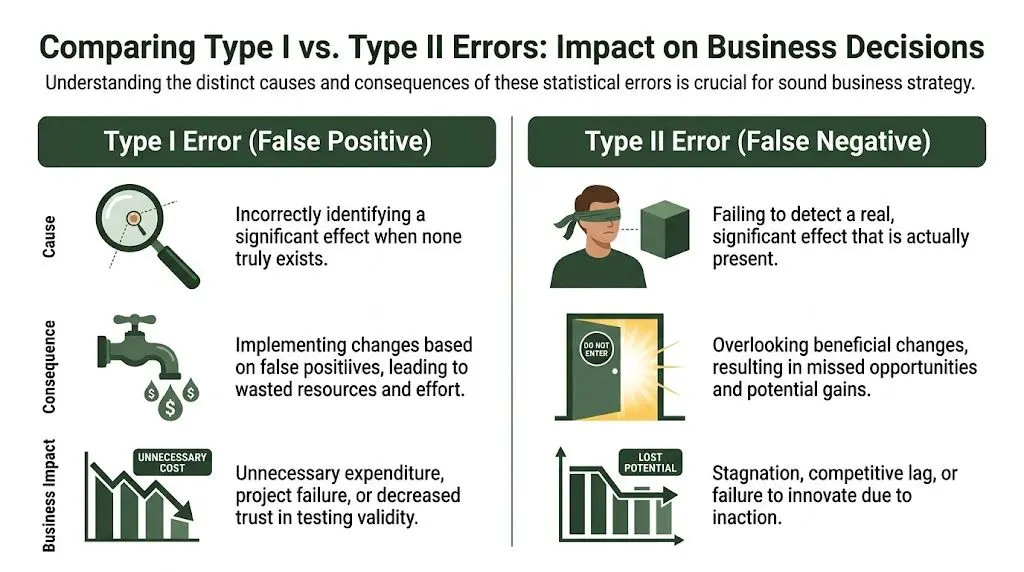
Type I error means a false win
A Type I error is a false positive. The team rejects the null hypothesis even though no real effect exists. In plain terms, you call a winner that is not better.
For a marketing or product team, this usually shows up as rollout regret. Design and engineering time go into shipping a change that looked good in the sample but adds no value in production. If you want a practical refresher on the testing basics behind that call, What Is A/B Testing? gives the broader context. For a tighter experimentation lens, Otter’s guide to what a type 1 error means in testing explains how this mistake appears in live programmes.
Teams often connect this risk to alpha, written as α. Alpha is the threshold you set for accepting the chance of a false positive. A lower alpha reduces the odds of shipping noise, but it also makes it harder to detect smaller real gains. That trade-off matters more than memorising the term.
Type II error means a missed effect
A Type II error is a false negative. The team fails to reject the null hypothesis even though a real effect exists. In plain English, the variant helped, but the test did not pick it up.
This error is quieter and often more expensive over time. The team archives a useful idea, reports that nothing worked, and leaves revenue or lead volume unrealised. In a mature testing programme, missed wins can slow growth just as much as false wins erode trust.
The easiest way to remember the difference
Use the decision itself as the memory aid:
| Reality | Your decision | Result |
|---|---|---|
| No real difference exists | You declare a winner | Type I error |
| A real difference exists | You declare no winner | Type II error |
Mental shortcut: Type I creates action from noise. Type II blocks action despite a real improvement.
That distinction is where modern experimentation tools earn their keep. A platform like Otter A/B is not just reporting significance. It helps teams set decision rules, control exposure to false wins, and avoid discarding variants that needed more evidence rather than a quick verdict.
Comparing Error Causes and Business Consequences
A team rolls out a variant after three strong-looking days. Two weeks later, conversion rate settles back to baseline, engineering time is gone, and the quarterly test report shows a win that never existed. A different team kills a promising treatment because the test never reached enough sensitivity, then spends months trying to find growth that was already sitting in the backlog.
That is the business difference between these errors. One pushes you to ship noise. The other causes you to leave gains unclaimed.
| Attribute | Type I Error (False Positive) | Type II Error (False Negative) |
|---|---|---|
| Core mistake | Declaring an effect that isn’t real | Missing an effect that is real |
| Typical team behaviour behind it | Calling tests too early, peeking, overreacting to noisy results | Running weak tests, stopping before enough data, choosing unrealistic detection thresholds |
| What happens next | Team ships a change that doesn’t deserve rollout | Team rejects a change that could have helped |
| Immediate business consequence | Wasted implementation and analysis effort | Missed learning and missed upside |
| Longer-term damage | Lower trust in testing and more clutter in the experience | Slower growth and repeated underestimation of good ideas |
What typically causes Type I errors
Type I errors usually start with decision pressure, not bad intent. The team wants a result, traffic is coming in, and interim numbers look good enough to justify action. Add repeated peeking, segment slicing after the fact, or a late change to the success metric, and the odds of a false win rise quickly.
The cost is immediate. You build, QA, launch, report, and defend a change that never had a real effect. In practice, that means wasted development capacity, weaker trust in the testing programme, and a noisier product experience because weak ideas make it into production.
What typically causes Type II errors
Type II errors come from weak test economics. The idea may be sound, but the test is set up with too little traffic, too short a run time, or a minimum detectable effect that assumes the variant needs to be dramatic before it counts.
This happens often in lower-volume programmes, long sales cycles, and B2B funnels where patience is limited. The variant is marked as "no difference," the idea goes into the archive, and the team moves on without learning whether the treatment improved the funnel.
If your team is comparing statistical approaches, the trade-off becomes easier to see through the lens of Bayesian vs frequentist testing in A/B experiments. The method changes how evidence is interpreted, but neither approach removes the commercial cost of a bad decision.
A false positive spends money on the wrong rollout. A false negative saves money in the short term, then forfeits future revenue from a change that should have shipped.
Which error hurts more
Context decides that.
On checkout, pricing, consent flows, or any high-exposure UX, a false positive is often more dangerous because a weak change can affect a large share of revenue before anyone reverses it. On merchandising, lifecycle messaging, onboarding, or iterative landing page work, false negatives can do more damage because the programme keeps overlooking small improvements that would have compounded over time.
I usually assess the trade-off with three operational questions:
- How reversible is the change? Easy reversals make Type I risk easier to tolerate.
- How constrained is traffic? Low traffic increases the chance of missing real lifts.
- How much value sits behind the metric? Missing a genuine gain at a major funnel step can cost more than trialling one false win.
What strong teams avoid
Some habits increase both risks at once:
- No pre-defined decision rule. The team improvises sample size, stopping point, or success criteria.
- Treating "not significant" as proof of no effect. The result may be inconclusive.
- Calling winners on conversion rate alone. A lift on the headline metric can still hurt margin, lead quality, or downstream sales acceptance.
Good experimentation teams do not ask which error sounds worse in theory. They decide which mistake would be more expensive in this specific test, then set up the experiment, and the tool, to control that risk. Otter A/B matters here because it gives teams a practical structure for that choice instead of forcing a one-size-fits-all significance ritual.
The Statistical Tug of War Alpha Beta and Power
A team launches a pricing test, sees an early lift, and wants to ship by Friday. The actual decision is not whether the chart looks good. It is how much risk the business is willing to accept of shipping a false win versus missing a real one.
The trade-off sits in three variables: alpha, beta, and power. Teams that skip this step usually end up arguing about confidence after the numbers arrive, which is too late. Otter A/B is useful here because it forces these choices into the test setup instead of leaving them to stakeholder pressure mid-run.
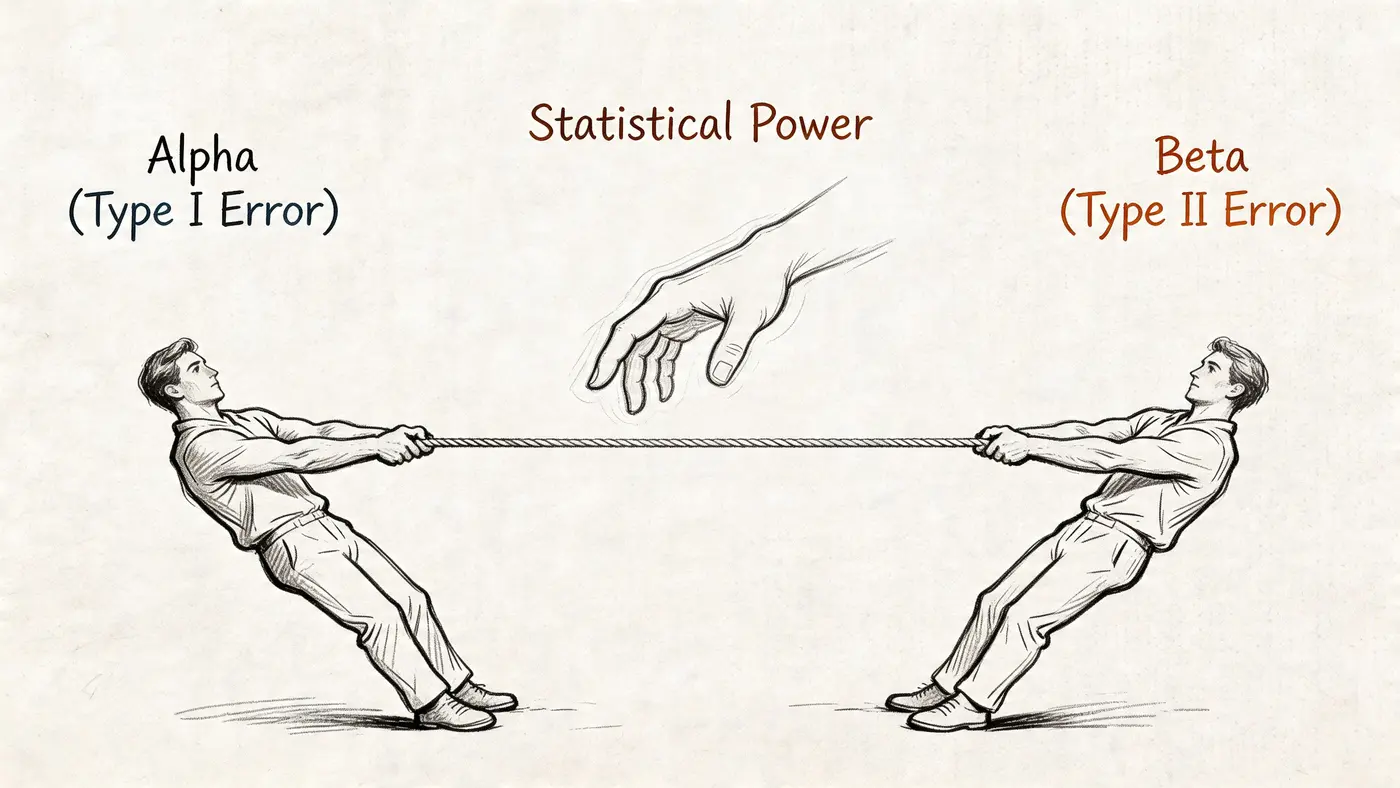
Alpha sets your false positive tolerance
Alpha (α) is the probability of making a Type I error. With a 95% confidence threshold, α = 0.05. In practice, this is the evidence bar you set before you allow a team to call a winner.
Lower alpha means stricter proof. That reduces false positives. It also makes real effects harder to detect unless you add more sample, more time, or both.
That trade-off matters in live testing. A subscription pricing test, checkout change, or major funnel intervention may justify a tighter alpha because the cost of a false win is high. A reversible creative test may not.
Beta and power determine how often you miss a real effect
Beta (β) is the probability of making a Type II error. Power is 1 - β, which is the probability that your test will detect a real effect if that effect exists.
For experiment planning, 80% power is a widely used minimum in standard statistical guidance, which implies β = 20% (Scribbr’s explanation of Type I and Type II errors and statistical power). The same source notes that, for a 5% minimum detectable effect, an experiment can require around 3,200 observations per variant to reach that power level in a simple two-group design (Scribbr’s sample size example for statistical power).
The operational point is simple. Many tests that look neutral are underpowered. They did not prove there was no effect. They failed to collect enough information to detect one.
Practical rule: If power was never checked before launch, a “no winner” result usually means “insufficient sensitivity” more often than teams want to admit.
Why the tug of war matters
You cannot reduce alpha without consequences. If you make the evidence threshold harder to meet, beta usually rises unless you compensate with a larger sample or longer run time.
That is the tug of war. Fewer false positives usually means more false negatives unless the experiment is better funded with traffic, conversions, or time. This is why strong experimentation teams treat sample size as a business input, not just a statistical detail.
If your team is debating methodology, it helps to understand the difference between Bayesian and frequentist testing. Many disagreements that sound technical are really about decision timing, evidence thresholds, and how much uncertainty the business will tolerate.
A short explainer can help anchor the trade-off before you lock a design:
What this means in live experiments
In a real testing programme, power planning is part of risk management. It determines whether a test can detect the smallest result the business would act on.
That is where modern tooling matters. Otter A/B gives teams a framework to set evidence thresholds, estimate sample requirements, and make decisions against pre-set rules instead of reacting to noisy early movement. The result is not certainty. It is better control over which mistake you are more willing to make in each experiment.
Decision Rules to Mitigate Errors in Your Experiments
Good experiment teams don’t eliminate uncertainty. They contain it with rules that hold up when stakeholders get impatient.
The strongest operating model is simple. Make the key choices before launch, document them, and refuse to renegotiate them mid-test unless the test is invalid for reasons unrelated to performance.
Rules that reduce Type I risk
If false positives are your bigger concern, discipline matters more than cleverness.
- Set alpha before launch: Don’t move the evidence threshold after seeing early numbers. That turns analysis into rationalisation.
- Commit to a stopping rule: Decide whether the test ends by sample size, time window, or a valid sequential method. Don’t just stop because the chart looks exciting.
- Limit unnecessary slicing: Segment analysis can be useful, but post-hoc digging creates stories faster than it creates truth.
- Validate the implementation: A tracking issue or uneven delivery can create apparent wins that come from instrumentation, not behaviour.
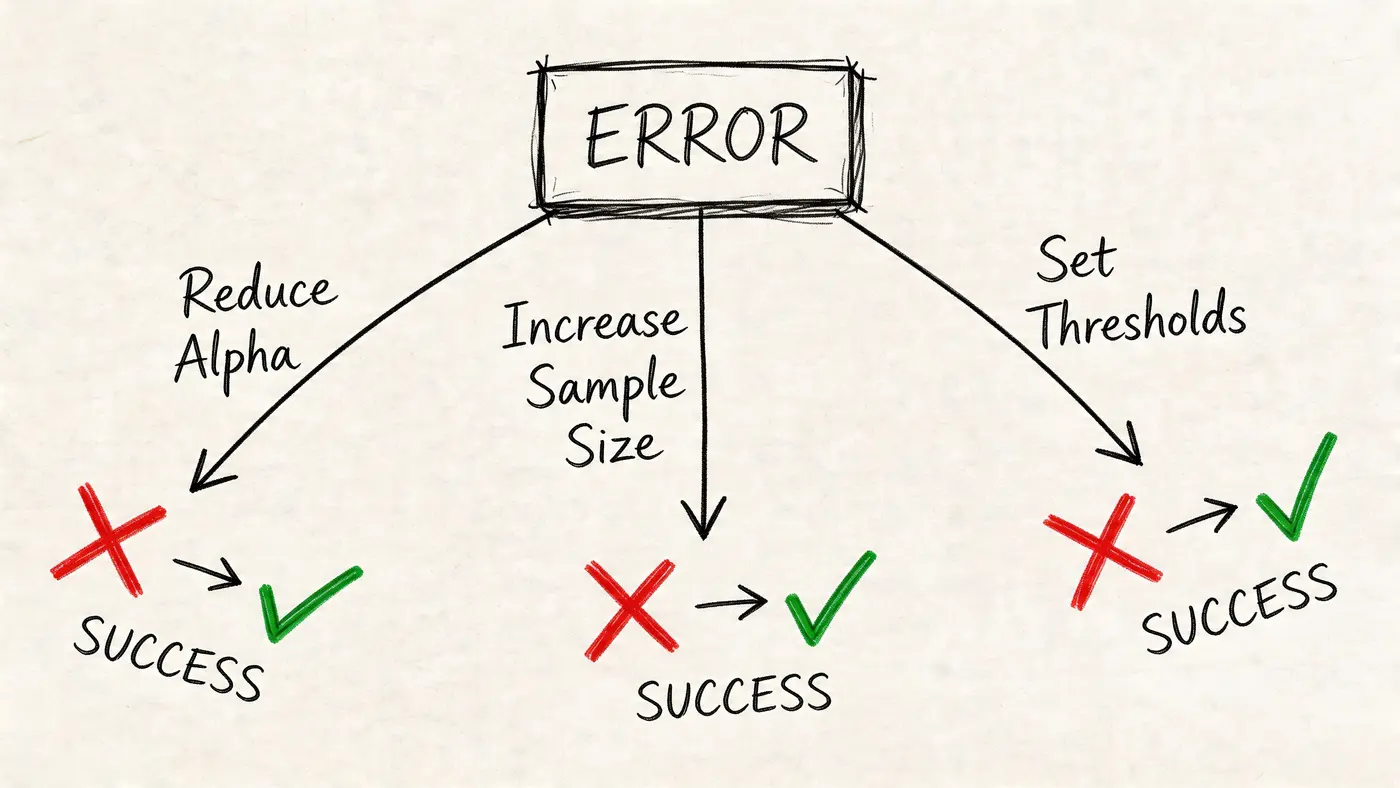
Rules that reduce Type II risk
False negatives are usually a planning failure.
- Run a power analysis first: Estimate whether the test can detect a meaningful effect at all.
- Choose a realistic minimum detectable effect: If the business cares about a subtle uplift, the test needs enough sample to see it.
- Protect runtime: Don’t shut down a test because the result looks flat halfway through. Flat is often what underpowered tests look like before enough data accumulates.
- Prioritise pages with sufficient traffic: Not every idea belongs in an A/B test. Some need qualitative validation or broader redesign work first.
A practical reference for teams reviewing methodology is Otter’s article on testing statistical significance in experiments.
A pre-launch checklist worth using
Before any A/B test goes live, answer these questions in writing:
- What is the primary metric? One main outcome beats five competing definitions of success.
- What is the minimum effect worth shipping? If the result wouldn’t matter commercially, don’t test it this way.
- How much sample is required? If traffic won’t support the design, change the plan before launch.
- When will the test stop? Write the rule down.
- What would invalidate the result? Tracking breaks, sample imbalance, or implementation errors should void the readout.
- What post-test check confirms business value? Revenue quality, downstream behaviour, or retention can matter more than a top-line lift.
A disciplined “no decision yet” is better than a confident wrong decision.
What works and what doesn’t
What works is boring. Pre-set rules. Enough sample. Clear primary metrics. Patient analysis.
What doesn’t work is also predictable. Daily peeking, changing goals after launch, overreading tiny tests, and treating every non-significant result as a dead idea. Teams don’t need more dashboards to avoid these mistakes. They need firmer operating standards.
How the Otter A/B Framework Manages Risk
A modern testing tool is most useful when it turns statistical discipline into default behaviour. That matters because most experimentation errors aren’t caused by a lack of intelligence. They’re caused by inconsistent execution.
Otter A/B gives teams a practical frame for managing the Type I versus Type II trade-off without burying them in statistical overhead. Its frequentist z-test engine uses a 95% confidence threshold, which maps to the standard false-positive tolerance many teams already use. That creates a consistent rule for deciding when evidence is strong enough to call a result.
The more important point is how that rule fits into a broader workflow. A significance readout is only one part of a trustworthy decision. Teams still need pre-calculated sample expectations, stable test design, and enough runtime to avoid underpowered calls. Otter A/B’s continuous calculation engine and Slack notifications make monitoring easier, but they’re most valuable when paired with discipline around when a test should be concluded.
Where the platform helps in practice
Two parts of the product matter especially for risk control.
First, the lightweight implementation reduces the friction that often pushes teams to compromise. The 9KB SDK, under 50ms load time, and 99.9% uptime mean tests can stay live with minimal impact on UX or site performance, based on Otter A/B’s published product details. That matters because interrupted delivery, flicker, or performance degradation can contaminate results and create confusion about whether the measured effect came from the variant or from the testing mechanism itself.
Second, Otter A/B tracks more than just top-line conversion rate. It also measures purchases, average order value, revenue per variant, and revenue trends over time, which gives teams a way to sanity-check a “statistical win” against actual commercial outcomes. That’s how mature programmes catch false confidence. A result can clear a significance threshold and still fail the business sniff test if downstream value doesn’t hold up.
Why this framework is useful
The platform doesn’t remove the need for judgement. It supports better judgement by giving teams a stable default structure:
- A clear confidence threshold for false-positive control
- Continuous significance calculation so teams can monitor responsibly
- Low-overhead delivery so experiments can run long enough to gather meaningful evidence
- Business-metric tracking so “winner” means more than a lift on a single dashboard card
That combination is what organizations require. Not more statistical jargon. Better guardrails around decisions that carry revenue, UX, and resource consequences.
If you want an A/B testing setup that helps your team manage statistical risk without slowing down execution, Otter A/B is built for exactly that. It gives you a lightweight testing framework, clear significance reporting, revenue-aware measurement, and easy rollout across platforms like Shopify, Webflow, WordPress, WooCommerce, and Next.js, so you can make decisions with more confidence and less noise.
Ready to start testing?
Set up your first A/B test in under 5 minutes. No credit card required.