Ab Test Tool
Discover how to choose the best ab test tool for your website. Learn core features, implementation pitfalls, and how Otter A/B ensures fast, reliable

Your analytics dashboard says the new checkout headline is winning. Click-through rate is up, more visitors are reaching payment, and the experiment platform has marked the variation as significant. Then finance checks revenue, and the result points the other way. Mobile orders are down, average basket value has softened, and support tickets mention confusing delivery information.
That situation is common because a basic split test answers a narrow question, not necessarily the commercial one. A serious A/B test tool must show whether a change creates more valuable orders, while proving that the testing script itself hasn't slowed the experience. For UK ecommerce teams, that means combining statistical discipline, device-level analysis, Core Web Vitals monitoring, and delivery-aware revenue metrics.
Why Your Current Testing Approach Is Costing You Revenue
A retailer can run a perfectly tidy experiment and still make a poor decision. Suppose the team changes the checkout call to action, allocates traffic evenly, and watches clicks rise. If the variant loads late on mobile, hides delivery costs until the final step, or attracts orders with lower value, the apparent win may be a loss disguised by a convenient primary metric.
The commercial context is too large to ignore. The Office for National Statistics Digital Economy Survey reported that UK non-financial businesses generated £459.2 billion in website sales in 2021, with retail showing the highest measured proportion of businesses making website sales, at 34.5%. In a market of that scale, a small change in conversion, checkout completion, or order value can affect substantial revenue.
The dashboard is not the business
The first failure usually comes from treating click-through rate as the outcome. Clicks can explain whether a message attracted attention, but they don't tell you whether shoppers completed payment, selected a profitable delivery option, returned the product, or bought again.
The second failure comes from stopping when the platform displays a significance label. A result can be statistically persuasive while being commercially unhelpful. Statistical confidence reduces uncertainty about the observed comparison. It doesn't decide whether the change is worth shipping.
Practical rule: Define the business decision before launching the test. Choose a primary metric, revenue guardrails, device segments, and a stopping rule in advance.
Online retail remains a substantial part of UK demand. ONS reported that online sales represented 27.8% of retail sales in June 2025, and 28.3% in December 2025, based on its retail sales reporting for those periods (June 2025 retail sales data). That makes experimentation an operational discipline, not a cosmetic exercise.
A useful tool therefore has to connect exposure to transactions, preserve the control experience, and make revenue per visitor visible beside conversion rate. Anything less encourages teams to optimise the easiest number to move rather than the result the business needs.
Core Features of a Professional A/B Test Tool
A professional platform isn't just a visual editor with a green “winner” badge. Evaluate it against six connected capabilities. Each one protects a different part of the decision process.
1. Experiment design and traffic control
Start with the test builder. It should support visual changes to copy, styles, layouts, and visibility, alongside split URL experiments for complete page alternatives. A marketer may need to test a product-page hierarchy without engineering support, while a developer may need to route visitors between separate implementations.
Traffic allocation must be explicit. Look for randomisation, controlled ramp-up, audience exclusions, and clear records of which visitor saw which variant. If overlapping experiments expose the same visitor to conflicting changes, the platform should make that collision visible rather than leaving analysts to discover it later.
2. Statistical safeguards
A credible engine should report confidence intervals, sample-ratio problems, and the chosen testing method in language your team can audit. A frequentist approach can work well when the team defines the horizon and avoids repeatedly checking results until a favourable label appears. The important point isn't the model's branding. It's whether the workflow prevents premature decisions.
For a frequentist 95% significance rule, don't stop after a temporary uplift. Require enough observations for both conversion and revenue, and treat secondary metrics as context rather than a licence to keep searching for a favourable outcome.
3. Goal and revenue tracking
Track a hierarchy of metrics:
- Primary outcome: The decision metric, such as completed purchase or qualified lead.
- Diagnostic measures: Clicks, checkout starts, form completion, and page progression.
- Commercial guardrails: Revenue per visitor, average order value, refunds, and delivery-option selection.
- Technical guardrails: Largest Contentful Paint, Interaction to Next Paint, and Cumulative Layout Shift.
These metrics let the team ask not only whether a variant converted, but why it moved and what it damaged.
4. Segmentation and integrations
Device, new versus returning customer, product category, traffic source, and delivery choice can change the meaning of an aggregate result. A platform should preserve those dimensions after randomisation and connect with analytics, ecommerce events, data layers, and reporting workflows.
The tool should also offer an API, webhooks, or a developer-friendly SDK. That connection matters when the order system contains the margin or refund information that the front-end event doesn't know.
5. Version control and operational transparency
Every experiment needs an owner, hypothesis, start condition, target audience, variant definition, and decision record. Version history helps teams distinguish a planned change from an emergency edit that contaminated the test. Kill switches and rollback controls matter when a variant creates a serious customer or performance problem.
6. Reporting that people can act on
A report should show allocation, exposure, uncertainty, primary results, guardrails, and segment breakdowns without forcing stakeholders to reconstruct the analysis in spreadsheets. It should also preserve the raw event trail so analysts can investigate anomalies.
For broader guidance on turning testing into a practical commercial programme, actionable B2B conversion advice is a useful complement to platform-level feature comparisons. You can also review the Otter A/B features when mapping these requirements to a lightweight workflow.
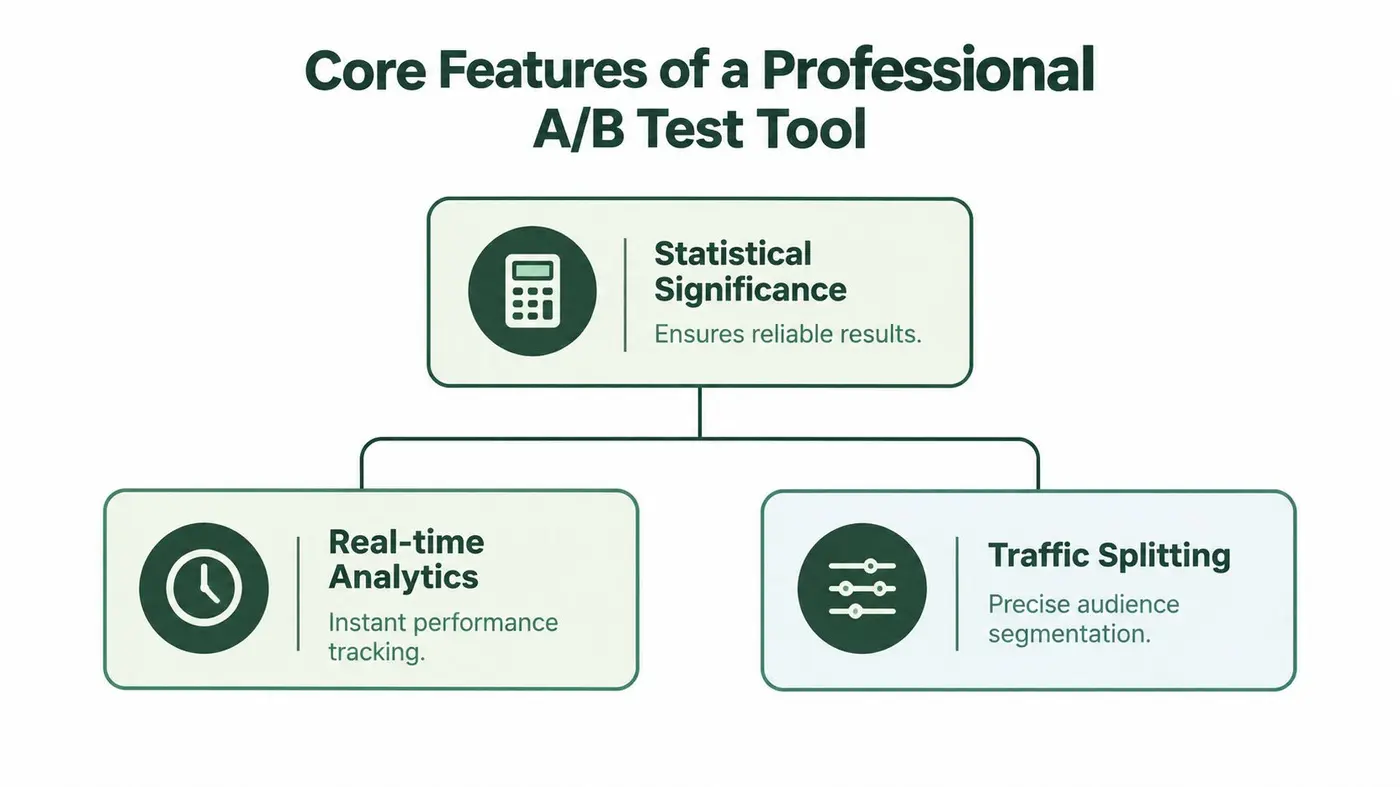
A short walkthrough can help non-specialists understand how traffic splitting and significance reporting fit together.
The Hidden Risk, Platform Performance and User Experience
Your testing platform is part of the page experience. If its JavaScript delays content, causes a layout shift, or paints the wrong variation before correcting itself, the experiment introduces a new variable. The result no longer measures only the headline, layout, or offer.
UK performance evidence makes that risk commercially important. UK-specific search reporting indicates that mobile pages are more likely than desktop pages to have poor Largest Contentful Paint, while Google's “good” threshold for LCP is 2.5 seconds or less, as documented in this UK Core Web Vitals analysis. A heavy client-side SDK can make the weaker device segment worse, precisely where the commercial consequences are already more severe.
How the SDK contaminates an experiment
A common implementation loads the testing script synchronously, waits for a decision, and then changes visible content. That sequence can produce a flash of the control, a late swap to the treatment, or a blank region while the browser waits. Visitors may react to the delay rather than the tested experience.
The safer pattern is asynchronous delivery with a small client payload, early variant application where practical, and monitoring that compares control and treatment performance. “Zero flicker” should be treated as a claim to validate in real-user monitoring, not a phrase to accept in a sales presentation.
Measure these alongside the commercial outcome:
- LCP: Does the main content appear promptly for each variant?
- INP: Does the page respond quickly when a shopper interacts?
- CLS: Does content stay stable while the experiment loads?
- Revenue per visitor: Did the experience create value after accounting for traffic quality?
- Device split: Did mobile and desktop respond differently?
A conversion lift isn't a clean win if the experiment creates a slower page and the lift disappears outside the test environment.
The risk isn't limited to speed scores. Third-party tags, widgets, tag managers, and variant logic can compete for browser resources, create long tasks, and shift elements. UK speed reporting has highlighted the scale of slow-loading pages, including approximately 98% failing Google's load-time standard and average main-content loading around 12 to 14 seconds, compared with the 2.5-second LCP threshold, according to UK ecommerce speed research.
A performance acceptance test
Run the control and every treatment through real-user monitoring. Compare Core Web Vitals by device and connection quality, then set a guardrail that blocks adoption when latency or layout stability worsens materially. Don't rely solely on a synthetic desktop audit, because it can hide the mobile degradation that changes the business result.
The performance monitoring approach from Otter A/B is relevant here because monitoring belongs inside the experiment review, not in a separate technical report that arrives after the commercial decision.
Beyond Conversion Rates, Measuring Profitable Customers
Conversion rate is useful, but it isn't the finish line. A variant that produces more orders can still reduce contribution if it attracts low-value baskets, increases refunds, or encourages delivery choices that cost more to fulfil.
The UK checkout evidence is uncomfortable. A Leeds Beckett University Retail Institute study found that approximately 74% of UK online baskets were abandoned in late 2024, compared with 67% on computers and 76% on mobile devices, with recovery rates below 5% (checkout abandonment study). That difference makes device-level analysis essential. It also means checkout tests should measure completed purchases, not only checkout starts or button engagement.
Test the promise, not just the button
Delivery and returns are part of conversion design. UK shoppers can abandon when their preferred delivery option isn't available, and the same applies when the returns process fails to meet expectations. The DHL UK ecommerce trends report reports that 80% would abandon when their preferred delivery option is unavailable, while 75% would leave when returns expectations aren't met. The same source reports that 69% have returned an item bought online.
Those findings change the testing question. Instead of asking, “Which checkout gets more orders?”, ask:
- Does the variant increase revenue per visitor?
- Does it protect or improve average order value?
- Which delivery option does each group select?
- Does the change affect refund or return behaviour?
- Does performance differ between new and returning customers?
- Does the result hold across product categories and devices?
A delivery badge that lifts completed payment but attracts unprofitable shipping choices may be a false winner. Likewise, an aggressive discount message can improve conversion while weakening margin.
Build a metric hierarchy
Set one primary decision metric, then define diagnostics and guardrails before exposure begins. For an ecommerce checkout test, completed purchase might be primary, revenue per visitor a commercial guardrail, and average order value a diagnostic. Refund rate and delivery-option selection can reveal downstream costs that the initial dashboard misses.
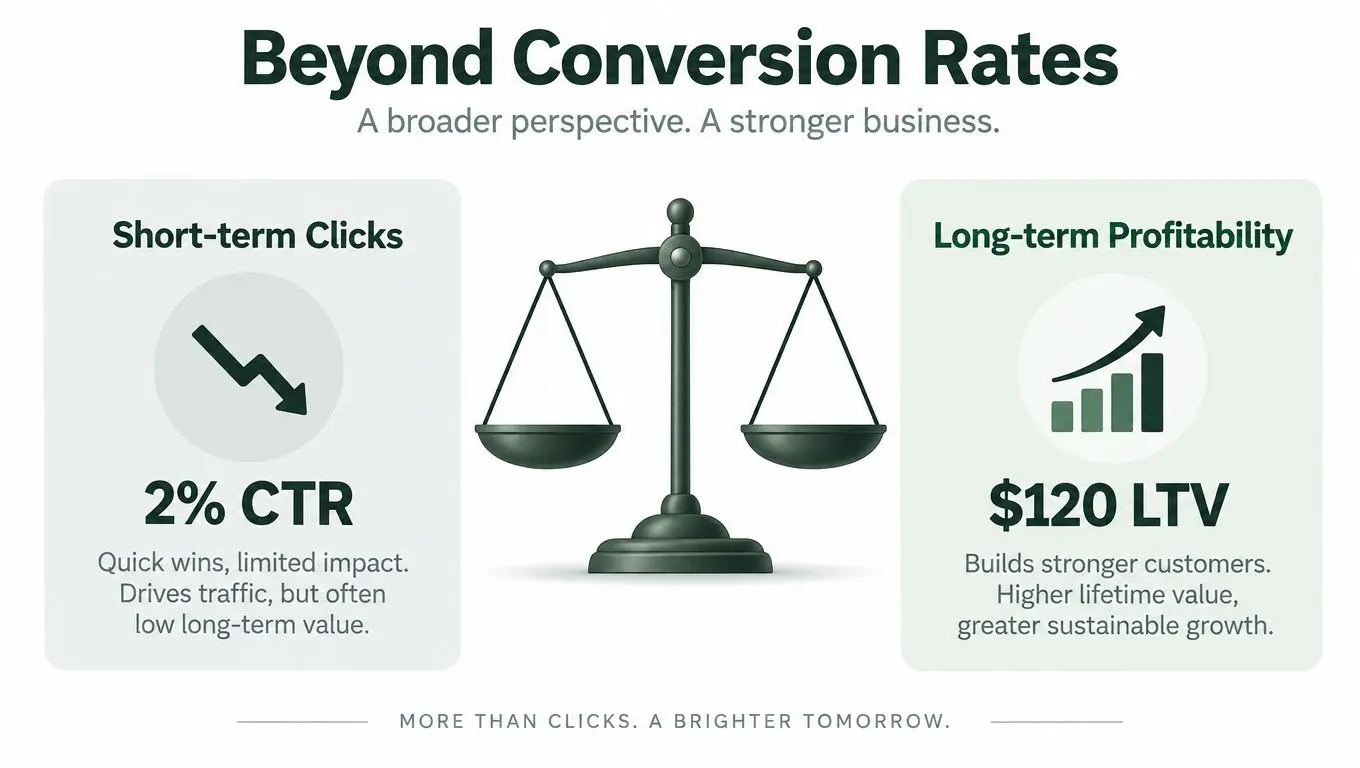
Don't bury these measures in a later finance report. Put them in the experiment brief, send them into the same analysis layer, and keep the raw order identifier available for reconciliation. A revenue-focused view doesn't eliminate conversion rate. It gives conversion rate the commercial context it lacks.
For a quick way to model the effect of order value and visitor outcomes, teams can use the revenue impact calculator as part of their pre-test planning. The calculation won't replace an experiment, but it can expose which outcome matters before traffic is allocated.
How Otter A/B Addresses Modern Experimentation Needs
Tool selection becomes clearer when you compare architecture, measurement, and workflow rather than counting features. Enterprise suites may offer broad personalisation and behavioural analytics, while lightweight platforms can reduce implementation overhead for teams focused on web experiments. The right choice depends on whether the platform protects the page while producing evidence the business can use.
Otter A/B is one option for teams that need visual and split URL testing across website experiences. Its publisher documentation states that the SDK is 9KB, loads in under 50ms, and uses a zero-flicker approach, with 99.9% uptime. Those are implementation claims to validate against your own site, devices, tag stack, and monitoring setup before adoption.
What the workflow covers
The platform supports unlimited variants, controlled traffic allocation, goal definition, and a frequentist z-test engine using a 95% confidence threshold. Its reporting includes purchases, average order value, revenue per variant, and revenue trends, which creates a more useful starting point than a dashboard centred on clicks alone.
The integration list includes Shopify, WordPress, Webflow, Wix, WooCommerce, ClickFunnels, Squarespace, Framer, Next.js, Google Tag Manager, and custom JavaScript. Slack notifications can surface significance milestones, while brandable, password-protected reports help agencies and internal teams share results without rebuilding the analysis manually.

Where the trade-off sits
A lightweight tool won't automatically solve weak hypotheses, overlapping audiences, poor event quality, or an invalid stopping rule. A broad enterprise platform may provide more governance and data integrations, but it can also demand heavier implementation and more specialist ownership. The sensible comparison is between the work your team needs and the technical debt each platform introduces.
Before rollout, test the SDK in production-like conditions. Check for flicker, blocked rendering, layout movement, consent behaviour, event duplication, and differences between mobile and desktop. Then run a control validation to confirm that adding the platform doesn't alter the baseline experience.
The strongest setup is not the one with the longest feature list. It's the one that lets marketers launch responsibly, lets engineers inspect what runs in the browser, and lets finance see whether the resulting customers create value.
Essential Checklist for Choosing Your A/B Test Tool
Use this matrix during procurement and technical review. The minimum column filters out unsafe options. The ideal column identifies a platform that can support a mature experimentation programme.
| Feature | Minimum Requirement | Ideal Standard |
|---|---|---|
| Statistical method | Transparent confidence calculation and stopping guidance | Frequentist or Bayesian model with uncertainty, SRM checks, and documented safeguards |
| Traffic splitting | Random allocation with recorded exposure | Controlled ramp-up, exclusions, stratification, and overlap detection |
| Metrics | Conversion and event tracking | Purchases, revenue per visitor, average order value, refunds, and technical guardrails |
| SDK performance | Asynchronous loading with no visible disruption | Small payload, no flicker, early variant delivery, and real-user performance comparison |
| Segmentation | Device and audience breakdowns | Device, product, delivery choice, customer status, source, and reusable audiences |
| Integrations | Ecommerce and analytics connection | APIs, webhooks, data-layer events, warehouse access, and reporting exports |
| Governance | Experiment owner and basic history | Version control, approvals, rollback, kill switch, and decision archive |
| Reporting | Shareable result summary | Stakeholder reports with primary, diagnostic, commercial, and performance outcomes |
| Support | Documentation and implementation help | Responsive technical guidance, onboarding, and experiment design support |
Ask vendors to demonstrate failure handling, not just campaign creation. Show me what happens when a browser blocks a script, when the event fires twice, when traffic allocation drifts, and when a treatment improves conversion while damaging LCP. Those answers reveal more than a polished editor.
Also price the operational burden. A low subscription cost can become expensive if every experiment needs engineering intervention, manual reconciliation, or emergency rollback. Your evaluation should include analyst time, developer time, performance monitoring, and the cost of making a wrong decision.
Conclusion, Making Smarter Data-Driven Decisions
An A/B test tool should help you make a defensible commercial decision, not merely produce a statistically attractive screenshot. That requires a clean experiment design, a transparent significance method, reliable event capture, and reporting that connects completed purchases with revenue and order quality.
UK ecommerce teams also need to treat performance as part of the result. Mobile abandonment is higher than computer abandonment in the Leeds Beckett evidence, and online retail represents a substantial share of the market. A tool that slows the page can distort the experiment and damage the experience it was meant to improve.
Choose a platform that your marketers can operate, your engineers can inspect, and your finance team can trust. Start with controlled tests, define guardrails before launch, analyse mobile separately, and reject any “winner” that depends on weaker page performance or poorer customer economics.
The practical standard is simple: statistical confidence, performance safety, and profitable conversion must agree. If they don't, the test has generated information, not a release decision.
Otter A/B offers lightweight experimentation, traffic splitting, statistical reporting, and revenue-oriented metrics for teams testing website experiences. Visit Otter A/B to assess whether its workflow fits your UK ecommerce stack and performance requirements.
Stop guessing
Ready to start testing?
Set up your first A/B test in under five minutes. No credit card required.
- 14-day free trial
- No credit card required
- Cancel anytime