Managing Product Life Cycle: A Strategic Guide
Master managing product life cycle stages with actionable frameworks, key metrics, and real-world SaaS and e-commerce examples to drive sustainable growth.
The most popular product life cycle advice is also the least useful: launch the product, promote it through growth, optimise it at maturity, then retire it when sales decline. That model describes a curve, but it doesn't help a team decide what to measure, which data to trust, how much technical debt to accept, or when a feature deserves investment.
Managing product life cycle is an operating discipline. Product managers, engineers, marketers, operations teams, and compliance leaders need a shared view of how the product is behaving, which assumptions remain valid, and what evidence justifies the next decision. In SaaS, that means connecting usage, retention, releases, experimentation, and support signals. In e-commerce, it also means managing stock, supplier information, product content, returns, and end-of-life inventory.
The UK's own statistical infrastructure offers a useful analogy. The Office for National Statistics framework for economic measurement tracks activity through staged collection, validation, estimation, and revision rather than relying on one snapshot. Product teams need the same discipline. A lifecycle is a sequence of updated judgements, not a label applied once during a quarterly review.
Rethinking the Traditional Product Life Cycle
The traditional model assumes that marketing determines a product's fate. Awareness creates demand, sales rise, the market becomes crowded, and eventual decline follows. That's a reasonable description of market behaviour, but it's a poor management system because it treats the product as if it were separate from the organisation operating it.
A product can have strong demand and still become difficult to sell, support, or change. Fragmented customer data can prevent teams from identifying valuable use cases. A brittle release process can make a small improvement risky. Technical debt can turn an apparently simple pricing or onboarding experiment into a cross-team project. A catalogue may continue generating orders while inaccurate specifications create returns, support costs, and compliance exposure.
Practical rule: Don't ask only whether the product is growing. Ask whether the organisation can still learn and change it safely.
Replace the curve with a feedback loop
Each stage should generate evidence for the next decision. Early usage tests the problem and proposition. Growth tests whether the experience can serve a broader audience. Maturity tests whether the product can defend its value while becoming more efficient. Decline tests whether the organisation should simplify, reposition, migrate customers, or stop investing.
That makes data governance central. Someone must define the source of truth for product attributes, customer events, versions, experiments, requirements, and approval decisions. The record also needs an owner, a retention rule, and a clear relationship to the product release or customer interaction it describes.
The UK is moving towards a more explicit lifecycle view in physical products as well. In its consultation on low-carbon industrial products, the government describes Environmental Product Declarations as independently verified reports based on life cycle analysis. The proposed framework considers emissions across manufacture, use, and disposal, while the initial implementation focus is embodied-emissions guidance for steel, cement, and concrete. The UK government's low-carbon industrial products consultation also proposes product-specific, third-party verified EPDs based on Product Category Rules.
That direction matters beyond sustainability teams. It shows that product data increasingly has to remain comparable, auditable, and useful beyond the point of sale. Teams that manage lifecycle information as an operational asset will make better decisions than teams that treat it as campaign copy or a spreadsheet maintained by one department.
The operational test
A practical lifecycle review should answer four questions:
- What changed: Which user behaviour, cost, regulatory requirement, or supply-chain condition has moved?
- What can we prove: Which metrics and records support that conclusion?
- What can we change safely: Can the team release, test, substitute, or retire without losing control?
- What happens next: Is the right response investment, optimisation, repositioning, or exit?
This is why products often fail after apparently successful launches. Marketing can create attention, but it can't repair poor event instrumentation, unclear ownership, unsafe release practices, or an unmaintainable architecture. Lifecycle management begins when the organisation treats every stage as a learning system.
The Five Stages of Product Evolution
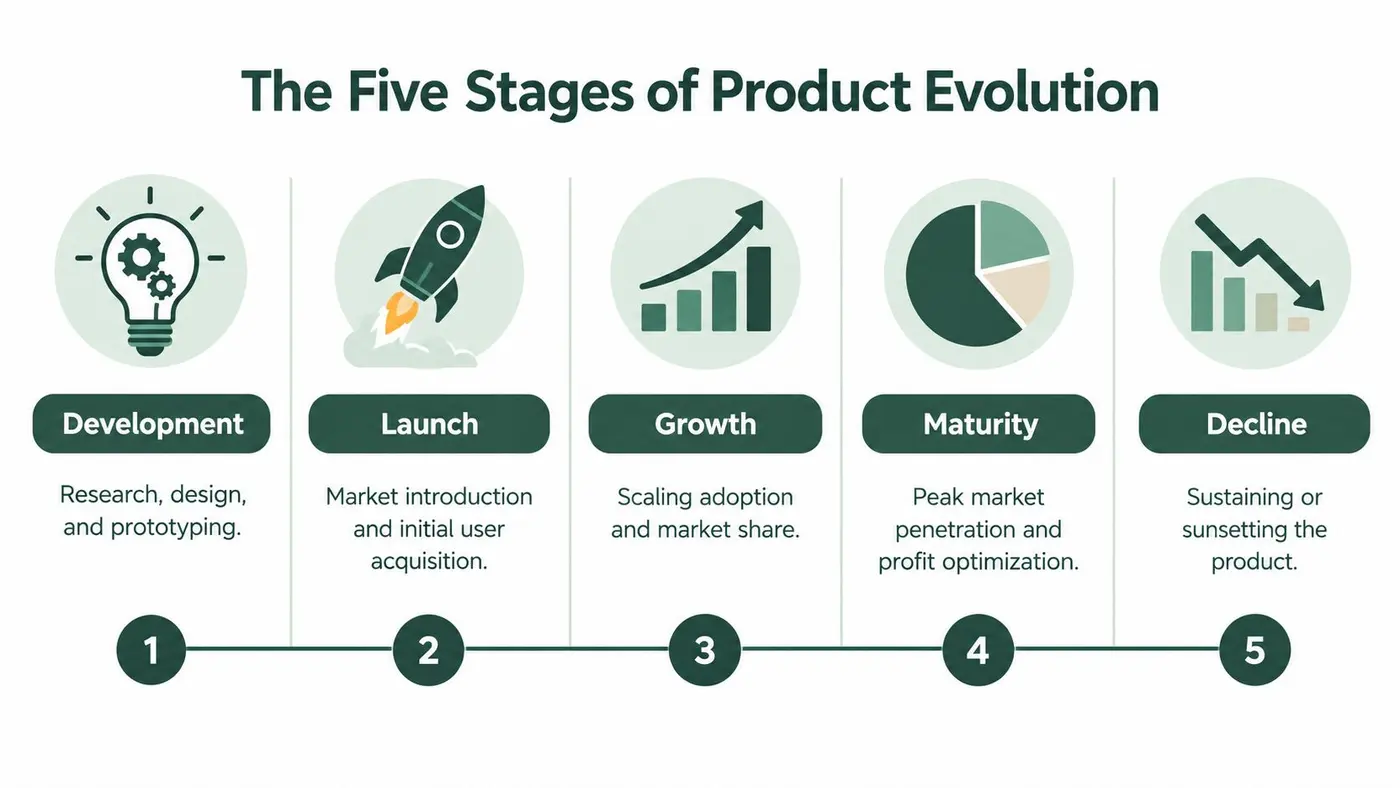
The five-stage model is useful when it describes operating conditions rather than predicting a neat sales curve. Development, launch, growth, maturity, and decline each demand a different allocation of people, evidence, and risk tolerance.
Development
Development is where the team turns a problem hypothesis into something testable. The output isn't a feature or a manufactured item; it's a set of validated assumptions about the customer, the job to be done, the delivery model, the cost base, and the constraints that could prevent adoption.
Keep the roadmap deliberately flexible. Research, prototypes, technical spikes, service design, and small tests should answer the highest-risk questions first. A polished backlog can create false confidence if nobody has tested whether customers recognise the problem or whether the proposed solution fits their workflow.
The transition to launch occurs when the team can support real usage and has defined what it needs to learn from early customers. That includes instrumentation, support routes, release ownership, pricing logic, and a clear incident process.
Launch
Launch is not the finish line. It's the first controlled exposure to market conditions that internal testing can't reproduce. The team should watch whether users understand the proposition, reach the intended first value, return, and complete the core action without assistance.
A useful launch plan separates learning objectives from promotional activity. A campaign may increase traffic, but it won't prove that the product solves the intended problem. Product, marketing, sales, and support should agree on the signals that would justify wider distribution.
Teams preparing a coordinated release can use these product launch strategies as a practical reference, particularly when launch messaging, readiness, and post-launch learning need to work together.
Growth
Growth begins when demand is repeatable enough to expose the next constraint. That constraint may be onboarding, reliability, fulfilment capacity, customer education, pricing, or the product's ability to serve needs beyond early adopters.
The internal milestone is not more sign-ups. It's evidence that the organisation can acquire and support customers without allowing quality to deteriorate. Strengthen the operating model before adding complexity. Standardise the release process, improve observability, document recurring support issues, and protect the core experience from feature requests that don't support the product's central value.
Maturity
Maturity appears when the product has an established customer base and the main challenge shifts from proving demand to defending relevance and efficiency. Market saturation may contribute, but a temporary dip caused by seasonality, a pricing change, or an incident isn't enough to diagnose maturity.
Look for persistent patterns: slower acquisition despite stable distribution, declining engagement in core workflows, longer sales cycles, rising service burden, or growing resistance to change from existing customers. Mature products need investment in reliability, usability, compatibility, and carefully chosen extensions. They don't need indiscriminate feature volume.
Decline
Decline is a strategic condition, not a moral verdict. The product may still serve a valuable niche, generate cash, or support customers who can't migrate quickly. The decision is whether its future value justifies continued investment and operational risk.
A responsible decline plan defines the service level, maintenance boundary, migration path, communications, data access, and final sunset criteria. Some products should be simplified and sustained. Others should be repositioned. The worst option is usually passive neglect, where customers discover the end of life through deteriorating support and unreliable updates.
Strategic Metrics and Levers for Every Phase
A metric becomes useful only when it changes a decision. Raw traffic can help a launch team understand reach, but it says little about product value. Sign-ups can indicate interest, yet they don't show whether users activate, return, pay, or recommend the product. Mature teams need to connect behavioural signals with commercial and operational outcomes.
The UK PLM market estimate values the market at about US$1.876 billion in 2026 and forecasts US$2.685 billion by 2031, an implied 7.4% CAGR. This is a market projection, not proof that every company needs a large PLM platform. It does indicate why organisations are investing in systems that connect design, manufacturing, compliance, and service information.
Match the measurement system to the stage
| Life Cycle Stage | Primary Focus | Key Metrics to Track |
|---|---|---|
| Development | Problem and solution validation | Research evidence, prototype task completion, qualitative objections, technical feasibility, cost assumptions |
| Launch | First value and learning quality | Activation, core action completion, support themes, experiment results, early retention signals |
| Growth | Repeatable adoption and operational scale | Retention, expansion, conversion by segment, onboarding completion, reliability, support volume |
| Maturity | Efficiency and defensible value | Net revenue retention, customer acquisition cost payback, contribution margin, feature adoption, incident rate |
| Decline | Value preservation and controlled exit | Remaining usage, support cost, migration progress, renewal patterns, defect exposure, end-of-life readiness |
The table is a starting point, not a universal dashboard. A subscription product may prioritise feature adoption and expansion, while a physical product may need sell-through, stock age, return reasons, supplier lead time, and margin by variant. The important question is whether the metric reflects the current constraint.
Use levers, not dashboards
In development, the main lever is scope control. Remove work that doesn't answer a high-risk question. During launch, the lever is learning speed, supported by clean event definitions and direct customer feedback. During growth, the lever becomes repeatability, which usually requires stronger onboarding, release governance, support processes, and performance discipline.
Maturity demands sharper trade-offs. If retention is healthy but acquisition is expensive, improve positioning, channel quality, or onboarding before adding another major capability. If expansion is strong but reliability is weakening, invest in the platform rather than celebrating the revenue signal. A product leader's job is to prevent one positive metric from hiding a structural problem.
For a broader approach to selecting and interpreting business measures, this guide to understanding KPIs is useful. The practical test remains simple: every important metric should have an owner, a decision threshold, and a documented action when it moves.
Audit the stack before changing the strategy
Check whether product, marketing, sales, finance, support, and operations use the same definitions. Confirm that events survive releases, product versions are identifiable, customer segments are meaningful, and historical data can be reconciled after a tracking change.
A dashboard that cannot explain why a metric moved is decoration. Lifecycle management needs traceable evidence, not a larger collection of charts.
Frameworks for Managing Stage Transitions
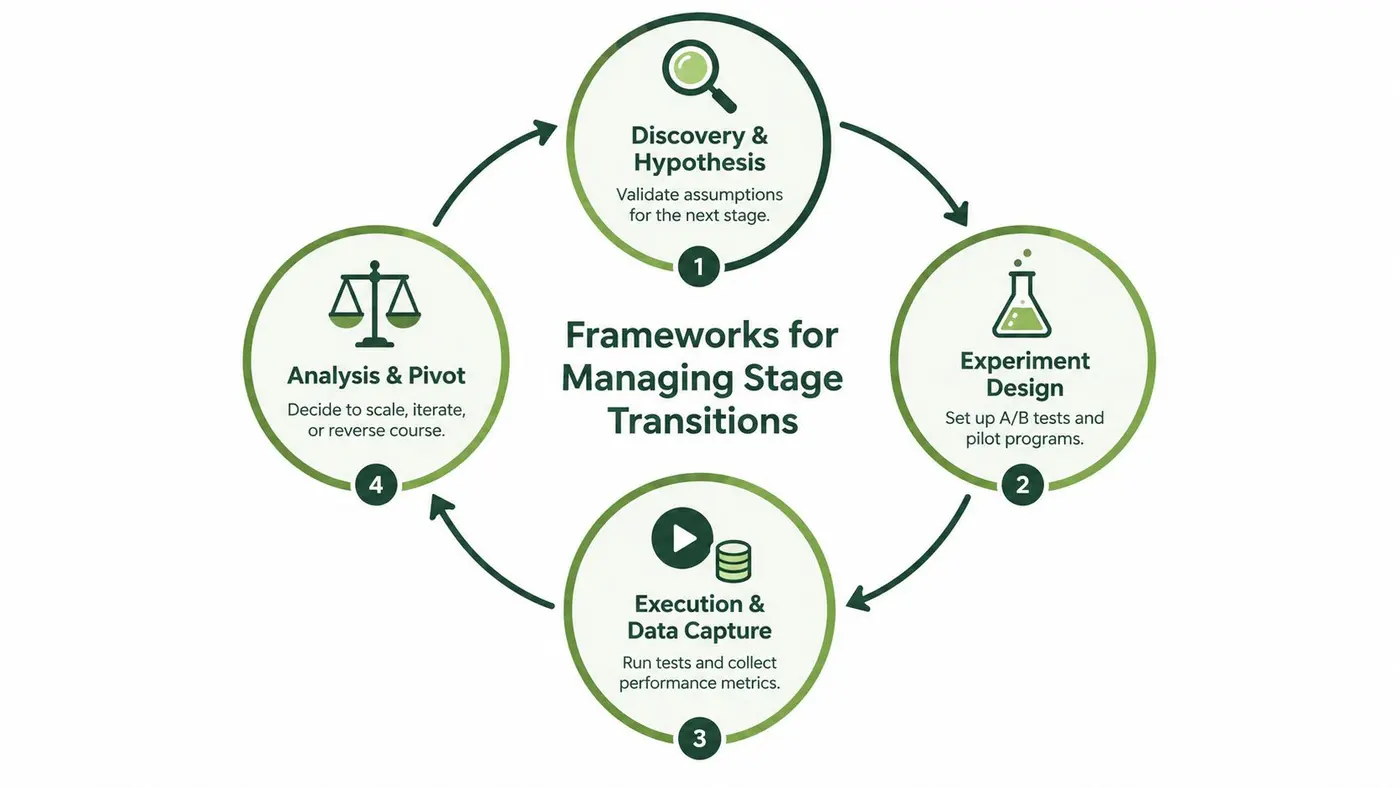
Stage transitions are rarely triggered by one dramatic number. They emerge from converging signals, and teams should test the proposed response before committing resources. The strongest operating rhythm combines a hypothesis, a bounded experiment, reliable capture, and a decision rule agreed before the result arrives.
Start with a transition hypothesis
Write the proposed shift in operational terms. For example, “activation is the constraint to growth” is more useful than “the product is ready to scale”. The team can then identify the behaviour that would confirm or reject the hypothesis, such as completion of a key setup task, repeat use, successful handoff, or reduced support dependency.
Map the hypothesis to a single primary outcome and guardrail measures. An onboarding change might improve first-session completion while increasing confusion later. A pricing test might increase conversion while reducing revenue quality. A feature rollout might improve adoption while harming performance for existing customers.
Design the smallest credible experiment
Use A/B testing when users can be assigned consistently and the change can be isolated. Use a pilot, staged rollout, or cohort comparison when the change affects operations, sales, fulfilment, or a small set of high-value accounts. Keep the control experience stable, define the audience, and record the product version and exposure conditions.
Statistical significance should support a decision, not replace judgement. Teams need enough observations to distinguish a meaningful pattern from noise, but they also need to consider implementation cost, customer impact, and whether the result applies to the target segment.
Decision discipline: A winning test is evidence for a specific context. It isn't permission to generalise without checking who was exposed and what changed.
Decide whether to scale, iterate, or reverse
At the review point, compare the result with the pre-agreed threshold and examine the guardrails. Scale when the benefit is credible and the operating model can support it. Iterate when the direction is promising but the experience or segment fit remains unclear. Reverse course when the result contradicts the hypothesis or introduces unacceptable risk.
Portfolio teams can also use The OKR Hub Boston Matrix guide to discuss relative investment choices across products or initiatives. The framework is most useful when it prompts an explicit conversation about funding, evidence, and strategic role rather than becoming a label attached to a favourite project.
Experimentation works best as infrastructure. Product analytics, feature flags, versioned content, consent-aware measurement, and release controls let teams learn without turning every decision into a full rebuild. The transition from growth to maturity then becomes a managed shift towards efficiency and retention, rather than a sudden reaction to a disappointing quarter.
Real-World Applications in SaaS and E-commerce
A SaaS product and a physical e-commerce product can share a lifecycle vocabulary while facing very different constraints. SaaS teams can often modify the experience continuously, but they must protect existing workflows, data integrity, uptime, and customer trust. E-commerce teams manage a more tangible chain of dependencies, including sourcing, inventory, product content, fulfilment, returns, and disposal.
SaaS operates as a service loop
For SaaS, launch continues after release because the product's value depends on repeated use. A team should track whether users reach meaningful value, which features become habitual, where accounts stall, and why customers leave. The practical levers include onboarding, in-product guidance, reliability, permissions, integrations, pricing architecture, and release communication.
A mature SaaS product can't optimise only for new acquisition. Existing customers may depend on familiar navigation, stable APIs, predictable billing, and established workflows. Test changes with clear segmentation, preserve a dependable path for core tasks, and treat migration as a product experience rather than an announcement.
A useful experiment might compare onboarding sequences, workspace defaults, or feature education. The test should measure the intended business outcome while checking support contacts, task completion, and downstream retention. A local conversion gain isn't valuable if it creates confusion that surfaces later.
The service loop also changes the sunset decision. The team must plan data export, replacement capability, contract obligations, communications, and support for customers who cannot move immediately.
E-commerce has physical consequences
An e-commerce catalogue moves through demand, procurement, storage, sale, delivery, return, and sometimes disposal. Product pages are part of the operational system. If dimensions, materials, compatibility, care instructions, or availability are wrong, the cost appears in returns, support work, failed fulfilment, and damaged trust.
For a physical product, growth may require stock availability and supplier resilience rather than another promotional campaign. Maturity may call for assortment rationalisation, packaging improvements, variant simplification, or better merchandising. Decline may involve a controlled clearance strategy, replacement product, spare parts, warranty commitments, and responsible handling of remaining stock.
The comparison is straightforward:
- SaaS bottleneck: Adoption, reliability, integration, retention, and safe change.
- E-commerce bottleneck: Accurate content, stock, fulfilment, returns, margin, and supplier continuity.
- Shared requirement: A consistent record of what changed, which customers or products were affected, and what outcome followed.
Treating both models as marketing funnels misses the operational work that determines whether lifecycle decisions hold up in the actual market environment.
Navigating Obsolescence and Data Fragmentation
Late-lifecycle risk often arrives through the supply chain or the information layer. UK construction is losing up to £3.8 billion a year because product information is fragmented and difficult to share, while 21% of firms are fully ready for Building Safety Act requirements and 14% fully understand the golden thread of building-safety information, according to GS1 UK's analysis of construction product data. These figures show why product information can become a commercial and safety dependency, not merely a content task.
Machine-readable records need stable identifiers, version control, ownership, approval history, and links between specifications, suppliers, releases, and end-of-life decisions. A document stored in one team's folder may be technically available yet operationally unusable if another team can't find, interpret, or verify it.
Obsolescence creates a different pressure. A 2025 UK manufacturing report on obsolescence management says 88% of manufacturers encounter technological obsolescence at least annually, 27% face it quarterly, 81% struggle to find reliable partners with the right expertise, and redesign costs after component discontinuation can exceed £250,000 in complex systems.
Build the response before the crisis
Maintain a component and dependency register, review supplier continuity, identify approved substitutes, and record the skills needed to support legacy products. For digital products, include third-party services, frameworks, APIs, data formats, and security dependencies. For physical products, connect parts, materials, certifications, drawings, and service instructions.
Data retention is part of this control. Teams working through retention choices can use this guide to data retention policies, then adapt the principles to product records, audit needs, customer obligations, and deletion requirements. The aim isn't to keep everything forever. It's to preserve the evidence needed to operate, support, comply, and learn.
Building a Resilient Product Strategy
A resilient product strategy treats lifecycle management as a continuous operating loop. Review the product's stage, verify the evidence, align investment with the constraint, and preserve the data needed for the next decision.
Start with five habits:
- Continuous discovery: Keep customer and market research active after launch.
- Data-driven roadmapping: Tie priorities to lifecycle evidence, not internal excitement.
- Modular architecture: Make changes, substitutions, and retirements safer.
- Sunset protocol: Define migration, communication, support, and end-of-life responsibilities early.
- Team feedback loops: Let product, engineering, marketing, operations, sales, and support share what each stage is teaching them.
The strongest teams don't wait for decline to discover that their records are incomplete or their experiments are unreliable. They build the measurement, governance, and decision routines while the product still has room to adapt.
Otter A/B helps teams test headlines, calls to action, layouts, onboarding flows, and feature messaging without turning every lifecycle decision into a lengthy engineering project. Visit Otter A/B to run controlled experiments, connect results to business outcomes, and make your next product transition with clearer evidence.
Stop guessing
Ready to start testing?
Set up your first A/B test in under five minutes. No credit card required.
- 14-day free trial
- No credit card required
- Cancel anytime