1 Tail Test in A/B Testing: When It Makes Sense
Learn when a 1 tail test fits A/B testing, how it affects significance and error rates, and why the direction must be set before results.
The popular advice to use a 1 tail test when you expect an uplift misses the most important question: what would you do if the variant made things worse? Expecting an improvement isn't enough to justify a directional analysis. Your choice should reflect a business decision agreed before the experiment, not a convenient way to turn promising results into a winner.
Why the Direction of a Test Changes the Decision
A growth marketer tests a new landing-page headline. The variant's click-through rate looks higher than the control's, but the analysis hasn't established a statistically significant difference. Someone suggests changing to a one-tailed test because the team only wanted to increase clicks.
That suggestion confuses the result the team hoped for with the question the team agreed to investigate. Those aren't necessarily the same.
The marketer also needs to know what happens after the click. If visitors reach the checkout but don't complete purchases, the headline might attract attention without supporting the intended commercial outcome. A more encouraging click result wouldn't settle that concern.
Start with the action, not the observed uplift
Consider the decisions behind the experiment:
- Promote a candidate for further evaluation: The team might require evidence of improvement before spending more effort on a headline.
- Replace the current experience: The team needs evidence relevant to the consequences of exposing customers to the change.
- Protect an existing revenue stream: A deterioration may matter just as much as an improvement, even when everyone expects the variant to perform better.
These decisions require different evidence. Choosing a statistical direction without identifying the action risks answering a question that isn't useful.
Practical rule: Choose the question you need answered before choosing the analysis that makes the result look strongest.
There's also a distinction between statistical significance and commercial value. An experiment can provide evidence of a directional effect without establishing that the effect justifies development work, changes customer behaviour in a useful way, or improves the metric responsible for rollout.
The right starting point isn't whether the headline looks promising. It's whether the planned analysis can support the decision the team needs to make.
Building the Core Concept One Tail at a Time
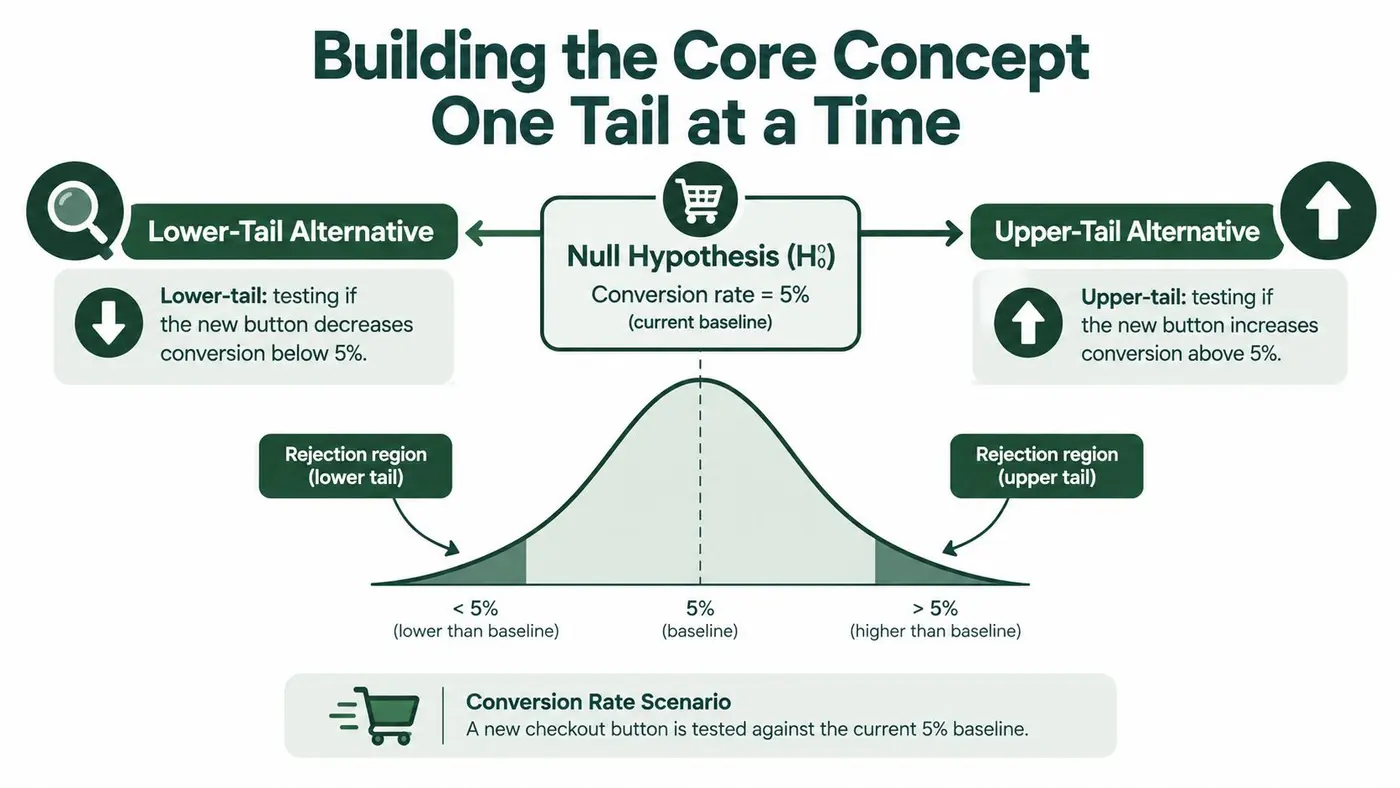
A one-tailed test, sometimes searched for as a 1 tail test, evaluates an effect in a specified direction. To understand it, start with a checkout-button experiment and compare the variant's conversion rate with the control's.
The null hypothesis represents the position being tested against. For an improvement test, that position is that the variant doesn't improve conversion; the equality boundary supplies the reference for calculating the test statistic.
The alternative hypothesis states the directional claim:
- Upper-tail alternative: The new button increases conversion relative to the control.
- Lower-tail alternative: The new button decreases conversion relative to the control.
The diagram shows these alternative directions around an illustrative conversion baseline.
Translate the observed difference into evidence
Different samples of visitors can produce different conversion rates even without a genuine improvement. A test evaluates the observed difference against that sampling uncertainty, rather than treating every positive difference as evidence of success.
The critical region contains results sufficiently extreme to reject the null under the chosen procedure. Its boundary is the critical value.
For a normal z-test at a 5% significance level, the one-tailed critical value is approximately 1.645 for an upper-tail alternative or −1.645 for a lower-tail alternative, compared with approximately ±1.96 for a two-tailed test, as shown in CIMT's hypothesis-testing teaching materials.
The p-value expresses how unusual evidence at least as extreme as the observed result would be under the null model, in the direction being tested. It isn't the probability that your variant is better.
If the terminology still feels abstract, this explanation of what a test of a hypothesis means provides a useful foundation. Keep the distinction clear: the observed difference describes the sample; the statistical test evaluates the evidence for the specified claim.
Comparing One-Tailed and Two-Tailed Tests
Choosing between one-tailed and two-tailed tests is a choice about scope, not statistical quality. A correctly planned directional test can be appropriate, while a broader test can be more useful when the business needs to recognise movement either way.
An upper-tail test asks whether the variant improves the selected metric. A two-tailed test asks whether the metric differs between variant and control, without restricting the alternative to improvement.
Choosing the Direction of a Hypothesis Test
| Decision point | One-tailed test | Two-tailed test |
|---|---|---|
| Question asked | Does the metric move in the specified direction? | Does the metric differ in either direction? |
| Evidence that supports rejection | Evidence towards the chosen alternative | Evidence towards either alternative |
| Critical threshold | Directional boundary | Boundaries for both directions |
| Interpretation of a decline | Doesn't support an upper-tail improvement claim | Can support a difference in the negative direction |
| Business fit | A genuinely narrow decision | A decision affected by gains or losses |
| Main decision risk | Treating excluded downside as if it had been assessed | Treating any detected difference as commercially actionable |
A decline doesn't disappear from the experiment because you selected an upper-tail test. You can still observe the conversion rate and its estimated difference. What changes is whether that result can satisfy the rejection rule for your selected alternative.
Separate observation from inference
Suppose a layout variant produces a lower purchase rate. An upper-tail analysis hasn't found evidence of improvement, but that description isn't equivalent to a formal finding of harm. A two-tailed analysis can assess evidence of a difference, with the estimate indicating its direction.
Neither approach automatically tells the team to ship or withdraw a change. That requires a decision rule linking the evidence to business consequences.
Before calculating anything, write down:
- The claim you want to evaluate: Improvement, deterioration or any difference.
- The action each outcome would justify: Rollout, further investigation or retaining the control.
- The evidence required for that action: A result consistent with the planned hypothesis and commercially relevant metric.
This prevents a common mismatch: asking a narrow statistical question while expecting a broad business answer.
Understanding Significance and Error Rates
The significance level, or alpha, controls the probability of incorrectly rejecting a true null hypothesis under the assumptions and testing procedure. That incorrect rejection is a Type I error.
It isn't a personalised probability that a particular variant is wrong. Once you have a result, alpha doesn't tell you the chance that the apparent improvement is genuine.
Distinguish equal-alpha comparisons from regulatory guidance
At the same total alpha, a two-tailed design distributes the rejection probability between both tails, while a one-tailed design puts it in the selected tail. The diagram illustrates that equal-alpha comparison.
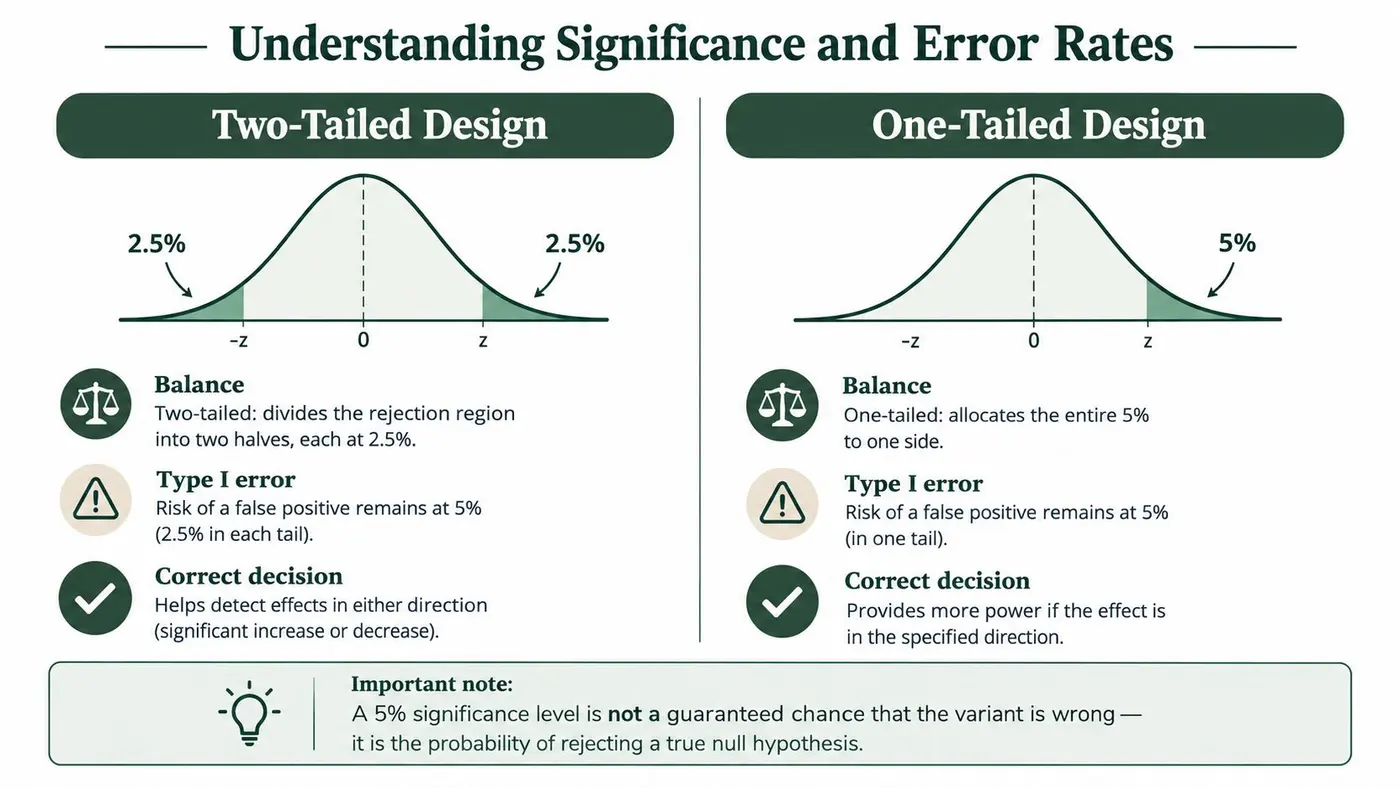
The MHRA's statistical considerations guidance makes a separate recommendation: specify sidedness in advance and use half the conventional two-sided Type I error rate for a one-sided test, so a 5% two-sided level corresponds to a 2.5% one-sided rejection region.
That recommendation isn't the same as saying every one-tailed test automatically uses half its stated alpha. It changes the chosen one-sided alpha, rather than merely relocating the same total error probability.
A less extreme directional boundary follows from comparing tests at the same total alpha. It isn't an unconditional advantage of every one-sided analysis.
Specify the procedure, not just the threshold
For an experiment plan, document more than whether the analysis is one-tailed. Record the significance level, the direction, the calculation method and the conditions under which you'll evaluate the result.
The distinction between a threshold and a complete analysis procedure matters when interpreting A/B testing statistical significance. A dashboard label is meaningful only within the method that produced it.
For teams establishing a broader experimentation workflow, Tagada's A/B testing guide for e-commerce is a useful companion resource. Use that practical planning context alongside an explicit statistical specification, rather than assuming that selecting a confidence setting settles the experiment design.
Deciding Whether a One-Tailed Test Fits Your Experiment
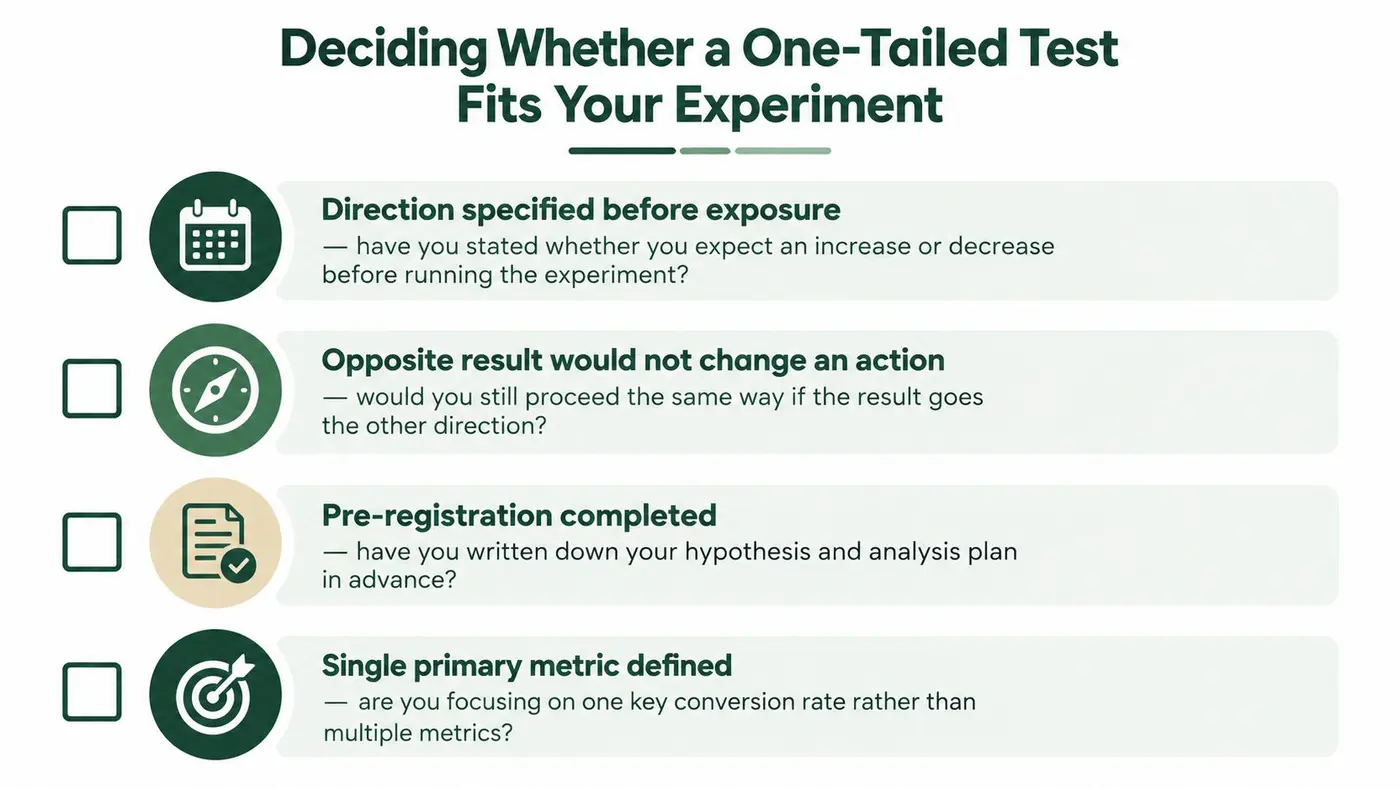
Before launching an experiment, complete the sentence: We will take this action if the experiment provides evidence that…
If the answer is just that the variant is better, make it more precise. Better on which metric, for which intended action, and subject to which business constraints?
Use the checklist to make the proposed directional decision explicit.
Write a usable analysis plan
Your pre-registration can be a clear, dated internal document. Its purpose is to make the intended analysis available before anyone inspects the results, not to add paperwork without improving decisions.
Include:
- The primary outcome: Define the event and denominator, such as completed purchases per eligible visitor.
- The proposed alternative: State the direction relative to the control, rather than merely saying the change should work.
- The rollout conditions: Identify what would permit launch and what would prevent it.
- The evaluation procedure: Specify sample-size planning and stopping rules separately from sidedness.
Choosing one tail doesn't resolve the other design choices. It doesn't tell you how much data you need, when you should stop, or whether conversion rate is the appropriate outcome.
A primary metric also doesn't mean other outcomes are irrelevant. Treat purchases, average order value or revenue as planned secondary measures or guardrails when they affect the decision, and document how you'll use them rather than improvising after the test.
This video offers another format for thinking through the testing choice.
A useful final check is to ask a colleague to apply your written rule to hypothetical positive, negative and inconclusive results. If they can't determine the intended action without asking what you hoped would happen, the plan needs clarification before exposure.
Applying the Choice to A/B Testing Examples
Consider these hypothetical experiments. Each begins with a different decision, even though all involve comparing website variants.
A CTA candidate for further development
A team evaluates a call-to-action in a limited research setting. The decision is whether to invest in developing the candidate further; without evidence of increased engagement, the team retains the current approach.
The proposed upper-tail alternative is that the candidate increases CTA engagement relative to the control. A disappointing result and an inconclusive result both leave the development decision unchanged.
That is a narrower claim than saying the candidate is ready for production. The team still needs an appropriate evaluation before making a broader commercial commitment.
A checkout change with meaningful downside
An ecommerce team removes an explanatory step from checkout. The change could make completion easier, but it could also leave shoppers uncertain about their order.
The team would consider rollout for a useful improvement and investigate or roll back a material deterioration. Both directions therefore matter to the decision.
The University of Sheffield's hypothesis-testing resources explain the directional distinction. Applied to this business scenario, a one-tailed improvement test isn't sufficient for the full decision when losses in purchases, revenue or average order value would change the team's action.
Business safeguard: Don't define an outcome as irrelevant to the analysis when it remains relevant to the rollout.
A headline with mixed journey outcomes
A headline could increase clicks by creating an expectation that the landing page or delivery offer doesn't fulfil. Even a supported click uplift wouldn't establish improved purchase performance.
The team should distinguish the engagement claim from the commercial claim:
- Engagement evidence: Does the headline encourage the intended click?
- Purchase evidence: Do visitors complete the transaction?
- Revenue interpretation: Does the resulting purchasing behaviour support the business objective?
For practical ideas when developing landing-page candidates, Excellorix's CRO split testing tips can complement the experiment plan. Keep the creative hypothesis separate from the success criterion: an interesting headline is a candidate to test, not a reason to lower the standard for declaring commercial success.
Avoiding Common One-Tailed Testing Mistakes
The most tempting mistakes often arise after a team has invested effort in a variant. A favourable reading feels easier to defend than an uncertain result, especially when stakeholders expected a win.
Changing the tail after inspecting the data is one such shortcut. It replaces the planned question with a question selected because it suits the observed pattern.
Another is reducing the entire customer journey to whichever metric improved. If the experiment was intended to support purchases, a click result shouldn't become the final success criterion.
Don't confuse missing evidence with reassurance
An upper-tail test that doesn't establish improvement hasn't shown that the variant is equivalent to the control. Nor does a non-significant decline prove that there's no harm.
Those are separate claims requiring an analysis designed to address them. Avoid turning an inconclusive result into a reassuring statement because the dashboard doesn't show a negative significance label.
This distinction helps when reasoning about Type I versus Type II errors. Incorrectly declaring an effect and failing to detect an effect are different mistakes; neither can be managed by treating every unflagged outcome as safe.
Review the decision before announcing a winner
A short result review can expose interpretation problems:
- Check the original hypothesis: Does the conclusion answer the question recorded before launch?
- Inspect the business outcome: Is the claimed success attached to the metric responsible for the decision?
- Read uncertainty carefully: Does the language distinguish evidence of an effect from unresolved possibilities?
- Apply the rollout rule: Would the same reasoning be acceptable if the result disappointed the team?
Passing a p-value threshold shouldn't end that review. The team still needs to assess the estimated effect, implementation consequences and any planned guardrails.
The discipline is to describe what the experiment supports, not what the team would like the experiment to support.
Making the Final Test Decision with Confidence
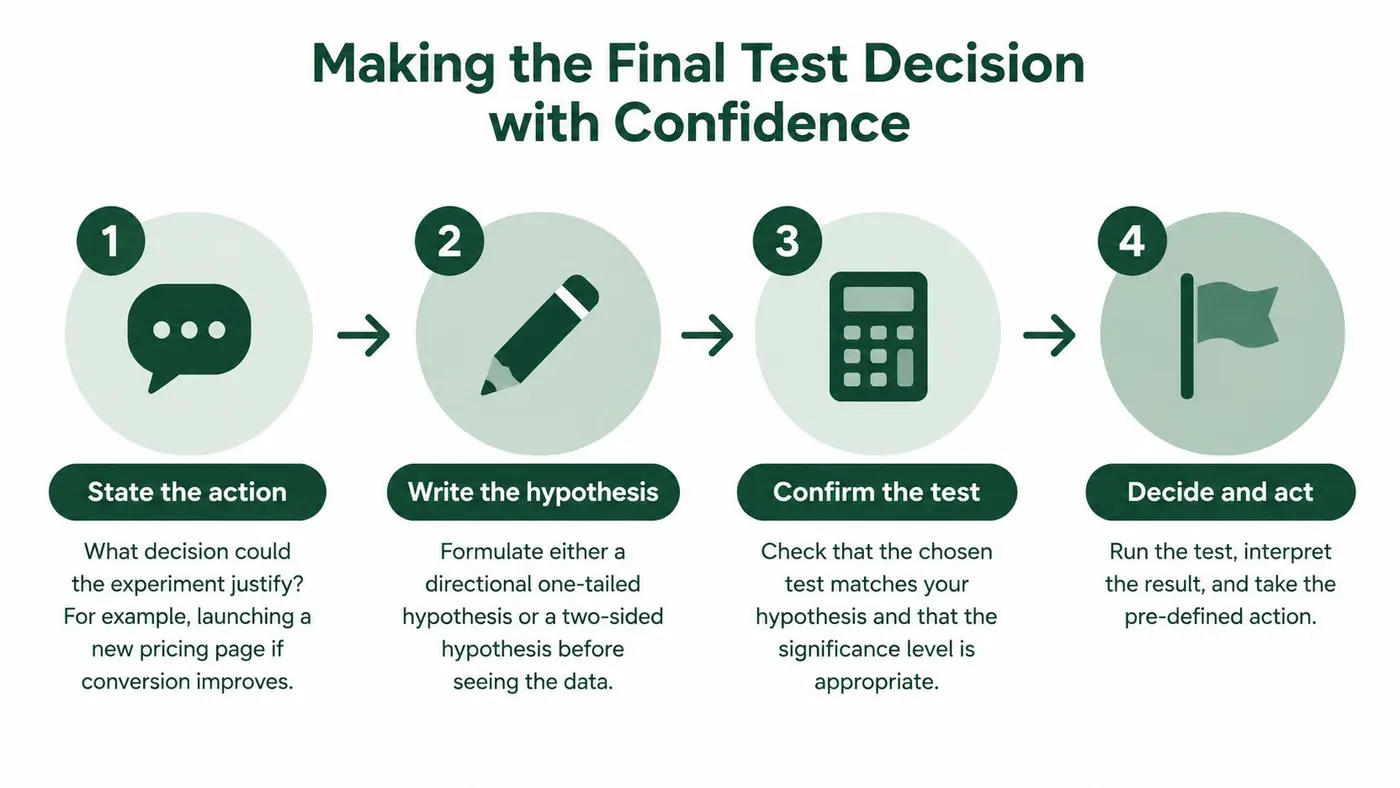
A good test decision connects the intended action, the hypothesis and the interpretation. None should be chosen in isolation.
Start by identifying the commitment the experiment could justify. Approving further research, replacing a checkout and changing a pricing page aren't interchangeable decisions, so they shouldn't inherit the same statistical specification by default.
The process below keeps those choices connected.
Use a final decision checklist
- State the action: Identify what the evidence could authorise, including any limits on rollout.
- Match the hypothesis: Choose a directional or two-sided question that fits that action.
- Confirm the error allocation: Record the selected alpha and understand how the procedure uses it.
- Choose the business metric: Make the primary outcome relevant to the decision, with explicit treatment of supporting measures.
- Fix the analysis beforehand: Document the evaluation and stopping procedure before examining results.
- Interpret within those boundaries: Report what the planned test establishes and what remains unanswered.
A 1 tail test can be legitimate when the decision is directional. At equal alpha, it can make evidence of the specified effect easier to detect, but that advantage doesn't automatically make it more useful for a business that must respond to downside.
After the experiment, describe the evidence before presenting the recommendation. Stakeholders should be able to distinguish a supported statistical claim from the additional judgement needed to act on it.
Statistical confidence should support a pre-agreed decision, not retroactively justify one. That principle makes sidedness a deliberate design choice rather than a last-minute dashboard adjustment.
Otter A/B offers website experiments for headlines, CTAs and layouts, with conversion tracking alongside purchases, average order value and revenue per variant. Visit the platform to set up your next experiment, and document the hypothesis, business metric and rollout rule before you launch.
Stop guessing
Ready to start testing?
Set up your first A/B test in under five minutes. No credit card required.
- 14-day free trial
- No credit card required
- Cancel anytime