A B Testing Statistical Significance: Master It in 2026
Make confident, data-driven decisions in 2026. This guide explains A/B testing statistical significance, p-values, confidence intervals & mistakes to avoid.
You launch a new headline, call to action, or checkout layout and check the dashboard after a few days. The variant is ahead, but only slightly. One stakeholder wants to roll it out, another wants more evidence, and the data appears to change each time you refresh the page. For these situations, A/B testing statistical significance matters. It helps you separate a genuine performance difference from the normal variation that appears whenever different people see different experiences.
Statistical significance isn't a guarantee that a variant will create more revenue after rollout. It's a decision aid. Used properly, it helps your team ask whether the observed difference is sufficiently unusual under a no-difference assumption, then combine that answer with sample size, test duration, data quality, and commercial value.
Why Is My A/B Test Result Inconclusive
An inconclusive result doesn't mean the experiment failed. It means the data hasn't established a reliable difference between the control and variant under the rules you set.
Suppose your original headline converts a little less often than the new headline during the first few days. That lead may reflect a real response to clearer messaging. It may also reflect who happened to visit during that period, which traffic sources were active, or ordinary fluctuations in user behaviour. A small early gap can move in either direction as more visitors enter the experiment.
Without a formal statistical framework, declaring a winner from that early lead is closer to gambling than learning. The test needs enough observations to distinguish a repeatable effect from random noise.
What inconclusive actually tells you
An inconclusive result generally supports one of several interpretations:
- The change may have little effect: The variant and control perform similarly for the chosen goal.
- The experiment may be underpowered: The test hasn't collected enough useful observations to detect the effect you care about.
- The signal may be noisy: Traffic sources, weekly behaviour, technical issues, or inconsistent tracking may obscure the difference.
- The metric may be too distant: A headline can influence engagement, while the business cares about completed purchases or revenue per visitor.
The important distinction is that “not significant” doesn't prove the variants are identical. It means the evidence isn't strong enough to reject the possibility that chance explains the observed difference.
For a practical treatment of what to check when a test doesn't produce a clear decision, review this guide to inconclusive test results. It can help you distinguish between a genuine no-change finding and an experiment that needs better planning or cleaner measurement.
Resist the pressure to force a decision
Marketing teams often feel pressure to choose a winner because a test consumes attention, development time, and traffic. That pressure can lead to premature rollouts, especially when the variant has a compelling story behind it.
Practical rule: An inconclusive test is a valid result. Record what it tells you, investigate the uncertainty, and avoid presenting a weak signal as a proven improvement.
Start by checking whether the test reached its planned sample size and covered the relevant business cycle. Then inspect the assignment, tracking, primary KPI, and confidence interval. If the result still doesn't support a clear decision, keep the control, revise the hypothesis, or design a better-powered follow-up rather than converting uncertainty into confidence.
The Core Idea Behind Statistical Significance
Statistical significance becomes easier to understand if you start with a fair coin. If you flip it repeatedly, heads and tails won't alternate perfectly. You might see a run of heads even though the coin hasn't changed. Randomness creates short-term patterns.
An A/B test works from a similar baseline. The null hypothesis says there isn't a genuine difference between the control and variant. Any gap in conversion rates is treated initially as something that could have appeared through random allocation and ordinary user variation.
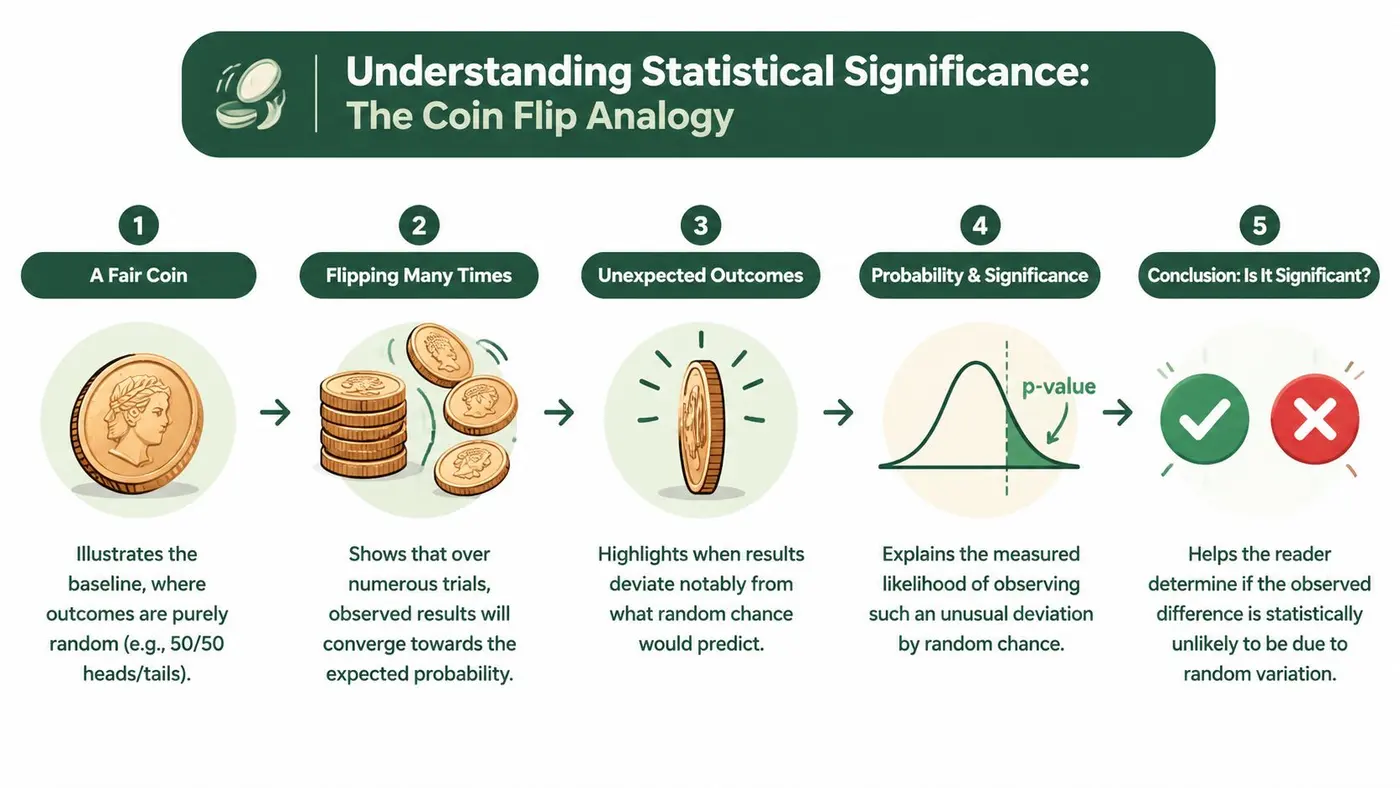
From an unusual coin pattern to a p-value
The p-value asks a precise question: if the control and variant really performed the same, how probable would it be to observe a difference at least as large as the one in your data?
A high p-value means the observed gap isn't especially surprising under the no-difference assumption. A low p-value means the gap would be unusual if chance were the only explanation. The p-value doesn't tell you the probability that your variant is good, nor does it measure the size or commercial value of the improvement.
Think of it as a surprise meter, not a business forecast.
Why teams use a 95% confidence level
In UK-facing experimentation guidance, the most common threshold for declaring an A/B test winner is a 95% confidence level, corresponding to a p-value at or below 0.05. At that threshold, teams treat the observed difference as unlikely to be random chance, not as a guaranteed business win, as explained in UK A/B testing guidance on Shopify.
The confidence level is the decision boundary you choose before interpreting the result. A 95% confidence level means the team accepts a specified risk of a false positive under the testing framework. It doesn't mean there's a 95% probability that this particular variant will outperform forever.
The Office for National Statistics uses 95% confidence intervals as a standard way to express uncertainty. GOV.UK guidance also explains that non-overlapping confidence intervals indicate a statistically significant difference between groups. For practical CRO work, the safest interpretation combines the p-value or interval with the size of the effect, the quality of the test, and the decision's business consequences.
Statistical significance isn't practical significance
A result can be statistically detectable but commercially irrelevant. A tiny improvement might clear the threshold with enough data, yet fail to justify design work, engineering effort, operational changes, or customer-service risk.
That distinction should shape your experiment brief from the beginning. Define what would count as a useful outcome, then assess whether the measured difference is large enough to matter. Statistical significance answers “is this difference unlikely to be noise?” Practical significance answers “is this difference worth acting on?”
How A Significance Test Actually Works
For a conversion metric, the usual comparison is between two proportions. The control has a conversion rate based on its users and conversions. The variant has its own conversion rate. A two-proportion z-test evaluates whether the gap between those rates is large relative to the uncertainty created by the sample sizes.
You don't need to calculate the formula by hand to understand the logic. The test considers three connected elements:
- The observed difference: How far apart are the control and variant conversion rates?
- The amount of data: How many users and conversion events support each rate?
- The expected variation: How much movement would normal sampling noise create?
A larger gap usually creates stronger evidence, while larger samples make estimates more stable. A small gap with limited data is harder to distinguish from random fluctuation.
What the z-score represents
The z-test converts the observed difference into a score measured against its expected variability. Conceptually, the score tells you how many standard deviations the result sits away from zero, where zero means no difference between the variants.
A result close to zero is compatible with ordinary noise. A result farther from zero is less compatible with the null hypothesis. The testing system then translates that distance into a p-value and confidence interval.
For conversion rates, UK practitioner guidance recommends a two-proportion z-test. For continuous outcomes such as revenue per user or average order value, it recommends a two-sample t-test, with the decision based on whether the 95% confidence interval for the difference excludes zero, as described in this UK guide to A/B test analysis.
Why the metric determines the test
Conversion is binary. A visitor either completes the defined conversion event or doesn't. Revenue per visitor and order value are continuous measures, so they require a different analytical approach.
That choice matters because the test must match the data and the question. If your primary goal is completed purchase, analyse the conversion proportion. If the change could alter basket value, examine revenue or average order value separately. Don't select the metric after seeing which result looks most favourable.
Tools can automate the calculation, but they can't repair a vague hypothesis, invalid randomisation, duplicate events, or a poorly chosen KPI. Use a plain-language explanation of p-values when stakeholders need to understand why a dashboard can show an apparent lead without supporting a rollout.
Planning Your Test Power Sample Size and Duration
Reliable significance starts before launch. If you decide to run a test “for a few days” and then interpret whatever appears, you've allowed the calendar and the latest dashboard fluctuation to determine your evidence standard.
GOV.UK warns that A/B tests need many users for results to become statistically significant, because small samples can produce unstable conclusions. The government guidance on comparative A/B testing makes the operational point clearly: sample size isn't a technical detail to tidy up after launch. It determines how much confidence your result can support.
Define the effect worth detecting
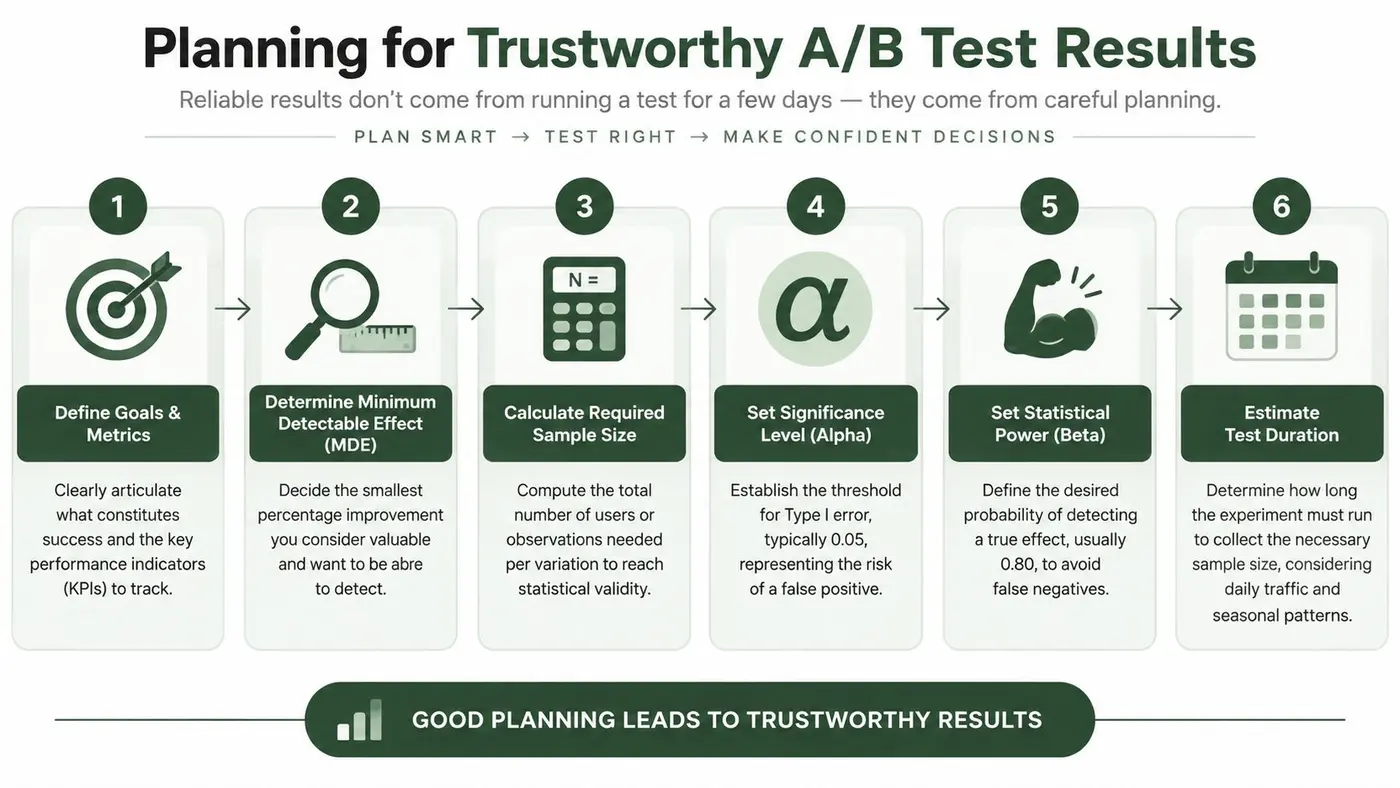
Begin with the minimum detectable effect, or MDE. This is the smallest change that would be valuable enough to influence your decision.
An MDE isn't a prediction that the variant will achieve that result. It's a planning choice. If a change below your commercial threshold wouldn't justify implementation, there's little value in designing the test around detecting it precisely.
Next, choose the primary KPI and record the baseline conversion rate. A checkout test might focus on completed purchase, while an onboarding test might focus on activation. Secondary metrics can reveal harm or explain behaviour, but one primary KPI should anchor the decision.
Power turns planning into a decision rule
Statistical power describes the test's ability to detect a real effect of the chosen size. A test with weak power can miss a worthwhile improvement and return an inconclusive result, even when the variant is helpful.
Your required sample size depends on the baseline rate, MDE, significance threshold, desired power, and traffic allocation. If you split traffic across more variants, each comparison receives less information, which can make the experiment take longer or detect only larger effects.
Set the duration before looking at results
Duration should follow the required sample size and the traffic pattern, not the moment a dashboard turns green. A test that captures only one part of the week may overrepresent a particular audience or purchase context. Campaigns, promotions, paydays, product launches, and technical changes can also affect both groups.
Set a stopping rule before launch. It might be a target number of observations, a fixed run period, or both. Use a sample size calculator for A/B testing to turn the assumptions into a documented plan, then record the assumptions alongside the experiment hypothesis.
Planning principle: If you can't explain before launch what data you need, what effect matters, and when the test ends, you won't have a stable basis for interpreting the result.
Common Pitfalls That Invalidate Your Results
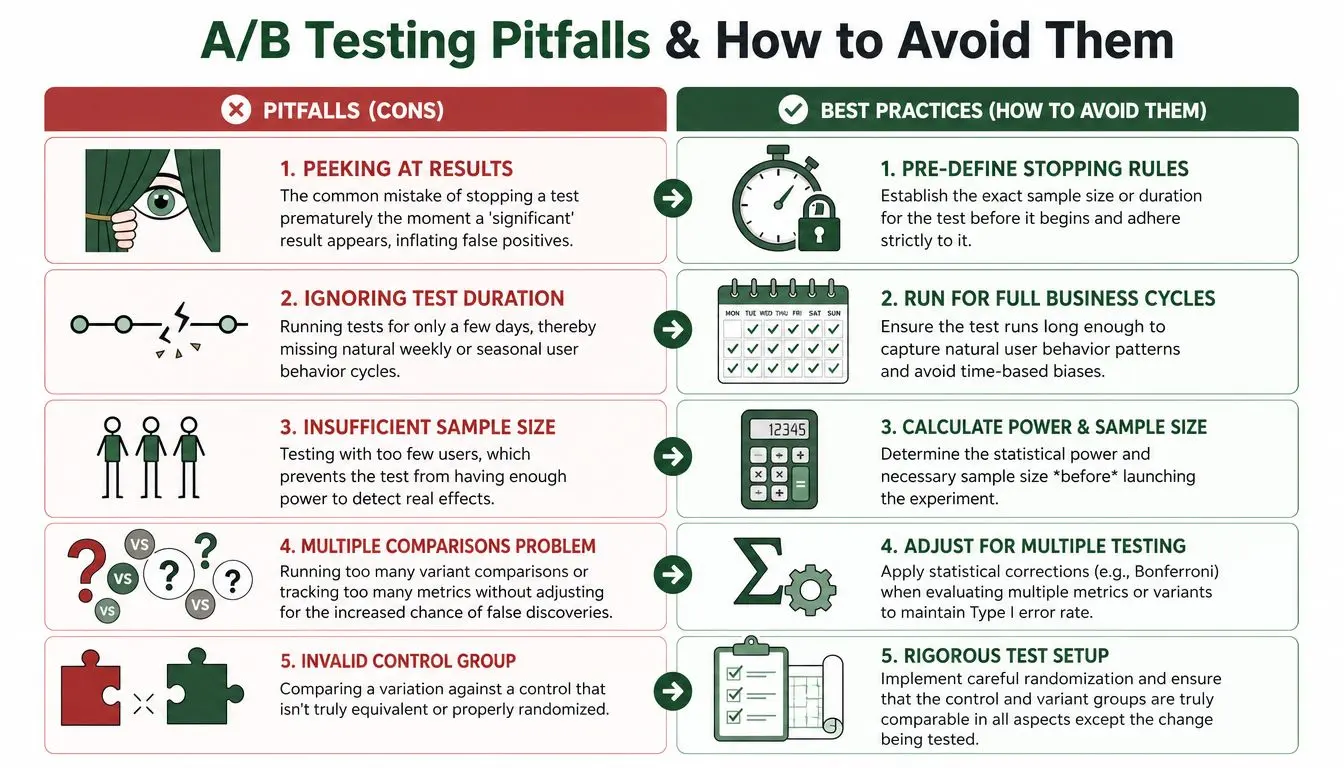
A mathematically correct test can still produce an untrustworthy decision if the experiment was poorly run. The most common failure isn't a complicated statistical error. It's the temptation to check the dashboard, see a favourable result, and stop immediately.
That behaviour changes the rules after observing the data. Repeatedly checking creates repeated opportunities for a random fluctuation to cross the significance threshold. Regression to the mean can then pull the apparent winner back towards ordinary performance.
The shortcuts that create false confidence
- Peeking at results: Checking is fine for detecting technical failures, but don't stop solely because the latest reading passes your threshold. Follow the stopping rule defined before launch.
- Ignoring duration: A short run can miss recurring traffic and purchasing patterns. Include the relevant business cycle rather than treating a few favourable days as a complete experiment.
- Testing too few users: Small samples make rates volatile and can hide real effects or exaggerate unusual ones. GOV.UK specifically cautions that many users may be needed for statistical significance.
- Comparing too many options: Each additional variant or metric creates more opportunities for a chance finding. Keep the experiment focused, or use an appropriate correction when multiple comparisons are central to the analysis.
- Using a weak control: Random allocation must place comparable users into the control and variant groups. If the groups differ systematically, the result can reflect audience composition instead of the tested change.
Statistical significance versus practical value
A low p-value doesn't tell you whether the result pays for itself. A variant could produce a statistically credible improvement in a funnel metric while lowering order value, increasing refunds, or creating friction later in the journey.
Review the full measurement picture:
| Question | Why it matters |
|---|---|
| Did the primary KPI move? | It confirms whether the experiment addressed the stated hypothesis. |
| Is the interval comfortably away from zero? | It shows whether the estimate has a useful direction and degree of uncertainty. |
| Does the effect matter commercially? | It connects the statistical result to implementation cost and business value. |
| Did guardrail metrics remain healthy? | It helps detect harm hidden behind a single winning metric. |
The same discipline applies when you track many segments after the test. Segment analysis can generate useful hypotheses, but a surprising subgroup result shouldn't automatically replace the primary analysis.
Audit the experiment before celebrating
Check exposure logs, event definitions, assignment balance, device behaviour, and the user journey in both variants. Confirm that the conversion event fires once, the control remained unchanged, and external campaigns affected both groups in a comparable way.
For a visual explanation of these risks and their safeguards, watch the following practical overview:
A compelling result deserves more scrutiny, not less. The bigger the apparent impact, the more carefully you should verify tracking, randomisation, and the definition of success before rollout.
Translating Statistics into Business Wins
A statistically significant result is only the start of the decision. Your team still needs to understand how large the effect is, how uncertain the estimate remains, and whether the change improves the commercial outcome that matters.
Start with the confidence interval around the difference. It provides a range of plausible values for the underlying effect, rather than presenting one uplift figure as if it were exact. If the interval excludes zero under your chosen analysis, the result supports a difference. Its width also tells you how precisely the test estimated that difference.
Conversion rate isn't the whole scoreboard
A new product page may encourage more visitors to begin checkout but fewer to complete payment. A promotional message may lift conversion while attracting lower-value orders. A form change may increase submissions but reduce lead quality.
For ecommerce, evaluate outcomes such as:
- Revenue per visitor: Connects the experience to the value generated by exposed traffic.
- Average order value: Shows whether the variant changes basket size.
- Purchase conversion: Measures the proportion completing the defined transaction.
- Guardrail metrics: Identifies cancellations, refunds, errors, or downstream friction where relevant.
A dashboard that reports conversion rate, uplift, significance, purchases, average order value, revenue by variant, and revenue trends can make the decision more concrete. Otter A/B is one example of a platform that uses a frequentist z-test engine for variant comparisons and presents these experiment outputs in a results view.

Let commercial impact set the rollout bar
UK-focused commerce data illustrates why most experiments shouldn't be treated as automatic wins. In one dataset of 2,408 UK-focused A/B tests, 17.4% produced a statistically significant winning variant, while 74.2% were inconclusive or showed no detectable difference, as reported in UK ecommerce A/B testing data.
That pattern supports a realistic testing culture. Most ideas won't clear the evidence threshold, and a significant result still needs a practical-value review. Compare the likely benefit with implementation effort, technical risk, brand considerations, and the cost of delaying other experiments.
Teams that want a broader framework for turning test insights into funnel improvements can use this practical resource on how to improve conversion rates. Use it to generate hypotheses, then test those hypotheses against a defined KPI rather than assuming a best practice will work for every audience.
Your Action Plan for Trustworthy A/B Testing
Use this checklist for each experiment:
- Write one clear hypothesis: State what will change, which audience will experience it, and why you expect the KPI to move.
- Choose the primary metric: Select the outcome that decides success. Add guardrails for meaningful risks.
- Set the MDE and power assumptions: Decide the smallest commercially useful effect and plan the sample size around it.
- Fix the stopping rule: Document the required sample size and expected duration before launch. Don't stop because the dashboard looks favourable.
- Randomise consistently: Ensure users have a fair chance of entering each group and verify that the control and variant receive comparable traffic.
- Protect data quality: Check event firing, exposure logging, page behaviour, and external campaign effects during the run.
- Analyse the correct test: Use a proportion test for binary conversion outcomes and a mean-based test for continuous measures such as order value.
- Review practical impact: Examine the confidence interval, revenue-related metrics, implementation cost, and guardrail performance before rollout.
- Document the decision: Record the result, limitations, follow-up questions, and whether the change ships, needs another test, or remains inconclusive.
If your experiments involve traffic from social channels, planning content distribution separately can prevent timing assumptions from contaminating the test. A guide to peak hours for short-form video can help coordinate publishing activity, while your experiment plan keeps the measurement window fixed.
Statistical rigour doesn't slow growth. It prevents your team from spending development time on noisy wins and gives genuine improvements a defensible path into production.
Otter A/B helps teams run website experiments, compare variants with a frequentist z-test engine, and connect significance with conversion and revenue outcomes. Visit Otter A/B to start an experiment and make your next rollout decision with clearer evidence.
Stop guessing
Ready to start testing?
Set up your first A/B test in under five minutes. No credit card required.
- 14-day free trial
- No credit card required
- Cancel anytime