How to Do Ab Testing
How to do ab testing. Learn how to do A/B testing from hypothesis to rollout. A practical UK guide covering setup, traffic split, significance, and winning
A UK-focused analysis of 2,408 A/B tests found that only 17.4% produced a statistically significant winner, while 38.4% were statistically indistinguishable and 35.8% were inconclusive because the sample was insufficient. The analysis changes the question from “How do we find more winners?” to “How do we make better decisions when most tests don't produce one?”
That's the operational reality of conversion rate optimisation. A/B testing isn't a machine for manufacturing uplifts. It's a controlled way to replace opinion with evidence, learn which assumptions survive contact with users, and decide whether to ship, revise, or stop. The teams that get value from it aren't necessarily the teams running the most experiments. They're the teams with the strongest process when the dashboard stays inconclusive.
Why A/B Testing Still Matters for UK Teams in 2026
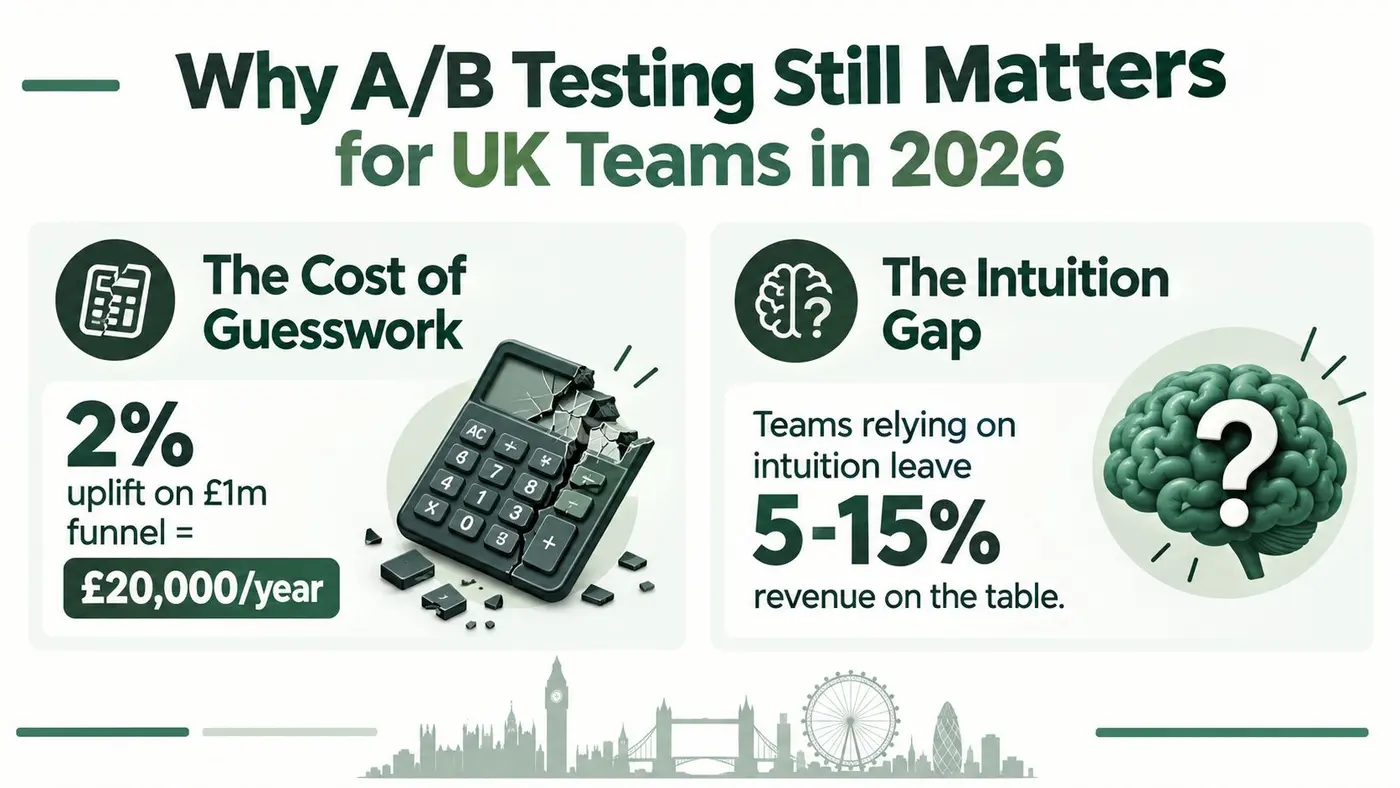
A 2% uplift on a £1m ecommerce funnel equals £20,000 a year, as shown in the supplied UK-focused briefing. That commercial effect explains why experimentation deserves attention, but the stronger case is operational. Teams still make permanent changes without knowing whether they improved customer behaviour, reduced revenue, or shifted activity between funnel steps.
A/B testing gives teams a controlled way to answer that question. One audience sees the existing experience, another sees a defined alternative, and both versions are assessed against an agreed measure. The method only helps when teams protect the control, allocate traffic fairly, plan enough data, and accept that a flat result can be the correct result.
GOV.UK has used experimentation operationally in public services since at least 2017. In one example, users were split 50/50 between control and variant, and the experiment was planned to run for about a week to reduce the false-negative rate below 20%. The Data in Government team's account shows why disciplined testing matters in journeys where decisions need evidence rather than preference.
The process matters more than the promise
The common failure is treating every test as a campaign that must produce a winner. That pressure encourages early stopping, metric changes, and victory declarations based on a short dashboard window. The result is a persuasive story with weak decision value.
A serious programme follows a complete chain:
- Research: Find friction in analytics, recordings, surveys, customer support, or funnel data.
- Hypothesis: State what will change, for whom, and why.
- Design: Change a meaningful variable while protecting the control.
- Measurement: Choose one primary success metric and define guardrails.
- Inference: Run long enough and collect enough data for the result to be useful.
- Decision: Ship, iterate, or archive, including when neither version wins.
The decision rule matters as much as the test design. A clear winner may justify rollout. A harmful result should stop the change. An inconclusive result should preserve the control, record the learning, and either refine the hypothesis or move the team to a better opportunity.
For a deeper introduction to the mechanics and applications, A B testing for conversion optimization is a useful companion resource. Testing discipline beats testing enthusiasm. Results can be slow, flat, or inconvenient, and that information still protects the team from shipping on intuition alone.
Building a Strong Hypothesis and Picking the Right Metric
A weak test begins before the testing platform opens. “Let's improve conversions” identifies an ambition, not a hypothesis. It leaves out the customer problem, the proposed change, and the evidence that would support the decision, including the possibility that neither version will win.
Rank opportunities with ICE, which covers Impact, Confidence, and Ease. Impact asks how much the change could affect a meaningful business outcome. Confidence reflects the quality of the evidence behind the idea. Ease includes design, engineering, analytics, legal, and release effort. ICE does not make prioritisation objective, but it exposes assumptions and gives the team a practical basis for weighing trade-offs.
Write a statement that can survive review:
If we change [element] for [audience], then [metric] will move because [reason], measured by [method].
A checkout team might hypothesise that clarifying delivery timing for mobile users will increase completed purchases because uncertainty is delaying commitment. Completed purchase rate could be the primary measure. Revenue per visitor and average order value should remain guardrails, because a higher conversion rate can still hide weaker commercial performance.
The Otter A/B guide to stating a hypothesis offers a practical reference for turning an idea into a testable statement.
Choose one primary measure
Set one primary metric before launch and decide how the result will be judged if the versions are close. Secondary signals can explain behaviour, but they should not replace the original decision measure after the results appear.
| Metric Type | Purpose | Example | When to Use |
|---|---|---|---|
| Primary metric | Makes the main decision | Completed purchase rate | Use when it directly represents the test objective |
| Secondary metric | Adds behavioural context | CTA clicks or form starts | Use to explain how users responded |
| Guardrail metric | Detects commercial or experience harm | Revenue per visitor, AOV, refund rate | Use whenever the primary metric can hide a downside |
| Diagnostic metric | Helps investigate the mechanism | Delivery-option selection | Use to understand why a result occurred |
Do not promote a convenient micro-conversion because it moves faster. A button click can rise while completed orders, revenue per visitor, or lead quality falls. Record the baseline, target audience, and traffic source before launch. Define how missing, duplicated, or delayed events will be handled.
A test brief should answer five questions:
- What user problem prompted the test?
- What exact element will change?
- What is the primary metric?
- Which guardrails can veto a rollout?
- What sample size, duration, and stopping rule will apply?
Also write the inconclusive-result rule in advance. If neither version produces a clear decision, preserve the control, document the evidence, and either refine the hypothesis or stop investing in the idea. If the team cannot answer these questions before seeing results, the experiment is not ready.
Setting Up Your Test Without Hurting Your Site
Implementation quality can invalidate a well-designed experiment. A variation that appears late, flashes the control before replacing it, or breaks on a particular device doesn't measure the intended experience. It measures a technical defect.
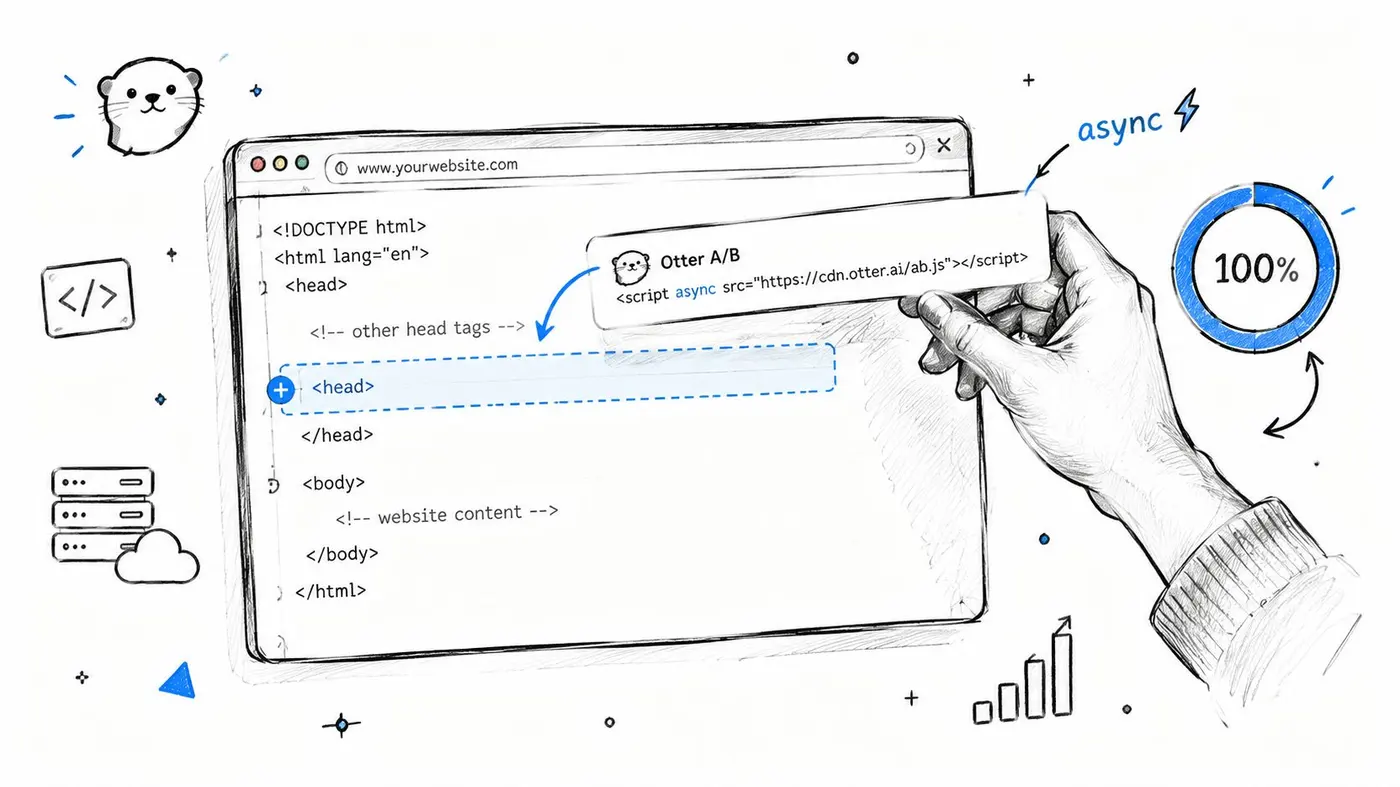
With a client-side platform such as Otter A/B, begin with the JavaScript snippet and verify that it loads asynchronously. Configure the SDK weight to 100% before launch, then reduce exposure gradually if you're using a cautious rollout. The snippet should execute in a way that avoids blocking rendering, and the variant should be ready before it becomes eligible for visitors.
Match the installation to your stack
-
Shopify: Add the snippet to
theme.liquid, then test collection, product, cart, and checkout-adjacent pages separately. -
WordPress: Use
header.php, a properly managedwp_headhook, or a tag-management route that your development team controls. - Webflow: Add the script through custom code, then publish to a staging domain before exposing it to production traffic.
- Wix: Use Velo or the tracking-code panel, taking care that the test doesn't load twice through competing integrations.
- Google Tag Manager: Use one Page View tag with clear firing conditions. Duplicate tags can create repeated assignments and polluted event counts.
- Custom JavaScript: Keep assignment, variation rendering, and conversion tracking separate enough to debug each layer.
The most visible implementation risks are flicker and FOOC, meaning a flash of the original content. Both can undermine the experience and affect Core Web Vitals, especially when the browser paints the control before the variation arrives. Test with throttled connections, cached and uncached sessions, consent accepted and refused, and returning users who already hold an assignment cookie.
QA before inviting real visitors
Use the visual editor to inspect mobile, tablet, and desktop layouts. Check that existing CSS classes, analytics attributes, accessibility labels, and responsive breakpoints remain intact. Exclude internal IP ranges, staging domains, staff accounts, and test orders so your team doesn't contaminate production results.
The Otter A/B staging and configuration guidance is useful when you need a repeatable pre-launch workflow.
Before launch, confirm:
- Consent: The test respects cookie consent and PECR obligations.
- Targeting: Device, geography, audience, and URL rules match the brief.
- Exclusions: Staff, agencies, staging users, and automated traffic are excluded.
- Events: The primary conversion event fires once and is attributed to the correct variant.
- Performance: No render-blocking script, layout shift, flicker, or duplicate installation appears.
A technically clean control and variant are prerequisites. Statistical analysis can't rescue broken assignment or incomplete tracking.
Launching the Experiment and Allocating Traffic
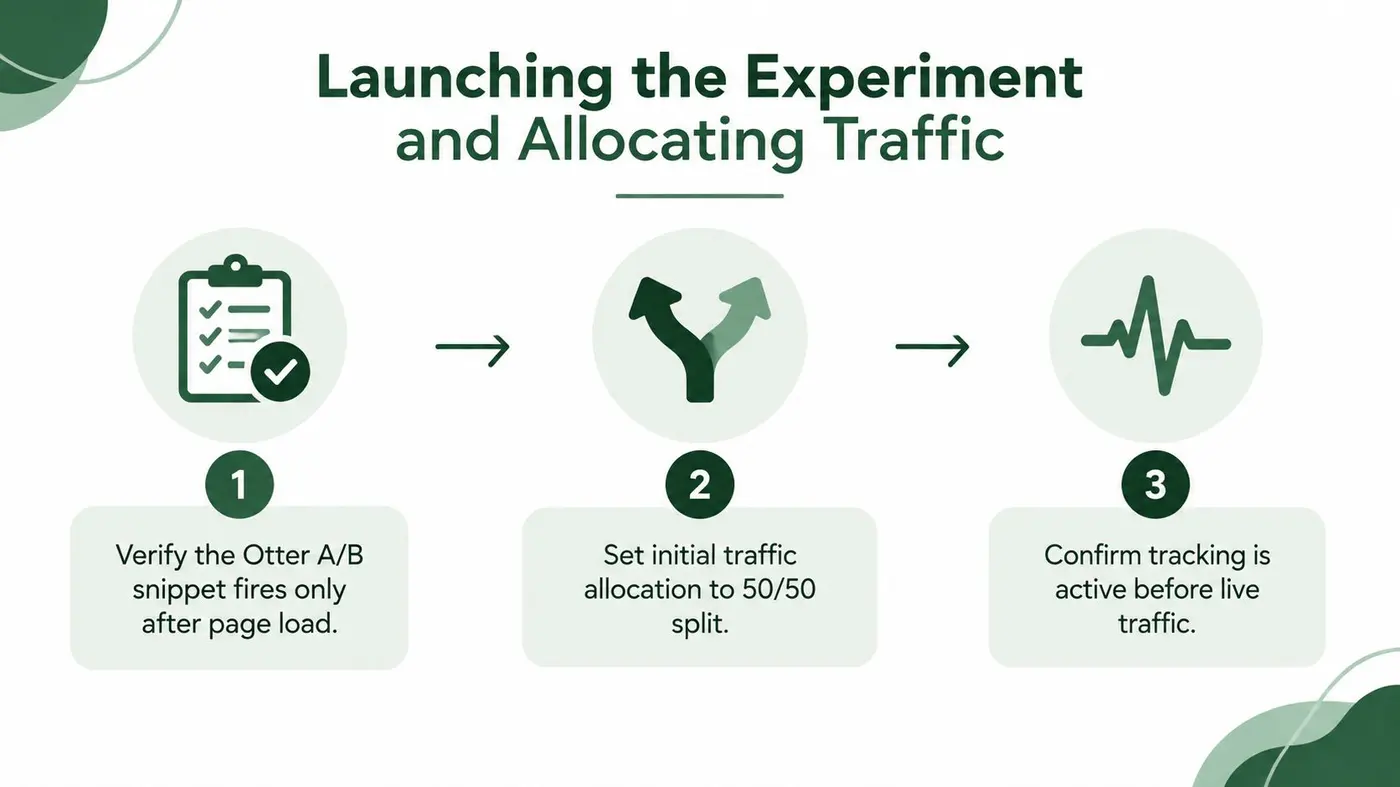
Launch day often adds noise to an otherwise disciplined test. Before opening normal traffic, verify that the snippet loads the assigned experience, the allocation weights total 100, and the conversion event reaches the reporting layer with the correct variant identifier. A saved experiment is not a validated experiment.
Run a controlled QA pass for 24 to 48 hours, as specified in the launch plan. During that period, place test orders or submissions, inspect analytics and server-side records, and compare the control and variant across devices. Treat this window as an implementation check, not part of the results period.
Choose allocation according to risk
A 50/50 split usually produces the clearest comparison because both versions collect observations at the same rate. Use it as the default for a conventional test where the challenger is unlikely to cause serious harm.
A high-risk checkout change may justify a conservative starting split such as 90/10. The smaller group sees the challenger while the team monitors errors, customer complaints, and commercial guardrails. This limits exposure to a poor experience, but it slows learning and leaves the variant with less data. Account for the unequal allocation in the analysis before treating the result as a standard A/B comparison.
A ramped release can increase exposure as confidence builds. Define the ramp in advance and keep it separate from the final decision rule. Repeated allocation changes make interpretation harder and can leave teams arguing over rollout history instead of test evidence.
Pre-commit to the stopping rule
The UK benchmark of 2,408 tests found only 17.4% statistically significant winners and 8.4% statistically significant losers. It also estimated a median requirement of 14,800 sessions per variation to detect a 5% minimum detectable effect on a 3% baseline conversion rate at 95% confidence and 80% power. Those figures explain why an encouraging first day rarely supports a rollout decision.
Practical rule: Record the duration, primary metric, allocation, and stopping condition in the test brief and team Slack channel before results appear.
Use the platform's duration calculator. Don't stop because the dashboard turns green, and don't extend the test indefinitely because the challenger is behind. Record promotions, outages, price changes, and campaign launches. These events may not invalidate the experiment, but they can reduce confidence when applying the result to normal conditions.
Reading Your Results and Calling Significance
A test report normally gives you several related but distinct signals. Lift describes the observed difference between versions. The confidence interval shows how uncertain that estimate is. The p-value indicates how compatible the observed result is with the null hypothesis under the chosen statistical model. Power describes the test's ability to detect an effect of a specified size.
Those terms don't mean the same thing. A result crossing a 95% confidence threshold doesn't mean there's a 95% probability that the variant is better. In a frequentist interpretation, it means that results at least this extreme would be unusual under the null hypothesis, using the analysis threshold selected by the team.
Look at the interval, not just the headline. A narrow interval entirely above zero supports a positive decision. An interval that crosses zero means the data remains compatible with improvement and decline. A negative lower bound matters commercially, especially when the tested page handles purchases or high-intent leads.
A practical reading sequence
- Validate assignment: Check for sample ratio mismatch and confirm that users weren't disproportionately routed to one experience.
- Confirm exposure: Make sure visitors saw the intended variant.
- Check the primary metric: Don't let a secondary click metric replace the pre-registered business measure.
- Inspect the interval: Assess both plausible upside and plausible downside.
- Review guardrails: Compare revenue per visitor, AOV, error rate, refunds, lead quality, or other relevant risks.
- Segment cautiously: Use new versus returning and mobile versus desktop as diagnostic views, not excuses to hunt for a favourable slice.
| Result Type | Confidence Level | What It Means | Recommended Action |
|---|---|---|---|
| Clear positive result | Interval supports improvement and guardrails remain healthy | The variant has credible evidence of helping the primary outcome | Prepare rollout and monitor post-launch behaviour |
| Clear negative result | Interval supports deterioration | The change creates unacceptable risk or friction | Keep the control and document the learning |
| Borderline result | Interval is wide or crosses zero | The direction is interesting, but uncertainty remains | Continue to the planned stopping point or redesign |
| Flat result | No meaningful detectable difference | The tested change didn't move the primary measure materially | Assess whether to ship for non-conversion reasons, iterate, or archive |
Otter's explanation of statistical significance in A/B testing offers further practical context for interpreting these outputs. The most defensible recommendation is often less dramatic than “the winner is B”. It may be “B shows a favourable direction, but the interval still includes no effect, so we won't claim a conversion lift.”
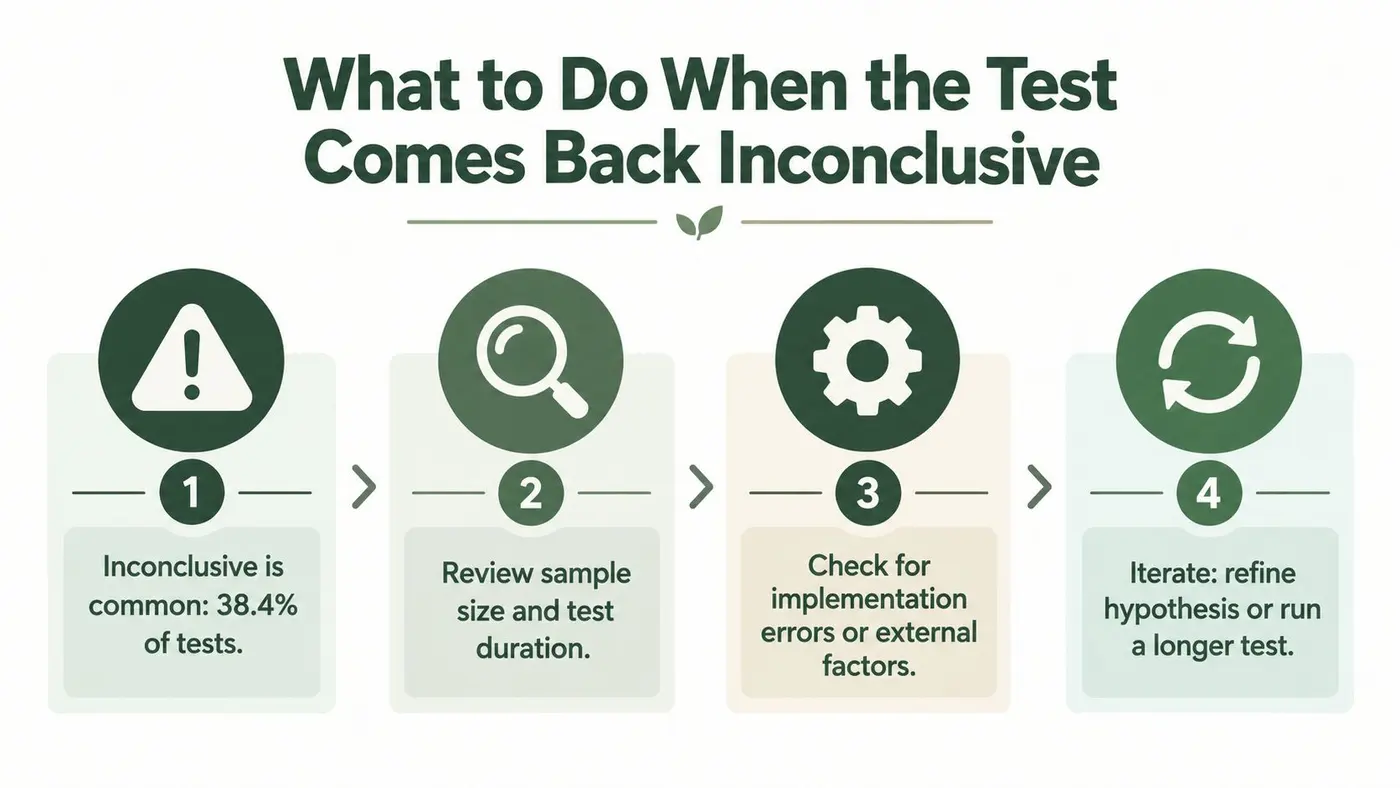
What to Do When the Test Comes Back Inconclusive
An inconclusive test isn't a failed business decision. It's an incomplete answer, and the next action depends on why the answer stayed incomplete.
The UK analysis cited earlier found 38.4% of tests were statistically indistinguishable and 35.8% were inconclusive because the sample was insufficient. A separate supplied research point reports that only 17.4% produced a winning variant, while 74.2% were either inconclusive or showed no detectable difference. The referenced UK contract-market analysis reinforces the need for explicit decision rules rather than a winner-only culture.
Diagnose before deciding
Start with the interval and the planned minimum detectable effect. If the result is flat but the interval rules out a commercially meaningful improvement, the test has answered something useful. You can stop pursuing that idea. If the interval is wide, the test may lack the data needed to distinguish a modest effect from noise.
Then inspect execution:
- Sample size: Did each variation receive enough eligible sessions?
- Duration: Did the test cover normal weekday and weekend behaviour?
- Change strength: Was the variation too subtle to plausibly alter behaviour?
- Audience fit: Did the hypothesis target the people experiencing the problem?
- Instrumentation: Did consent, redirects, event timing, or duplicate events distort the read?
- External context: Did promotions, seasonality, outages, or media activity alter the audience?
Use three decision paths
Ship the variant. This can be reasonable when the directional result aligns with qualitative evidence, the guardrails are healthy, and the implementation is simpler, clearer, or easier to maintain. Don't describe the outcome as a proven conversion uplift. Describe it as a controlled implementation decision made under uncertainty.
Iterate. Sharpen the problem or make the intervention stronger. If a minor copy edit produced a weak positive direction, test a clearer value proposition, better objection handling, or a more relevant audience rather than repeating the same small change.
Stop and archive. A flat result can prevent months of low-value variations. Record what was tested, which audience was exposed, the primary and guardrail outcomes, the interval, and the next recommendation. A learning library turns an inconclusive test into a constraint on future ideas.
The right question isn't “Did B win?” It's “What decision does the uncertainty allow us to defend?”
Never extend a test because stakeholders want a positive answer. Extend it only when the original design says more data could resolve a commercially important uncertainty and the traffic conditions remain comparable.
Rolling Out the Winner and Reporting What You Learned
A statistically credible winner still needs a controlled handover. Don't leave the experiment running indefinitely, and don't rebuild the variation manually from memory. Confirm the final implementation, disable the experiment, and force 100% of eligible traffic to the approved experience once the rollout decision is made.
Watch the live page after release. Check conversion rate, revenue per variant, average order value, errors, customer-service contacts, and Core Web Vitals. The supplied rollout plan recommends monitoring for 7 days so the team can catch latency regressions or tracking issues introduced by the permanent implementation. That monitoring window isn't a new experiment, and it shouldn't be used to rewrite the original test result.
Make the report useful to someone absent from the meeting
A one-page report is enough if it answers the questions a finance director, product lead, or developer will ask:
- Hypothesis: What user problem and behavioural mechanism did the test address?
- Implementation: What changed, on which pages, for which audience?
- Primary result: What happened to the pre-agreed success measure?
- Uncertainty: How wide was the confidence interval, and what did it allow you to conclude?
- Commercial guardrails: What happened to revenue per visitor, AOV, refunds, lead quality, or other relevant measures?
- Segments: Did new and returning users, mobile and desktop visitors, or other planned groups behave differently?
- Decision: Ship, iterate, stop, or run a follow-up test?
- Owner: Who is responsible for release, monitoring, and documentation?
Avoid reporting only the percentage lift. A positive conversion result paired with lower AOV may be commercially weaker than it first appears. Revenue per variant and order value help connect the experiment to the outcome the business funds.
Close the learning loop
Send milestone notifications to the people who need to act. CRO, paid social, lifecycle, merchandising, product, and engineering may all need to adjust their work after a page or message changes. Slack notifications can surface significance milestones, but the report should remain the durable record.
Write the conclusion in plain English: “Reducing delivery uncertainty helped mobile shoppers complete checkout, while order value remained stable.” Then attach follow-up hypotheses. A winning delivery message may enable tests around delivery-choice layout, returns reassurance, or post-purchase expectations. A losing CTA may prevent the team from repeating the same assumption under a different colour.
Otter A/B is one option for teams that want snippet-based setup, variant creation, conversion goals, z-test reporting, and commercial measures such as purchases, average order value, and revenue per variant in one workflow. Whatever tool you use, the operating principle stays the same: a test earns its value through the decision and learning that follow the result.
Otter A/B helps teams run controlled split tests for headlines, CTAs, layouts, purchases, average order value, and revenue per variant without turning every experiment into a development project. Visit Otter A/B to start testing with a lightweight workflow, clear goals, and reporting your stakeholders can use.
Stop guessing
Ready to start testing?
Set up your first A/B test in under five minutes. No credit card required.
- 14-day free trial
- No credit card required
- Cancel anytime