Conversion Rate Optimization Shopify: A Practical Playbook
Boost your store with conversion rate optimization Shopify tactics. Learn audits, A/B testing with Otter A/B, and metrics that drive real revenue growth.
More traffic isn't a conversion strategy, and more A/B tests won't rescue a Shopify store that hasn't identified where shoppers are dropping out. Button-colour experiments can produce neat charts while product pages leave basic questions unanswered, mobile shoppers struggle to select variants, or checkout hides delivery costs until the final step.
Effective conversion rate optimization for Shopify starts with diagnosis. The job is to connect device, category, traffic intent, and funnel stage to completed purchases and revenue per visitor. UK benchmarks make that especially important because a blended sitewide average can conceal a serious mobile or category-specific problem.
Why Most Shopify CRO Programmes Underperform
Most underperforming CRO programmes don't fail because the team lacks ideas. They fail because the team tests the most visible element instead of the most expensive problem.
A headline is easy to change, so it attracts attention. Checkout friction is harder to isolate, product merchandising requires judgement, and traffic quality can expose uncomfortable acquisition issues. Yet those areas often determine whether a visitor progresses from product discovery to purchase. If a store has weak intent traffic, a better CTA won't create demand. If shoppers add products but abandon during payment, a homepage experiment is unlikely to recover the lost revenue.
Shopify gives merchants access to useful funnel signals, but those signals need interpretation. Separate visitors by device, landing page, source, category, and new versus returning status before deciding what to test. A mobile product page visited through a broad social campaign represents a different conversion problem from a desktop product page reached through branded search.
Practical rule: Don't ask, “What should we test next?” Ask, “Which funnel stage is costing us the most completed orders?”
The difference between activity and progress
Teams often report clicks, engagement, or add-to-cart activity because those metrics move sooner than purchases. They're useful diagnostic signals, but they aren't sufficient experiment goals. A variant that attracts more clicks yet produces fewer completed orders has made the business worse, not better.
Shopify's UK guidance defines ecommerce conversion rate as orders divided by visits, multiplied by 100, while its broader benchmark places typical ecommerce conversion rates between 2.5% and 3% in its updated UK guidance. Read that alongside UK Shopify CRO benchmarks, where the average Shopify store is often reported at about 1.4%, and the gap between ordinary and strong performance becomes clear. The relevant question isn't whether a test creates interaction. It's whether it moves a store towards profitable purchasing behaviour. Shopify's UK conversion-rate guidance provides the calculation and wider context.
A useful starting resource is this guide to proven Shopify conversion rate tips, particularly when a team needs a practical list of store fundamentals. Use such advice as a hypothesis source, not as a substitute for store-specific evidence.
CRO is a system, not a list of tricks
A disciplined programme has four parts:
- Measurement: Define sessions, add-to-cart, checkout completion, purchases, average order value, and revenue per visitor consistently.
- Diagnosis: Locate the largest drop-off by device, category, and traffic intent.
- Experimentation: Test a specific friction hypothesis with a business outcome attached.
- Learning: Record what changed, what happened, and where the result applies.
This approach also prevents overreaction to normal variation. A low-volume store may see a dramatic-looking movement that disappears when traffic changes. A high-volume store may find that a small improvement on a heavily visited mobile PDP matters more than a larger change on a low-traffic page.
The best Shopify CRO programmes therefore feel less like a design contest and more like revenue operations. They protect the customer experience, challenge assumptions, and make each experiment answer a question the previous data has raised.
Setting Realistic Shopify Conversion Benchmarks
A single “good Shopify conversion rate” is a poor target. Store category, product complexity, price point, traffic intent, and device mix all change the meaning of the headline number. Benchmarking should help you choose priorities, not pressure you into copying an irrelevant average.
UK-focused Shopify benchmark posts commonly place the median store around 1.4% to 1.9%, with the top 20% at 3.2% or higher and the top 10% at 4.7% or higher. Those bands are useful as directional performance tiers, but they aren't promises or universal targets. A considered purchase with high product complexity may need a different path from a replenishment product with strong repeat demand.
A regional reference point measured 2.03% conversion across UK and Irish stores in June 2026, while commonly reported desktop conversion sat around 3.0% to 4.2% and mobile conversion around 1.5% to 2.3%. The regional figure and device ranges are reported in UK and Irish ecommerce conversion benchmarks. Treat them as context for segmentation rather than as a scorecard for every Shopify merchant.
Segment before setting a target
Device differences deserve immediate attention. UK-focused benchmark reporting suggests mobile accounts for about 70% of UK ecommerce visits, while mobile conversion is roughly 1.1% to 1.8%, compared with about 2.4% to 3.9% on desktop. Those ranges appear in UK conversion benchmarks for Shopify merchants. A store can appear healthy on desktop while losing a large share of potential revenue on mobile.
Build a benchmark view with at least these cuts:
| Segment | Question to answer |
|---|---|
| Device | Is mobile underperforming after accounting for traffic source? |
| Category | Does product complexity or intent explain the rate? |
| Source | Are paid social visitors behaving differently from returning or branded visitors? |
| Funnel stage | Is the major loss before add-to-cart, between cart and checkout, or during payment? |
Category context matters just as much. UK ecommerce conversion has been reported at approximately 0.53% in electrical and commercial equipment and 4.82% in arts and crafts, with an overall market average of 1.51% in January 2026, according to UK ecommerce category conversion research. A low rate in a complex equipment category may reflect research-heavy buying behaviour. The same rate in a straightforward hobby category could indicate a serious merchandising or trust problem.
Use benchmarks to choose the next question
Don't chase the top-decile number before fixing obvious leakage. First establish whether your store is below the relevant market context, then compare device and category segments. A store near the regional reference point may have more upside from checkout clarity than from a broad redesign, while a store with strong desktop performance and weak mobile performance should prioritise small-screen PDP and checkout work.
Benchmarks are starting points. Your own segmented revenue data decides what deserves investment.
Running a Focused Shopify CRO Audit
A useful audit doesn't begin with colour palettes or competitor screenshots. It begins with a funnel map and a list of observable symptoms.
Shopify analytics should give you the base journey from visit to product view, add-to-cart, checkout, and purchase. Add behavioural evidence from session recordings, customer support questions, search terms, and device testing. You're looking for a mismatch between shopper intent and store response.
Start with the largest measurable drop
Across large ecommerce store panels, median add-to-cart is about 4.6% and average checkout completion is around 45%, as reported by ecommerce conversion benchmark analysis. These figures aren't a universal target for your store, but they help frame the journey. A weak add-to-cart rate points towards discovery, product relevance, value communication, or PDP friction. A healthy add-to-cart rate paired with weak checkout completion points elsewhere.
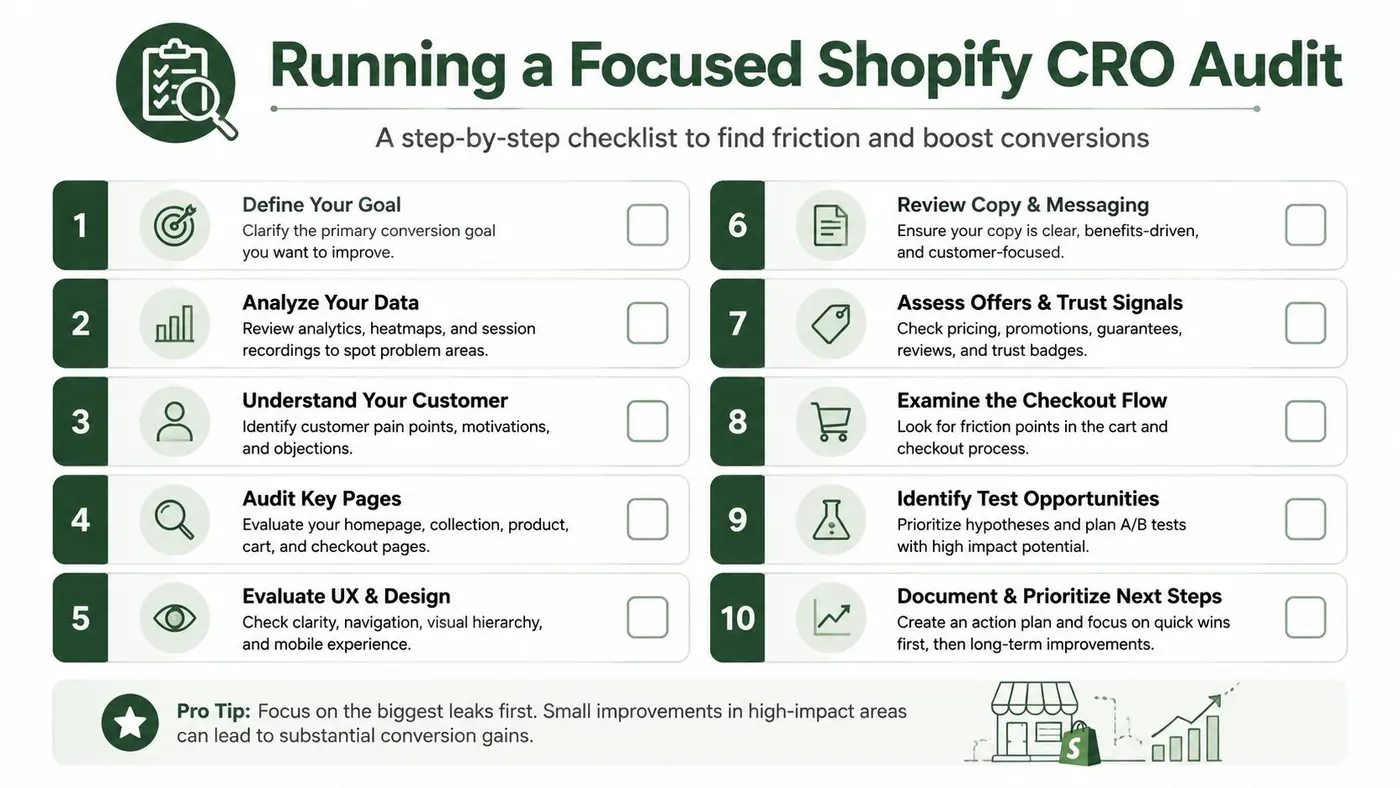
Use this audit sequence:
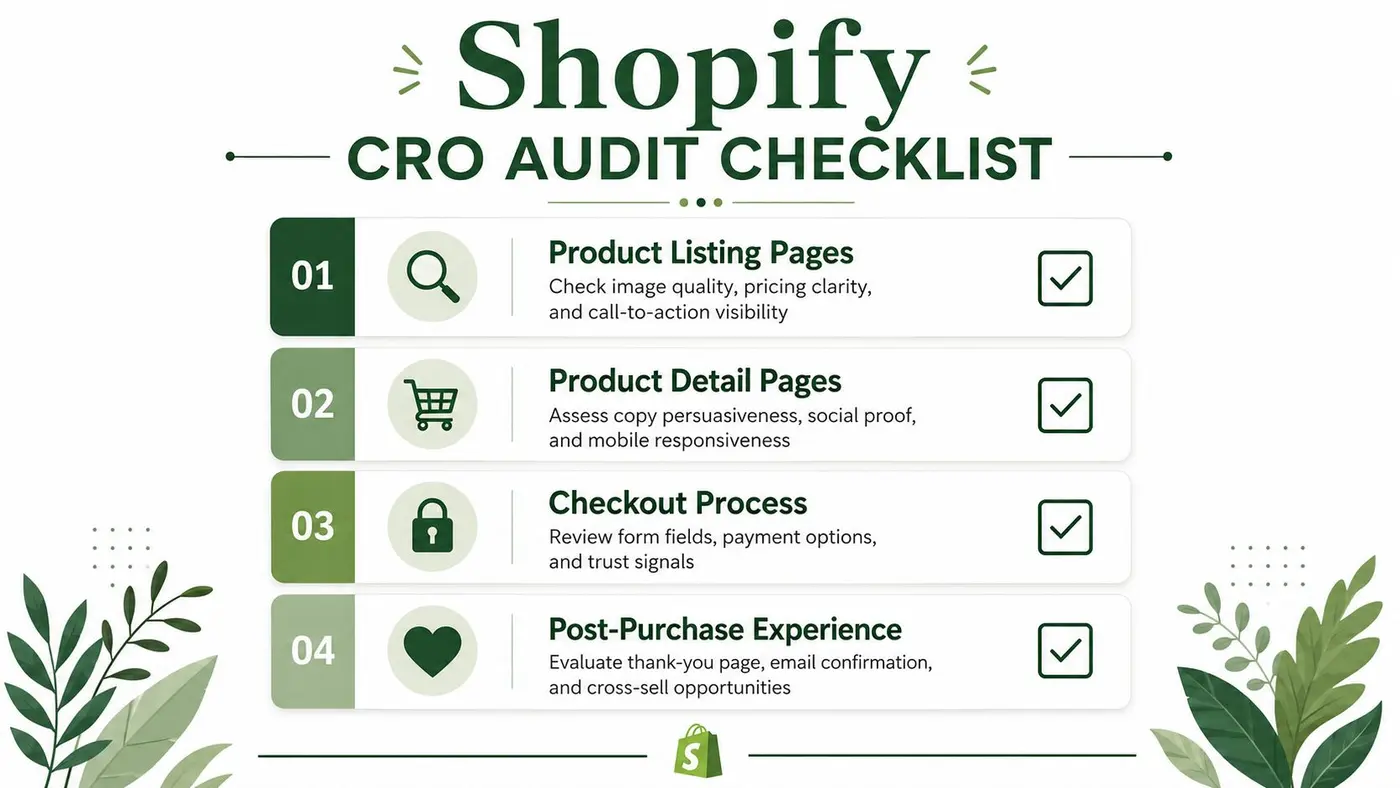
- Product listing pages: Check whether category cards show clear pricing, useful imagery, variant information, stock status, and an obvious route to the product. Filter and sort controls should help shoppers narrow choices instead of forcing repeated backtracking.
- Product detail pages: Review the first mobile viewport, image quality, variant selection, benefit-led copy, delivery timing, returns, reviews, and the position of the primary CTA. If shoppers need to open several accordions to answer basic purchase questions, the page is making them work too hard.
- Cart and basket: Confirm that quantities, variants, delivery expectations, promotional conditions, and totals are easy to understand. A cart drawer can support continued browsing, but it shouldn't obscure the next action.
- Checkout: Test guest purchase, address entry, payment methods, error handling, discount-code behaviour, and cost transparency on an actual phone. Record every hesitation and failed tap.
- Post-purchase: Check confirmation clarity, order information, delivery communication, and relevant follow-up opportunities. The transaction isn't the end of the customer experience.
Diagnose symptoms rather than pages
A strong add-to-cart rate with weak checkout completion usually means the store has created product interest but failed to maintain confidence through basket and payment. A weak add-to-cart rate with high product-page engagement may indicate that copy or imagery creates curiosity without resolving objections.
Review the same path by device. Mobile shoppers may face cramped selectors, sticky bars covering content, slow-loading reviews, or form fields that trigger the wrong keyboard. Desktop shoppers may encounter different issues, such as unclear comparison information or excessive empty space that pushes delivery reassurance below the decision point.
Turn observations into hypotheses
Write each finding as a cause-and-effect statement:
- “If delivery timing appears beside the CTA on mobile, shoppers will have less uncertainty before adding the product.”
- “If the cart shows the remaining amount for a delivery threshold, more customers will understand the commercial incentive.”
- “If payment options appear earlier, checkout users will know whether their preferred method is supported.”
Avoid bundling several changes into one test unless the hypothesis concerns the combined experience. Otherwise, a result won't tell you which intervention mattered.
Designing and Launching Experiments with Otter A/B
Good testing starts with prioritisation. Score ideas against likely revenue impact, evidence strength, implementation effort, and risk to the customer journey. A checkout transparency test may deserve priority over a homepage redesign because it addresses shoppers who have already shown purchase intent. A mobile PDP layout test may outrank a desktop headline test when mobile is the dominant traffic source and the device gap is clear.
Define the hypothesis before touching the theme:
A test should explain a decision, not decorate a dashboard.
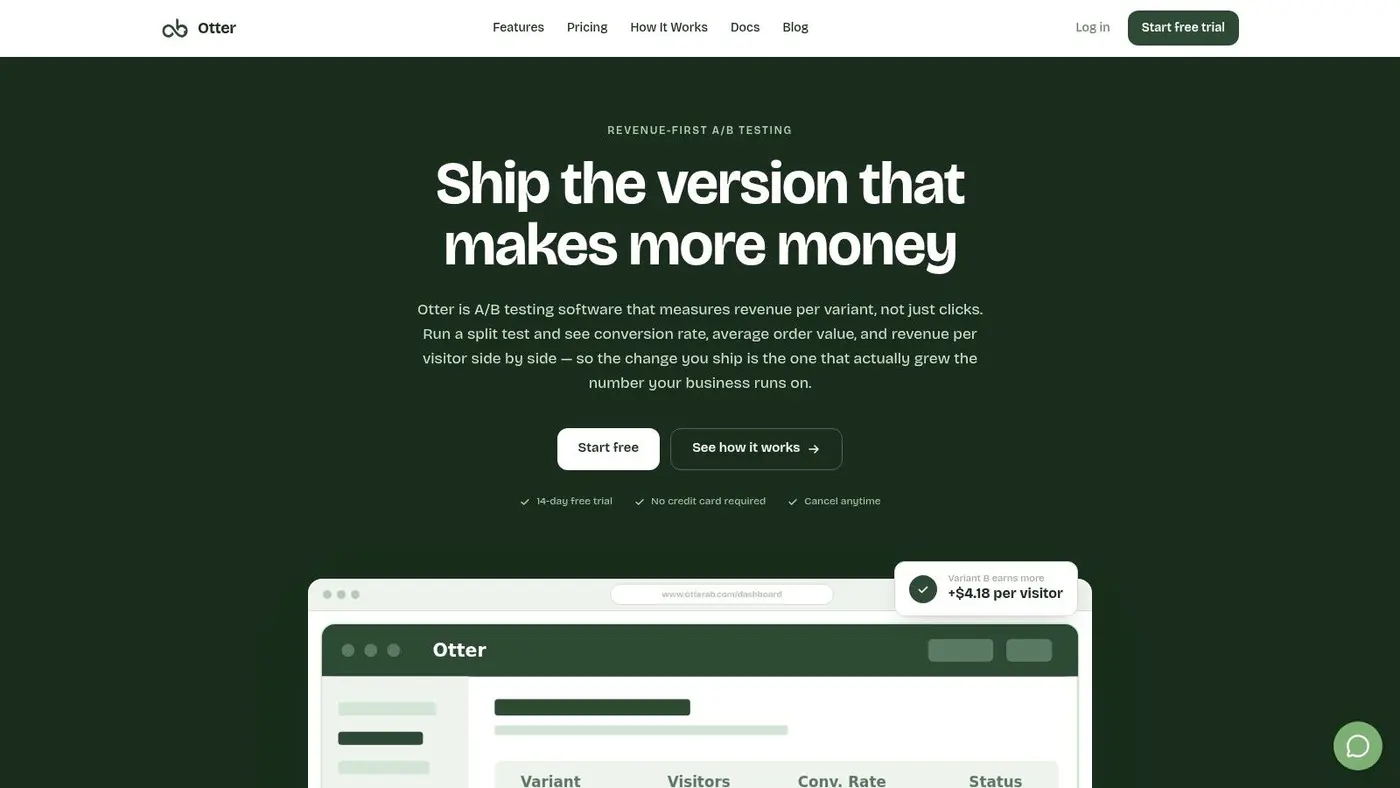
Otter A/B uses a 9KB SDK that loads in under 50ms, supports zero flicker, and reports 99.9% uptime. Its frequentist z-test engine calculates statistical significance at a 95% confidence threshold. Those product specifications matter when a team needs experiments to run without introducing a visible delay or layout shift, but implementation still needs a proper QA pass across Shopify themes, apps, browsers, and checkout states.
Build a clean variant
Choose one primary change and keep the control intact. Useful Shopify tests include:
- Value proposition: Make the headline answer the main category-specific objection, such as fit, delivery, compatibility, or ease of use.
- CTA language: Compare action wording that reflects the shopper's decision, while keeping placement and surrounding information stable.
- PDP hierarchy: Move delivery, returns, reviews, or sizing guidance closer to the price and CTA when evidence shows hesitation at that point.
- Mobile layout: Test a compact image gallery, variant selector, or sticky purchase control against the existing arrangement.
- Checkout messaging: Clarify payment, delivery, and returns without adding promotional noise.
Don't change the headline, hero image, CTA, review position, and shipping message simultaneously if you want a transferable lesson. A bundled redesign can win, but you won't know which component created the outcome or whether the result applies to another category.
Configure goals around commercial outcomes
Set the primary goal to a completed purchase where possible. Add secondary goals such as add-to-cart, checkout completion, average order value, and revenue per visitor. A click can explain behaviour, but purchase data decides whether the change deserves rollout.
For a practical implementation walkthrough, see how to A/B test Shopify pages. The setup should include variant allocation, audience rules, device segmentation, and a clear start condition. QA the control and variant before launch, especially when apps inject reviews, recommendations, subscriptions, or promotional bars into the same template.
A test should run until the data can distinguish signal from noise. Don't stop because one variant leads briefly, and don't keep a losing variant live after the result is clear just because the original idea felt strategically attractive.
Teams using Otter A/B can create variants, define conversion goals, split traffic, and report revenue-related outcomes through a lightweight testing setup. It fits the narrow job of answering which on-site version performs better, but the quality of the answer still depends on the hypothesis and measurement design.
Review implementation impact after launch. A test that improves orders but slows the experience, breaks a subscription selector, or creates support issues needs a broader business decision rather than an automatic rollout.
Tracking the Metrics That Actually Matter
Conversion rate is essential, but it isn't enough to manage a Shopify CRO programme. It compresses a complex journey into one ratio and can hide changes in order value, traffic mix, or product demand.
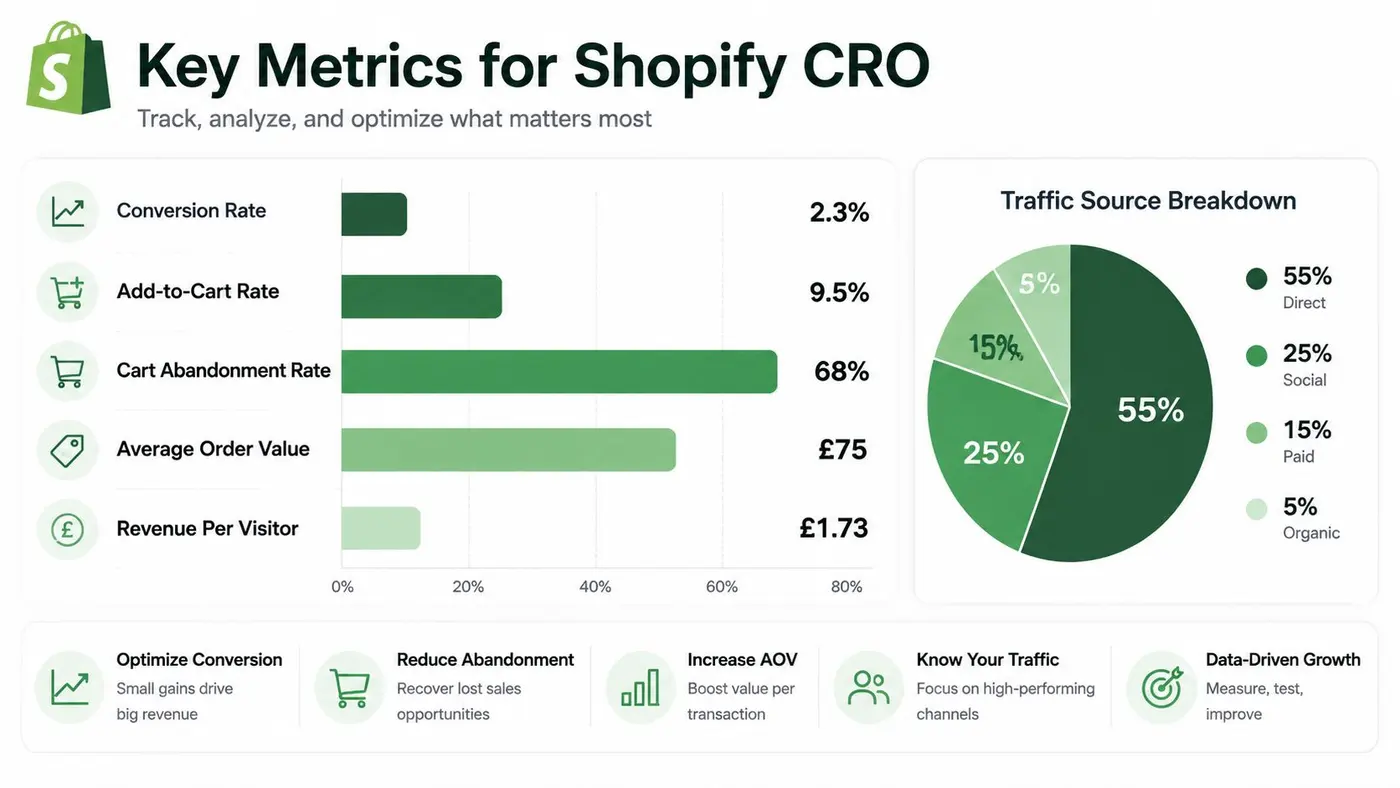
Use a metric hierarchy. Purchases and revenue per visitor should usually anchor the decision. Average order value shows whether a variant changes basket composition. Add-to-cart and checkout completion help explain why a result happened. Engagement metrics can support diagnosis, but they shouldn't decide a winner.
Read the funnel as a connected system
Suppose a variant increases add-to-cart but reduces checkout completion. Calling it a success would reward the first visible action while ignoring the later loss. Conversely, a variant may produce a modest purchase-rate movement while increasing average order value enough to improve revenue per visitor.
Track these relationships:
| Metric | What it tells you |
|---|---|
| Add-to-cart | Whether product interest becomes basket intent |
| Checkout completion | Whether basket intent survives payment and form friction |
| Purchase conversion | Whether the full journey produces an order |
| Average order value | Whether the variant affects basket depth or product mix |
| Revenue per visitor | Whether the experience creates more commercial value from traffic |
Use consistent attribution and compare like with like. A traffic-source change can make a variant appear stronger even when the page did nothing. Device mix can create the same distortion. Break down results by mobile and desktop, but avoid declaring a segment winner when the sample is too thin to support a reliable decision.
Statistical significance is a decision aid
A confidence threshold doesn't replace judgement. It tells you how strongly the observed difference supports a conclusion under the test's assumptions. Before launch, define the primary metric, the audience, the minimum runtime or traffic requirement you need for a credible read, and the conditions that would invalidate the test.
Don't peek at the dashboard repeatedly and stop at the first favourable movement. Also record implementation changes, campaigns, stock issues, pricing changes, and unusual traffic events. Without that context, a result may be technically significant but commercially misleading.
For event collection and implementation control, Google Tag Manager for Shopify can help teams organise measurement through a central tagging workflow. The important point is governance, not adding another tool. Every event should have a defined name, trigger, owner, and business purpose.
Merchandising can also create category-specific friction that ordinary analytics won't explain. Apparel retailers, for example, may need better fit guidance before testing a CTA. An AI sizing app for apparel retailers is relevant when uncertainty about body measurements is a likely purchase barrier, but it should be assessed against completed orders and revenue, not interaction volume alone.
Realistic Shopify CRO Scenarios and Outcomes
A fashion store with heavy mobile traffic shouldn't begin by testing its desktop homepage. Its first audit should examine mobile product discovery, image loading, variant selection, size guidance, delivery information, and the visibility of the purchase action. If shoppers view several images but rarely add products, the team can test whether clearer fit information and more prominent reassurance resolve uncertainty.
The result isn't guaranteed, and no responsible practitioner should promise a fixed uplift before testing. The likely outcome is better prioritisation. The store learns whether the issue is product confidence, mobile usability, traffic quality, or price resistance, then allocates development time to the strongest evidence.
A homeware store with checkout leakage
A homeware brand may have strong product interest because customers add bulky items to the basket, then abandon when delivery conditions become clear. The audit should compare cart creation with checkout completion, inspect delivery messaging, and test the clarity of estimated costs before payment.
A useful variant could bring delivery expectations and returns information into the basket step, while another might simplify the payment presentation. The business should judge the result through completed purchases, average order value, and revenue per visitor. Guidance on Shopify checkout optimisation is useful for generating implementation ideas, but the brand still needs to validate each change against its own delivery model.
A specialist hobby store using the wrong benchmark
A niche arts and crafts merchant shouldn't compare its store directly with an electrical equipment retailer. UK category data reports conversion ranging from about 0.53% in electrical and commercial equipment to 4.82% in arts and crafts, with the overall market average at 1.51% in January 2026. Those figures are documented in the UK ecommerce category benchmark research.
For the hobby store, the audit might focus on product availability, project guidance, bundle clarity, and related-item discovery. A low conversion rate could reflect weak category intent, but it could also mean shoppers can't understand which materials work together. The right experiment may be a project-led product grouping rather than another button test.
These scenarios share a principle: the outcome is not just a higher percentage. It's a clearer explanation of where revenue is leaking and a repeatable way to correct it.
Building a Repeatable 90-Day CRO Rhythm
A useful 90-day rhythm keeps diagnosis and testing connected.
First, establish the baseline. Review device, category, source, add-to-cart, checkout completion, purchases, average order value, and revenue per visitor. Record technical changes and commercial events that could affect interpretation.
Next, build and rank the backlog. Each idea needs a hypothesis, target segment, primary metric, implementation owner, and expected risk. Launch the highest-evidence test first, not the most exciting one.
Then, run a review cadence. Check experience quality during the test, wait for a credible result, document the learning, and decide whether to roll out, iterate, or retire the variant. Keep marketing, merchandising, design, and engineering involved so the backlog reflects the whole customer journey.
Avoid blended averages, premature winners, click-based decisions, and tests that change too many variables at once. Start with one device-category funnel segment, identify its largest leak, and connect the first experiment to completed revenue.
Otter A/B supports Shopify teams with lightweight A/B testing for headlines, CTAs, and layouts, alongside goals such as purchases, revenue, average order value, and revenue per visitor. Visit Otter A/B to set up a focused experiment and turn your next Shopify CRO decision into a measurable business test.
Stop guessing
Ready to start testing?
Set up your first A/B test in under five minutes. No credit card required.
- 14-day free trial
- No credit card required
- Cancel anytime