A Clear P Value Explanation for A/B Testing
Get a clear p value explanation for A/B testing. Understand what it means, how to interpret it, and avoid common mistakes to make data-driven decisions.
You're looking at an A/B test dashboard, and Variant B is ahead. The lift looks big enough to make everyone in Slack excited. Design wants to push it live. Paid media wants the winning page before the next campaign starts. Your testing tool, however, puts a small obstacle in the way: p value 0.21.
That's the moment when a lot of teams stop being scientific and start being hopeful.
A clear p value explanation is key. Not the classroom version with dense notation and abstract language. The version that helps you decide whether to ship the variant, keep the test running, or admit you don't know yet. For CRO teams, the p value isn't trivia. It sits right between observation and action.
Why Your A/B Test Results Depend on P Values
Your team has seen this movie before. A variant jumps ahead on the dashboard by lunchtime, the lift looks strong, and pressure builds to call a winner before the week ends.
That is exactly when p values start to matter.
In CRO, you are rarely deciding whether a result looks encouraging. You are deciding whether to spend development time, change the user journey, and record a lesson in your testing program that other teams will use later. A p value helps separate a result that is merely exciting from one that is reliable enough to act on.
Suppose a new headline is beating the control after the first few hundred visitors. That lead might reflect a real improvement. It might also be the testing equivalent of flipping heads several times in a row. Short runs can look meaningful even when nothing has really changed underneath.
P values help you handle that uncertainty with discipline.
The number that asks a better business question
A dashboard shows what happened in your sample. A p value helps you judge whether that observed gap is strong evidence or the kind of wobble you should expect from random variation.
That distinction matters because A/B tests are not academic exercises for CRO teams. Each launch affects revenue, roadmap priorities, and trust in the experimentation program. If you ship a false winner, the cost is not just a disappointing result next month. Product and marketing teams may start treating testing as a way to justify hunches instead of a way to learn what changes customer behaviour.
A useful analogy is quality control on a production line. If one item looks faulty, you do not shut the factory based on a glance. You check whether the signal is strong enough to suggest a real problem rather than normal variation. P values serve a similar role in testing. They slow down snap decisions so your team does not mistake noise for insight.
Practical rule: A result is decision-ready only when the evidence is strong enough to justify the cost of being wrong.
Why CRO teams should care
Modern A/B testing tools make it easy to watch results move in real time. That convenience creates a trap. If stakeholders keep peeking at the dashboard and calling tests early when the graph looks good, false positives become more likely. The American Statistical Association has warned that p-values are often misunderstood and should not be used as a simple pass or fail stamp without context, study design, and prior evidence (ASA statement on p-values).
For a CRO team, that warning has a direct operational meaning. The p value is not there to make testing slower or more bureaucratic. It protects the business from acting on lucky spikes, underpowered samples, and premature wins that vanish after rollout.
Teams that treat p values as part of a decision process usually build cleaner experiment logs, make fewer reactive launches, and learn faster over time. Teams that ignore them often collect a graveyard of "winners" that never win again.
That difference is why p values sit so close to the center of A/B testing decisions.
What Is a P Value in Simple Terms
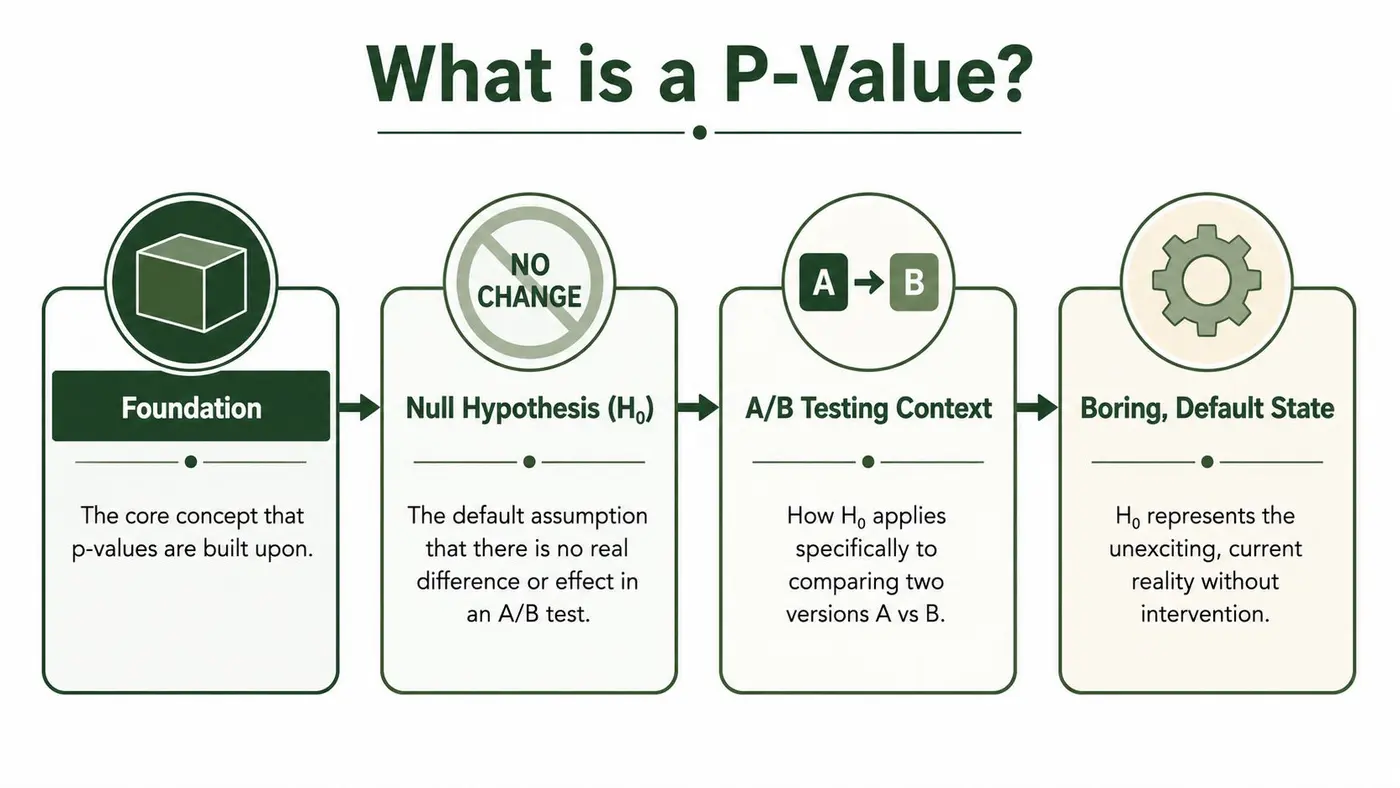
Before you can interpret a p value, you need to understand the assumption sitting underneath it. That assumption is the null hypothesis.
In A/B testing, the null hypothesis says the dull, boring thing: there is no real difference between A and B. Your new button text, new hero image, or new checkout layout doesn't change the outcome. Any difference you observed came from ordinary randomness in the sample of visitors who happened to enter the test.
That sounds pessimistic, but it's useful. Statistics starts sceptical on purpose.
The courtroom analogy
The easiest way to think about the null hypothesis is a courtroom. A defendant starts not guilty. That doesn't mean the court has proved innocence. It means the system requires evidence before it treats the person as guilty.
An A/B test works in a similar way.
- Control versus variant: The test begins by assuming neither version is different.
- Observed gap: You collect data and see some difference in outcomes.
- Question for the data: Is that difference strong enough to challenge the default assumption of no real effect?
The p value is part of that evaluation. It doesn't declare your variant “good”. It tells you how surprising your observed result would be if the null hypothesis were true.
The plain-English definition
Here's the cleanest version:
If there were really no difference between A and B, the p value is the probability of seeing a result at least as extreme as the one your test produced.
That's why low p values matter. A low p value means the result would be fairly surprising if nothing were different. So the data gives you reason to doubt the null hypothesis.
A high p value means the result would not be surprising under the “no real difference” assumption. In that case, your test hasn't given you enough evidence to move away from the default view.
What marketers usually hear wrong
Many people translate p value into “chance the variant is better”. That feels intuitive, but it isn't what the number means.
A p value does not answer:
- “What's the probability B wins?”
- “What's the probability the test is right?”
- “What's the chance the control and variant are the same?”
It answers a narrower question about how compatible your observed data is with the no-difference assumption.
That's why p values often feel slippery at first. They're indirect. But once you grasp that indirect logic, the concept becomes much easier to work with in real tests.
How to Interpret P Values in Your A/B Tests
Your dashboard shows Variant B up by 9%. Slack starts buzzing. Someone asks if you can ship it today.
This is the moment where p values matter in CRO. The raw lift tells you what happened in your sample. The p value helps you judge how much trust that result has earned before you turn it into a business decision.
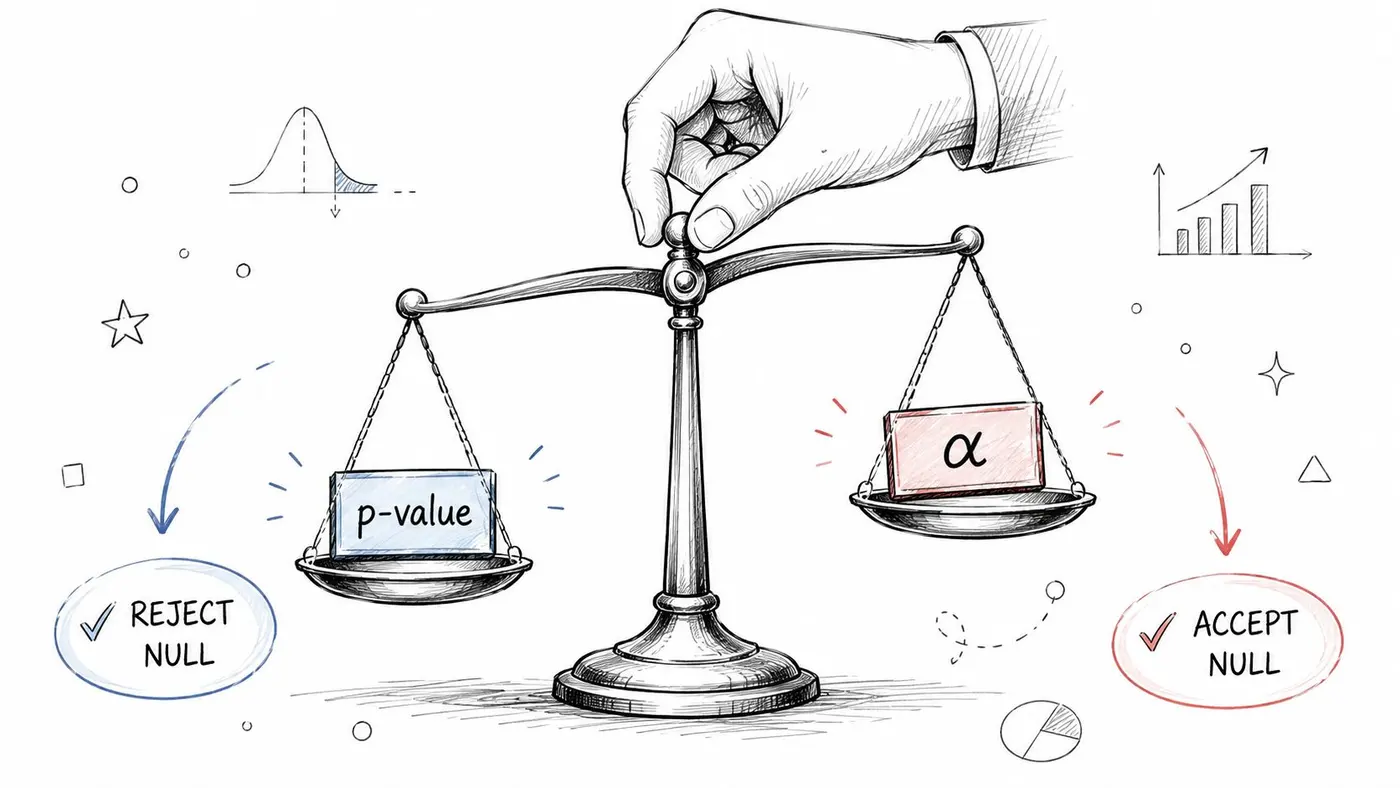
For many A/B testing programs, the working threshold is 0.05, also called alpha. In practical terms, that is the cutoff your team uses to decide whether the observed difference is strong enough to treat as more than ordinary test noise.
The decision rule
Here is the basic read:
- If p is below 0.05: the result is statistically significant under that threshold.
- If p is above 0.05: the test has not produced enough evidence to support a winner claim.
That sounds simple, but the business meaning is where teams often slip.
A low p value does not mean “launch without thinking.” It means random variation is a less convincing explanation for the gap you saw. A high p value does not mean “Variant B failed.” It means your evidence is still too weak to separate signal from noise with enough confidence.
A CRO-style example
Say you are testing a product page CTA. Variant B is showing a lift in conversions, and the number looks promising in the tool.
Now add the p value.
If the p value is 0.03, your result crossed a common decision threshold. For a CRO team, that usually means you can treat the difference as credible enough to keep evaluating for rollout. You would still sanity-check the effect size, segment consistency, and implementation risk, but the result has statistical support.
If the p value is 0.18, the dashboard may still show B ahead, but you should read that lead the way you read an early score in a long match. Interesting, not decisive. Shipping on that basis can turn a temporary swing into a costly product change.
That is why experienced experimentation teams ask a stricter question: has this test produced enough evidence to justify action?
What this means for your launch decision
P values work like a quality-control gate. They do not choose your winner for you. They help you avoid treating weak evidence as proof.
| Test output | Operational meaning |
|---|---|
| Low p value | The result has cleared your statistical evidence threshold. You can evaluate whether the lift is large enough and durable enough to matter |
| High p value | Keep the result in the “interesting but unproven” bucket. Do not call a winner yet |
| Borderline result | Recheck sample size, test duration, tracking quality, and whether your team peeked too often |
That last row matters more than many marketers expect. A p value near your cutoff can flip with a little more data, especially in tests with low traffic or small effects. If your team checks the dashboard every few hours and is tempted to stop as soon as the number dips under 0.05, review the basics of false positive risk in A/B testing.
How strong teams read the number
Junior teams often treat p values like a green light. Strong CRO teams treat them like one input in a launch review.
A practical reading process looks like this:
- Check whether p is below your pre-set threshold.
- Confirm the effect is commercially meaningful. A tiny lift can be statistically significant and still not justify design or engineering work.
- Check test quality. Bad tracking, uneven traffic splits, or segment imbalance can make a neat-looking p value less trustworthy.
- Decide the action. Launch, keep running, or archive the test as inconclusive.
That sequence keeps the statistic connected to its core purpose, which is making better decisions with controlled risk.
A short explainer can help if you prefer a visual walk-through:
The practical takeaway
For A/B testing teams, the p value is not a trophy and not a verdict. It is evidence about whether the apparent winner has done enough to earn belief.
In other words, it helps you separate “the dashboard looks exciting” from “this result is credible enough to use in a business decision.”
Common P Value Misinterpretations to Avoid
Most p value problems in CRO don't come from calculation errors. They come from interpretation errors. Teams read too much into the number, or they ask it to answer a question it was never designed to answer.
The safest habit is to separate what the p value means from what you wish it meant.
P Value interpretations correct vs incorrect
| Common Misconception | The Correct Interpretation |
|---|---|
| A p value tells me the probability that B is better than A | A p value tells you how surprising your observed result would be if there were no real difference |
| A non-significant result proves there is no effect | It means you don't have enough evidence to reject the no-difference assumption |
| A very small p value means the impact is large | Statistical significance and business importance are different questions |
| Passing the threshold means the result is certain | It means the evidence crossed a decision line, not that uncertainty vanished |
| If one variant is significant, I can ignore all the other tests I ran | Multiple tests create more opportunities for chance findings and need extra caution |
The most dangerous misunderstanding
The biggest trap is treating the p value like a direct probability statement about truth. Marketers often hear “significant” and mentally convert it into “proven”. That's too strong.
A p value doesn't tell you the probability that the null hypothesis is true. It doesn't tell you the probability your idea worked. It tells you how compatible the observed data is with the null hypothesis.
That sounds subtle, but in practice it changes decisions. If you think significance means proof, you'll ship too aggressively. If you understand it as evidence against a default assumption, you'll behave with the right amount of caution.
Significant doesn't always mean important
CRO teams also confuse statistical significance with business significance.
A result can be statistically significant and still not matter much to the business. Maybe the effect is tiny. Maybe it doesn't justify design debt. Maybe it adds complexity to the page for a gain no customer would notice.
When you need a sharper understanding of false positives in testing programmes, this guide on false positive rate in experimentation is a useful companion.
A p value helps answer “Is this likely to be noise?” It does not answer “Is this worth implementing?”
That second question needs judgement. You have to weigh the observed effect, implementation cost, strategic fit, and downstream impact on revenue or user experience.
How Sample Size and Effect Size Influence P Values
A p value doesn't appear out of nowhere. It reflects a relationship between the size of the effect you observed and the amount of data behind it.
That's why a proper p value explanation for CRO teams has to include sample size. Without it, people expect small tests to produce certainty and then get frustrated when the numbers refuse to cooperate.
Why the same lift can lead to different confidence
Suppose two teams both test a new checkout message.
One team sees a small observed gap after limited traffic. The other sees a similar pattern after much more traffic. Even if the direction is the same, the second team usually has a stronger basis for judgement because there's more information in the sample.
Small samples are jumpy. They produce unstable early results. Large samples smooth out some of that volatility and make it easier to tell whether the difference is persistent or accidental.
Effect size changes the game
Effect size means the magnitude of the difference between versions.
A dramatic change is easier to detect than a subtle tweak. If your variant changes user behaviour in an obvious way, the signal stands out more clearly. If the change is minor, random variation can easily obscure it unless you collect enough traffic.
That's why tiny wording tests often need patience. The effect may exist, but the data won't necessarily reveal it quickly.
The practical relationship
Consider it this way:
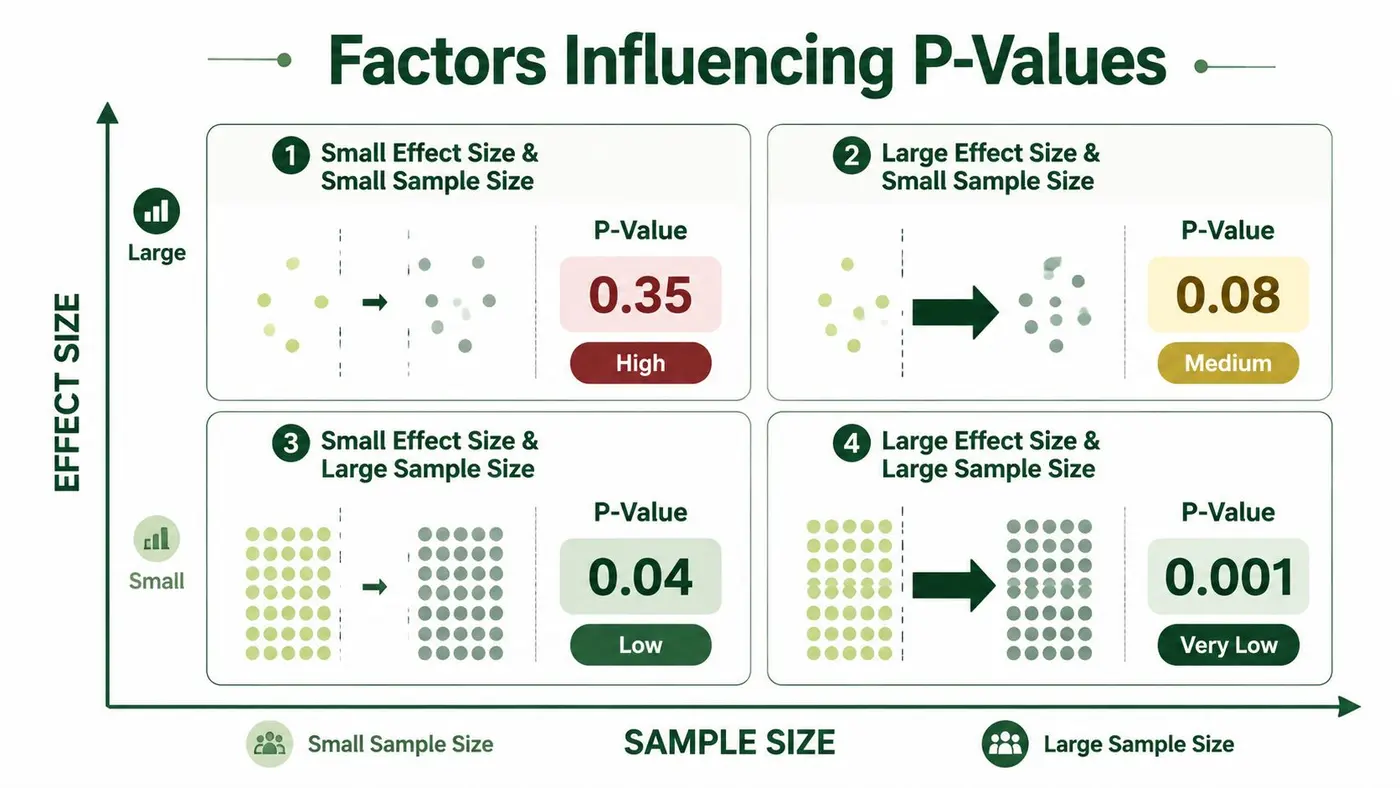
- Small effect, small sample: hard to detect, lots of ambiguity
- Large effect, small sample: easier to notice, but still unstable
- Small effect, large sample: possible to detect, but you need enough data
- Large effect, large sample: strongest setup for clear evidence
If your team skips sample planning, you'll keep reading too much into noisy dashboards. A better approach is to estimate how much traffic you need before the test starts. This guide on how to calculate sample size for A/B tests is worth bookmarking.
Working habit: Before launch, decide what size of change would actually matter to the business. Then size the test to detect that kind of change.
That keeps your team from chasing “significant” but trivial effects and from abandoning promising ideas before the test had a fair chance to detect them.
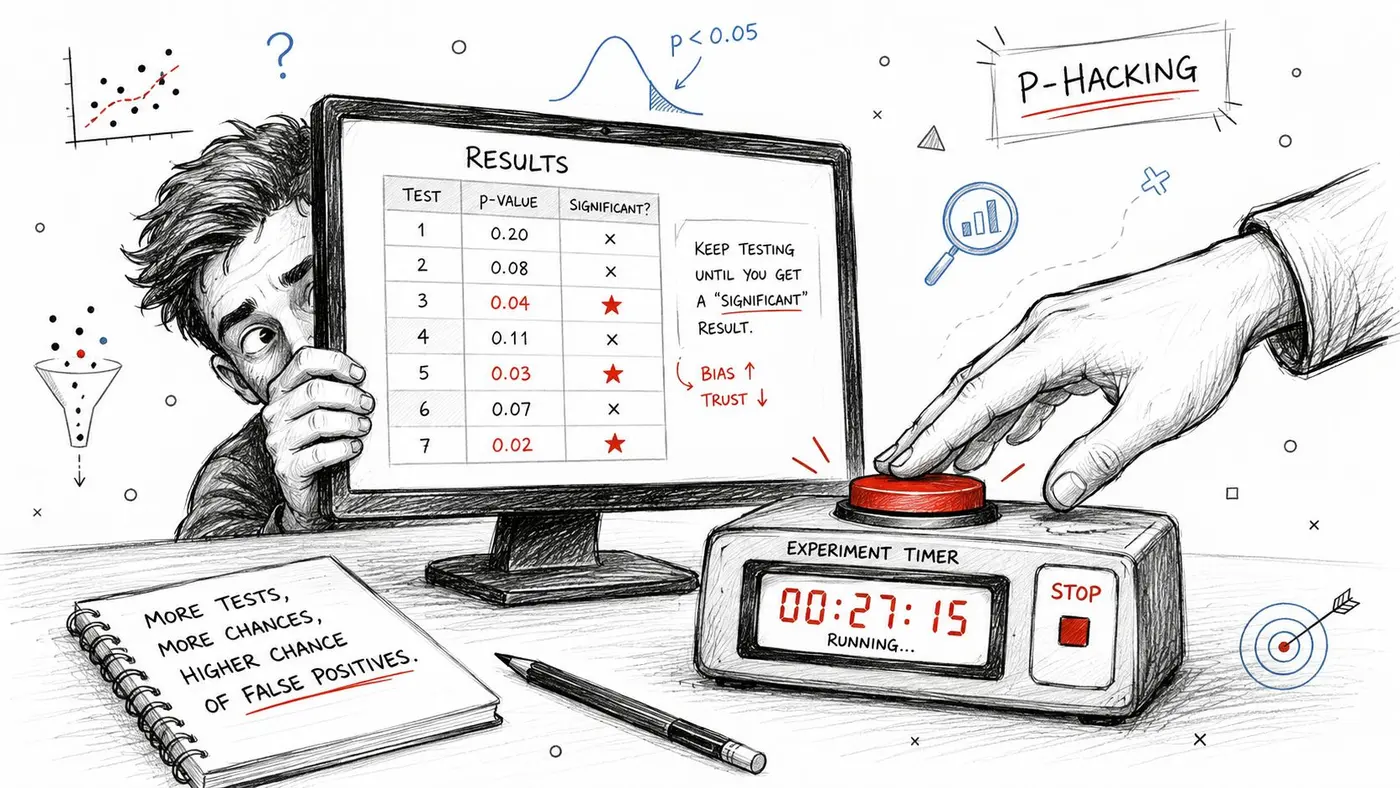
Practical Dangers P Hacking and Multiple Testing
Once a team learns that p values matter, a new temptation appears. They start watching the number too closely and trying to squeeze a win out of it.
That's where methodology breaks down.
Peeking turns noise into fake certainty
P-hacking in CRO often looks ordinary. Someone checks the dashboard several times a day. The p value dips below the threshold. They call the result, stop the test, and announce a winner before the data has settled.
That behaviour feels data-driven, but it isn't. It's selective stopping.
Early in a test, results can swing sharply because the sample is still thin. If you keep checking and stop at the first favourable moment, you increase the chance of mistaking randomness for a durable effect.
Multiple testing creates hidden traps
The second issue is running many comparisons and interpreting each one as if it stood alone.
This happens when teams test a cluster of headlines, several hero images, multiple CTA colours, or several audience cuts, then celebrate whichever one crosses the threshold. The more opportunities you create for random success, the more likely one result will look convincing by luck alone.
The problem isn't curiosity. The problem is forgetting that each extra look adds more chances for noise to masquerade as discovery.
Safer habits for CRO teams
You don't need to become a statistician to avoid these mistakes. You do need rules.
- Set stopping criteria before launch: Decide in advance when the test ends and what threshold counts.
- Limit unnecessary variants: Every extra branch makes interpretation harder.
- Treat exploratory slices carefully: Segment cuts can generate seductive false patterns.
- Document decisions: If you can't explain why the test stopped, you probably shouldn't trust the result.
Good experimentation discipline means resisting the urge to “win” the test and protecting the integrity of the learning.
Teams that ignore peeking and multiple testing usually don't realise they're corrupting their own evidence. They think they're moving faster. In reality, they're increasing the odds of shipping noise.
Beyond the P Value Alternatives and Best Practices
A p value answers one important question, but not the whole question. It helps you judge whether the observed difference is likely to be more than random variation. It doesn't tell you how large the effect is, how wide the uncertainty is around that estimate, or whether the result is commercially meaningful.
That's why mature CRO teams also look at confidence intervals. A confidence interval gives you a range of plausible values for the true effect, which is often much more informative than a pass-fail significance label. If you want a practical primer, this explanation of confidence intervals in statistics is a good next read.
Some teams also explore Bayesian tools, which frame results differently and can feel more intuitive for decision-makers. You don't need to switch frameworks to improve your judgement, though. Most gains come from using your current framework properly.
A compact checklist for sound decisions
- Define success before launch: Decide what kind of improvement would matter enough to implement.
- Plan sample needs upfront: Don't improvise your stopping point mid-test.
- Read significance alongside impact: A result can be statistically persuasive but commercially unimportant.
- Avoid mid-test temptation: Repeated peeking weakens your conclusions.
- Treat “no winner” as useful information: Inconclusive tests still teach you what the data didn't support.
A good p value explanation should leave you less impressed by flashy early lifts and more interested in evidence quality. That mindset is what turns A/B testing from a reporting habit into a decision system.
If you want a lightweight way to run statistically disciplined website experiments without adding friction to your workflow, Otter A/B is built for exactly that. It helps teams test headlines, CTAs, layouts, and revenue-driving changes with a fast SDK, frequentist significance calculations at a 95% confidence threshold, and reporting that connects experiment outcomes to real business metrics. Start free and make your next test easier to trust.
Stop guessing
Ready to start testing?
Set up your first A/B test in under five minutes. No credit card required.
- 14-day free trial
- No credit card required
- Cancel anytime