Qualitative vs Quantitative: A CRO Guide for 2026
Unlock higher conversions by mastering qualitative vs quantitative research. This guide shows CRO pros how to blend both methods for data-driven A/B testing.
You launch an A/B test. One variant wins. Stakeholders ask the obvious question: why did it work?
That's usually where the room goes quiet.
The dashboard gives you movement in conversion rate, revenue per variant, or another goal. What it doesn't give you, on its own, is user intent. You can see that behaviour changed. You can't automatically see what people noticed, misunderstood, trusted, or resisted.
That gap is where many experimentation programmes stall. Teams either over-rely on analytics and keep producing shallow tests, or they collect a pile of user feedback that never gets validated properly. The strongest CRO work sits in the middle. It uses quantitative evidence to decide and qualitative evidence to explain.
The A/B Test That Left You with More Questions
A familiar pattern shows up in almost every maturing CRO programme.
You test a new headline, pricing layout, category page, checkout step, or onboarding message. The result comes back with a winner, but the team can't tell whether the gain came from clarity, trust, urgency, reduced friction, or a segment-specific reaction. The next test becomes guesswork disguised as iteration.
The reverse is just as common. A test is inconclusive, so the team assumes the idea was bad. In reality, the problem may have been weak diagnosis. If you never understood the user's hesitation in the first place, the variant was just a polished guess.
What the dashboard tells you
Quantitative data answers the operational questions that matter in experimentation:
- Did the variation change performance
- Which version produced stronger commercial outcomes
- Should the team ship, stop, or rerun
Those are decision questions. They matter because a CRO programme needs a benchmark layer, not just opinions.
What the dashboard doesn't tell you
Qualitative research answers a different set of questions:
- What confused users on the page
- Which objections kept surfacing
- Where the experience broke the user's mental model
- Why a winning test resonated
Practical rule: If your experiment result changes a metric but doesn't change your understanding, you've learned less than you think.
That's why qualitative vs quantitative isn't an academic debate in CRO. It's the difference between running isolated tests and building a repeatable experimentation system.
Understanding the Two Research Pillars in CRO
Strong CRO teams separate two jobs early. One job is measuring impact. The other is explaining behaviour.
Quantitative research handles measurement. It uses numeric, structured data to show what changed, how large the change was, and whether the result is strong enough to support a business decision. In practice, this is the layer you use in Otter A/B to compare variants, review conversion rate, revenue, and segment-level outcomes, and decide whether to ship, iterate, or stop.
Qualitative research handles explanation. It uses observations, language, and behavioural evidence to show how people experienced the journey, where they hesitated, and what shaped their decision. In a CRO workflow, this often comes from session replays, surveys, interview notes, usability reviews, and open-text responses.
The distinction matters because these methods answer different questions, and mixing them up leads to bad decisions. A team that treats metrics as explanation usually ships changes without understanding the customer problem. A team that treats feedback as proof usually acts on a real complaint without knowing whether fixing it will move the commercial metric that matters.
Qualitative vs Quantitative Research at a Glance
| Attribute | Quantitative Research | Qualitative Research |
|---|---|---|
| Primary purpose | Measure performance and compare outcomes | Explain behaviour and uncover motives |
| Type of data | Numeric, structured, measurable | Descriptive, observational, language-based |
| Typical CRO questions | Which variant won? Did checkout completion improve? How did revenue differ by variant? | Why did users hesitate? What caused confusion? Which objections appeared repeatedly? |
| Common methods | A/B testing, funnel analysis, goal tracking, revenue analysis | Session replays, user interviews, on-page surveys, open-text responses, usability review |
| Best used for | Validation, prioritisation, benchmarking, trend comparison | Diagnosis, hypothesis generation, message testing, friction discovery |
| Decision strength | High for performance decisions | High for explanation, low for proof |
| Main weakness | Doesn't explain intent on its own | Doesn't prove impact at scale on its own |
A simple way to apply this in CRO is to split the question into two parts. First, what happened in the funnel? Second, why did it happen?
If a product page gets traffic but too few users add to basket, the quantitative view shows the commercial pattern. Otter A/B might show that one variant lifted clicks to basket but had no effect on completed purchases. That tells the team where performance changed and where it stalled.
The qualitative layer explains the mechanism. Session replays may show users hovering around delivery information. Survey responses may show uncertainty about returns. Usability review may show that the value difference between options is unclear. Those findings give the team something usable to test, instead of another surface-level redesign.
Quantitative research helps you judge impact. Qualitative research helps you build a stronger hypothesis.
The best experimentation programmes treat both as working parts of the same system. Quant tells you whether the business outcome moved. Qual helps you understand what to test next and why a result appeared. Used together, they reduce guesswork and increase the quality of each test cycle.
Teams usually go wrong in one of two ways:
-
They overread the numbers
A clean uplift gets treated as full customer understanding. It is only proof that performance changed. -
They overread the feedback
Repeated complaints get treated as a rollout decision. They are a signal to test, not proof that the proposed fix will improve conversion or revenue.
Good CRO work requires both. In Otter A/B, that means using experiment results to make the performance call, then pairing those results with behavioural evidence so the next hypothesis is sharper than the last one.
Strengths and Weaknesses for Experimentation
The cleanest way to evaluate qualitative vs quantitative in CRO is to look at the job each method performs inside an experimentation programme.
Where quantitative work is strongest
Quantitative evidence is what lets a team make a defensible call. In UK experimentation and survey practice, the key distinction is that quantitative data is the only one of the two that supports statistically defensible effect-size estimation and confidence intervals, because it is numeric and measurable, while qualitative data is descriptive and better suited to explaining the “why” behind outcomes, as outlined in this overview of qualitative and quantitative data in analysis and testing.
That matters directly in CRO. If you're comparing versions of a landing page, pricing table, or checkout flow, quantitative metrics are what let you answer:
- Did the variant improve conversion rate
- Did revenue per variant move in the right direction
- Is the result strong enough to ship
- How did key segments behave
Without that layer, teams can have strong opinions and vivid anecdotes, but no reliable basis for decisioning.
Where quantitative work breaks down
Metrics flatten context. They tell you that users dropped off after a step, but not whether they felt uncertain, overloaded, distracted, or unconvinced.
A common failure mode is metric worship. Teams keep slicing dashboards, creating more reports, and debating significance while the root cause remains invisible. If the hypothesis quality is weak, cleaner measurement won't rescue the programme.
Where qualitative work is strongest
Qualitative inputs are excellent for discovery. Session replays reveal hesitation. On-page surveys surface objections in the user's own words. Interviews expose mismatches between what the business thinks is clear and what the customer understands.
Better hypotheses arise from this.
A good qualitative finding often sounds like this: users are not rejecting the offer, they're pausing because the page doesn't answer a basic reassurance question. That's far more usable than “mobile conversion is lower than desktop”.
Where qualitative work breaks down
Qualitative evidence is rich, but it isn't a final verdict. It's directional.
You can't assume a pattern found in a handful of replays or interviews will produce a business improvement once implemented. You also can't use vivid user quotes as a substitute for outcome measurement.
Key judgement: Use qualitative evidence to build and interpret hypotheses. Use quantitative evidence to accept or reject them.
The useful trade-off
The weakness of one method is usually covered by the strength of the other.
| CRO task | Quantitative fit | Qualitative fit |
|---|---|---|
| Find funnel leakage | Strong | Moderate |
| Understand objections | Weak | Strong |
| Size an opportunity | Strong | Weak |
| Prioritise tests | Strong | Moderate |
| Write a sharper hypothesis | Moderate | Strong |
| Confirm a winning variant | Strong | Weak |
| Explain why the winner worked | Weak | Strong |
That's the practical centre of the qualitative vs quantitative debate. You don't choose one camp. You sequence both properly.
When to Use Each Research Method in Your CRO Process
The most useful shift is to stop asking which method is better and start asking which method fits the stage you're in.
UK research guidance increasingly treats these as complementary design choices rather than competing methods. The National Centre for Research Methods is cited as recommending that researchers start from the question and use the method that best fits the purpose, while mixed-methods work combines breadth and depth, as summarised in this discussion of qualitative and quantitative study design.
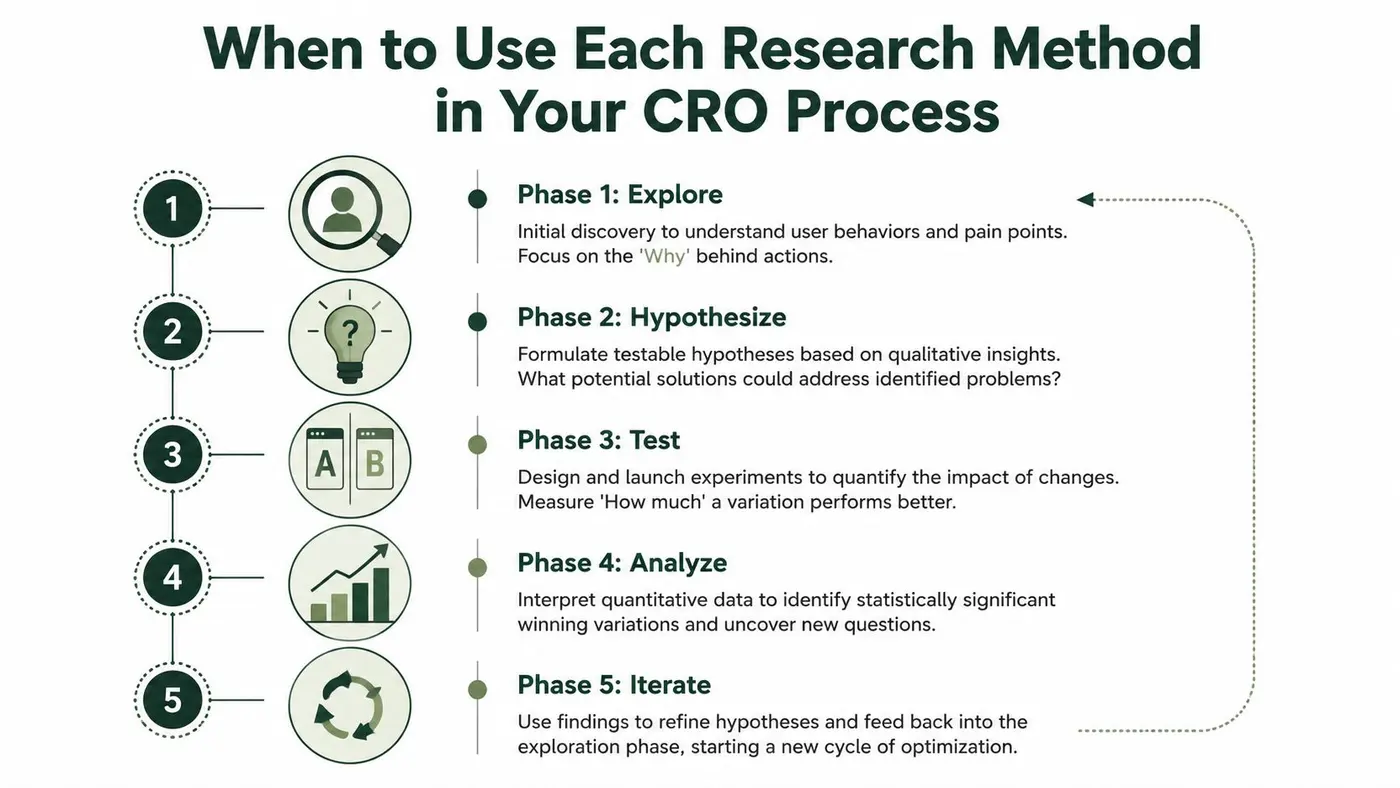
Phase one through phase three
The first half of a strong CRO cycle is about diagnosis and framing.
-
Explore
Start with quantitative analytics. Look for leaks, drop-offs, weak pages, low-performing entry points, or step-level friction. This tells you where performance deserves attention. -
Hypothesise
Switch to qualitative methods. Review session replays. Read survey responses. Speak to users or support teams. The goal isn't to collect random feedback. It's to understand the mechanism behind the pattern you found. -
Test
Translate that mechanism into a precise, falsifiable idea. If users hesitate because the pricing explanation is unclear, the hypothesis should target explanation and reassurance, not just visual change.
Phase four and phase five
Once the test is live, quant returns to the foreground.
-
Analyse
Use your experiment results to determine whether the change improved the target outcome. Review performance by segment if the pattern suggests different user intents. -
Iterate
If the result is positive, ask which part of the treatment likely did the heavy lifting. If the result is flat, return to qualitative review and inspect whether the diagnosis was wrong, the treatment was weak, or the page problem sits elsewhere.
Mixed-methods CRO works best when quant opens and closes the loop, and qual improves what happens in the middle.
A simple decision rule
Use this shortcut in day-to-day work:
- Need to find a problem: start with quant
- Need to understand a problem: switch to qual
- Need to prove a solution: return to quant
- Need to explain the outcome: use qual again
What doesn't work is running every stage with the same instrument. A team that only uses analytics becomes blind to motivation. A team that only uses interviews becomes blind to scale.
The Otter A/B Integrated Experimentation Workflow
Good experimentation programmes don't separate research and testing into different worlds. They build one loop.
National measurement practice in the UK offers a useful parallel. ONS labour, consumer, and business publications combine large-scale numerical estimates for trend measurement with contextual commentary and respondent explanations. The technical takeaway is that quantitative evidence supports repeatable comparison over time and across segments, while qualitative evidence provides explanatory depth and edge-case discovery, as summarised in this overview of qualitative and quantitative research approaches.
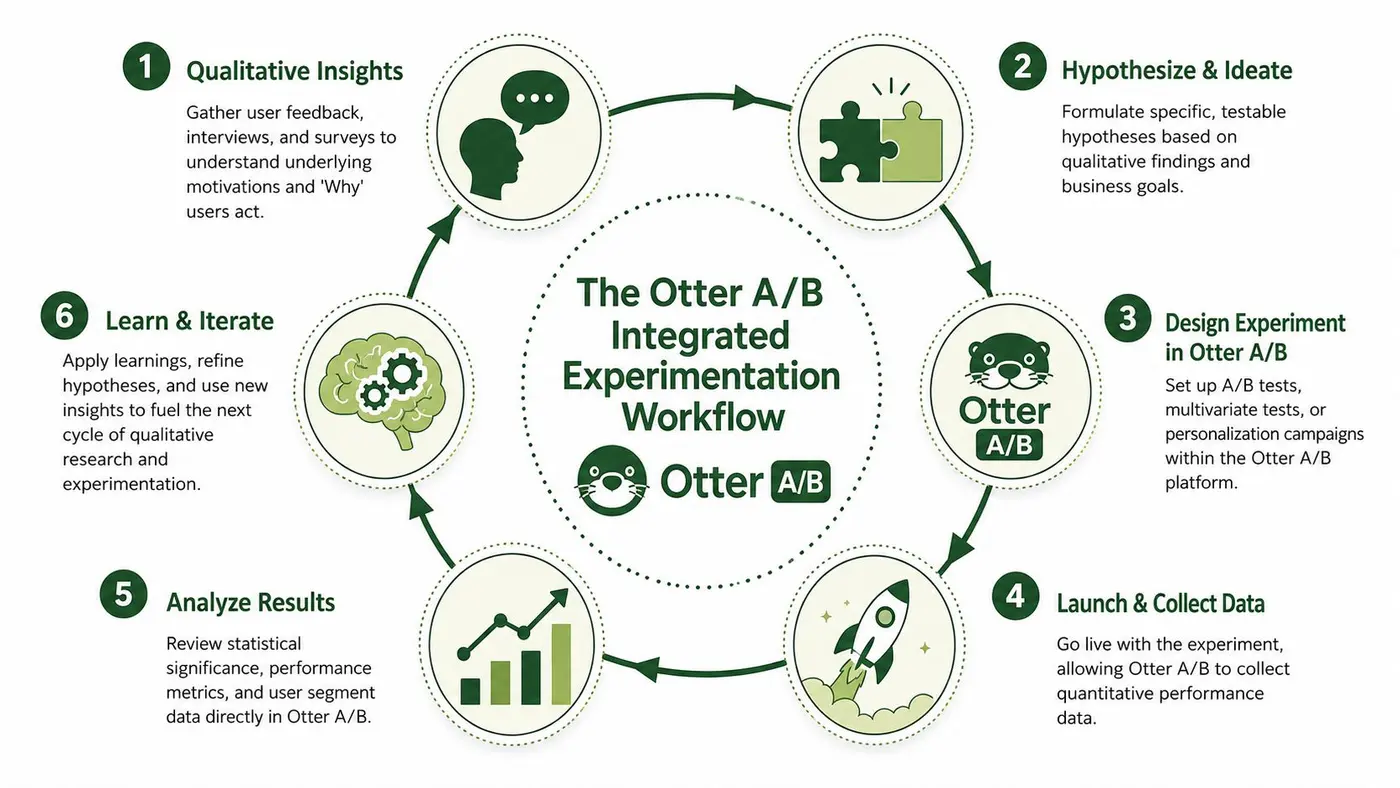
Step one, find a measurable problem
Start in your analytics stack, not in a brainstorm.
Look for commercially relevant patterns such as:
- A weak product detail page where traffic arrives but progression stalls
- A checkout step with visible abandonment
- A feature entry point with low activation
- A lead form that attracts clicks but poor completion
Many teams waste time. They jump straight to ideas instead of verifying that a page or flow deserves attention.
Step two, inspect the behaviour behind it
Once you've identified the problem area, move into qualitative review. Use session replays, user interviews, support transcripts, open-text surveys, sales-call notes, or moderated walkthroughs.
The aim is to answer questions like:
- What are users trying to understand here
- What information are they looking for before acting
- Where do they hesitate
- Which objections repeat in different sources
Don't ask users to design the solution for you. Ask them to reveal their uncertainty.
Step three, write a proper hypothesis
A weak hypothesis says, “Changing the page layout will improve conversion.”
A stronger one says, “If we surface delivery information earlier, more users will continue because the page currently withholds reassurance they expect before purchase.”
That distinction matters. The first statement describes a change. The second describes a causal belief you can test.
The best hypotheses connect three things: observed behaviour, user explanation, and a measurable business outcome.
Step four, build the experiment
Turning the hypothesis into a controlled experiment without creating unnecessary drag for marketing, product, or engineering calls for a lightweight testing platform.
In practice, that means defining:
- The control and variant clearly
- The primary metric
- Secondary commercial metrics
- Any audience or page targeting
- What counts as a decision-ready outcome
A tool like Otter A/B fits this part of the workflow well because it keeps the implementation and reporting straightforward. That matters more than is commonly acknowledged. The easier it is to launch and read tests, the easier it is to sustain an experimentation cadence.
Step five, let quantitative evidence decide
Once the experiment is live, resist the urge to narrate the result too early. Watch the actual performance data. Use the platform's reporting to compare variants on the business metrics that match the original problem.
Discipline becomes paramount. Teams often smuggle qualitative enthusiasm into the decision stage. They liked the new page. Users said it felt clearer. Internal stakeholders prefer it. None of that overrides the measured outcome.
Step six, add interpretation back in
After the result is clear, qualitative follow-up becomes valuable again.
If the variant wins, review the supporting evidence. Did users engage with the new reassurance element? Did the updated message remove a recurring objection? Did one segment respond differently from another because the problem wasn't universal?
If the variant loses, don't throw out the original insight immediately. Separate these possibilities:
- The diagnosis was wrong
- The diagnosis was right but the treatment was weak
- The treatment helped some users but hurt others
- The primary constraint sits further down the journey
A practical template
Use this simple workflow template in your next sprint:
| Stage | Question | Method |
|---|---|---|
| Problem spotting | Where is performance weaker than expected? | Quantitative analytics |
| Diagnosis | Why are users stalling or dropping? | Qualitative review |
| Hypothesis | What change should remove the friction? | Mixed input |
| Validation | Did the change improve the target metric? | Quantitative experiment |
| Learning | What explains the result and what should be tested next? | Qualitative interpretation |
That loop is how teams move from isolated tests to compounding learning.
Putting It into Practice with Real-World Scenarios
A test ends, the numbers are clear, and the real work starts. The team now needs to decide what to scale, what to fix, and what to test next.
An e-commerce merchandising problem
A retailer sees healthy traffic landing on a key category page and plenty of product views, but add-to-basket rate lags behind expectation. Otter A/B helps the team spot the commercial gap quickly because the page is already underperforming on the metric that matters.
That still does not explain the friction.
A qualitative review fills in the missing detail. Session replays show shoppers opening product cards, comparing options, then backing out without committing. Short feedback responses point to the same issue. Product differences are hard to scan, and the choice architecture asks for too much effort too early.
The team builds a tighter experiment from that diagnosis. Instead of a broad visual redesign, they test clearer variant labels, simpler option presentation, and less clutter around the primary selection. Otter A/B measures whether those changes improve basket progression. After the test, the team reviews replays and feedback again to see which change reduced hesitation and which one made no real difference.
That matters because a win is only useful if you can repeat the pattern elsewhere.
A SaaS activation problem
A product team sees users reach a new feature area, then stall before meaningful use. Event tracking shows the drop-off point clearly in Otter A/B, but the numbers cannot explain whether the issue is confusion, weak motivation, or poor timing.
User interviews and support themes give the answer. People notice the feature, but they do not understand its immediate value, so they postpone trying it. The problem sits in the explanation, not the feature itself.
That changes the test plan. The team rewrites onboarding prompts, sharpens the microcopy, and places a clearer value message at the point of entry. Then they run the experiment against activation and downstream usage, not just click-through. If the variant lifts adoption but hurts retention quality, they know the message over-promised. If activation rises and retained usage holds, they have a change worth rolling out.
Why these scenarios matter
Both examples show the same operating model. Quantitative evidence identifies where commercial performance is weak and confirms whether a change improved it. Qualitative evidence explains the user friction behind the drop and helps the team write a better treatment.
Used together, they produce stronger tests and better post-test learning. Otter A/B fits that workflow well because it gives teams one place to run experiments, compare outcomes, and connect test results back to the observed user problem. That is how experimentation programmes stop chasing random ideas and start building a reusable decision system.
Start Blending Your Research Methods Today
What's needed isn't more tests, but better test inputs and better test interpretation.
The qualitative vs quantitative debate becomes much less confusing once you assign each method a job. Quant finds the gap and validates the change. Qual explains the friction and sharpens the next move. When both are present, the programme gets more reliable and more teachable.
Use this checklist to start immediately:
- Pick one drop-off point from your funnel, landing page, checkout, or onboarding flow.
- Review the evidence qualitatively with replays, interviews, surveys, or support conversations.
- Write one hypothesis that links the observed friction to a specific user concern.
- Run one focused experiment against a clear commercial metric.
- Document both layers of learning so the next test starts from evidence, not instinct.
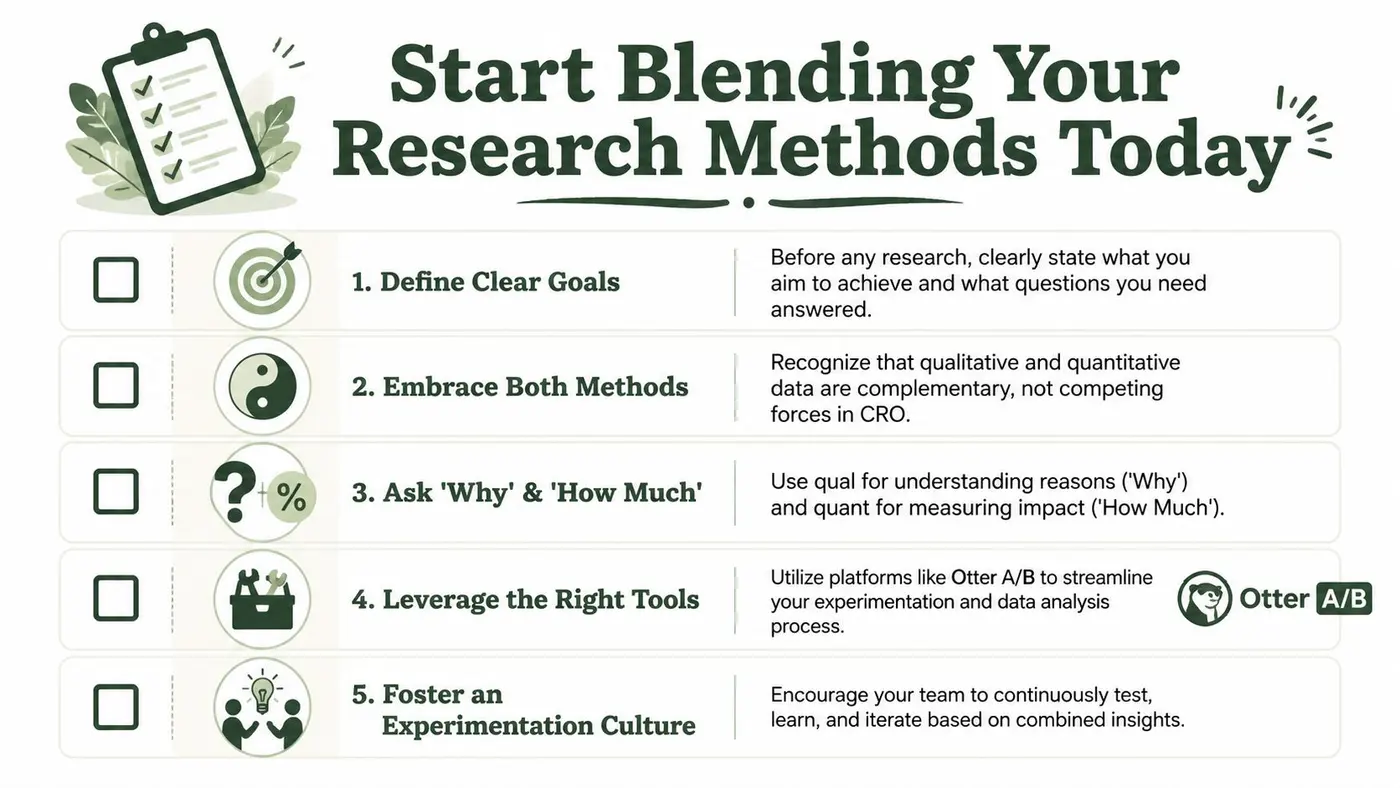
Start with one page, one problem, and one hypothesis. A strong experimentation culture is built from repeated small loops, not from a giant research programme nobody can maintain.
If you want a simple way to turn research-backed ideas into measurable experiments, Otter A/B gives teams a lightweight way to test headlines, CTAs, layouts, and user journey changes without adding unnecessary complexity. It's a practical fit for marketers, product teams, and agencies that want faster experiment launches, cleaner reporting, and decisions tied to real business outcomes.
Stop guessing
Ready to start testing?
Set up your first A/B test in under five minutes. No credit card required.
- 14-day free trial
- No credit card required
- Cancel anytime