Mastering Friction Reduction for UX & Conversions
Learn practical friction reduction techniques to fix UX issues, boost conversions, & improve user experience. Identify, measure, and A/B test for higher

You can usually spot a high-friction journey without opening analytics. You try to buy something on your phone. The product page is thin, the delivery details are buried, the size guide opens badly, the promo code field grabs attention at the wrong moment, and the checkout button looks different on every step. Nothing is catastrophically broken. It just feels harder than it should.
That's what makes friction expensive. Teams often treat it as a design polish issue when it's really a revenue issue. In practice, the sites that lose conversions rarely lose them because of one dramatic flaw. They lose them because small points of hesitation stack up across the journey.
The Hidden Cost of a Frustrating User Experience
It is generally understood that users dislike awkward interfaces. What many underestimate is how directly that affects commercial performance. A 2025 UK Statista report on digital retail found that 68% of UK shoppers abandon carts due to clunky interfaces, yet only 12% of UK A/B testing case studies explicitly link UX friction reduction to revenue gains. The same source notes that UK retailers reducing UX friction by 15% saw a 22% increase in average order value.
That combination matters. It says two things at once. First, interface friction is costing money today. Second, many teams still aren't measuring fixes against revenue, so they improve the experience without proving commercial impact.
In client work, this shows up in familiar ways:
- Checkout hesitation: Users pause when shipping, returns, or payment details are unclear.
- Decision fatigue: Product pages force too many small choices before trust is established.
- Mobile breakdowns: Buttons, forms, and overlays create effort that desktop reviews often miss.
- Measurement gaps: Teams celebrate click improvements but don't track whether order value or completed purchases improve.
Practical rule: If a user has to stop and interpret the interface, you've introduced a cost.
Friction isn't limited to visual design. It also appears in how teams collect evidence. Session recordings, support chats, and user interviews often contain the clearest language about blockers, but many teams never turn that messy qualitative input into testable hypotheses. If you're analysing customer calls or usability interviews, a workflow like this guide to mp4 to text transcription can help turn raw recordings into searchable material you can tag by objection, hesitation, and drop-off pattern.
The important shift is simple. Stop asking whether the experience feels smoother. Start asking whether the journey removes enough resistance to increase completed purchases and revenue.
Understanding Digital Friction and Its Sources
Mechanical engineers understand friction reduction in practical terms. Reduce the right resistance, and the whole system works more efficiently. The UK's Centre for Sustainable Road Freight reported that aerodynamic and rolling-resistance measures can deliver around a 10% fuel-saving potential for heavy goods vehicles. The lesson for digital teams is similar. Small reductions in systemic resistance often outperform isolated tweaks.
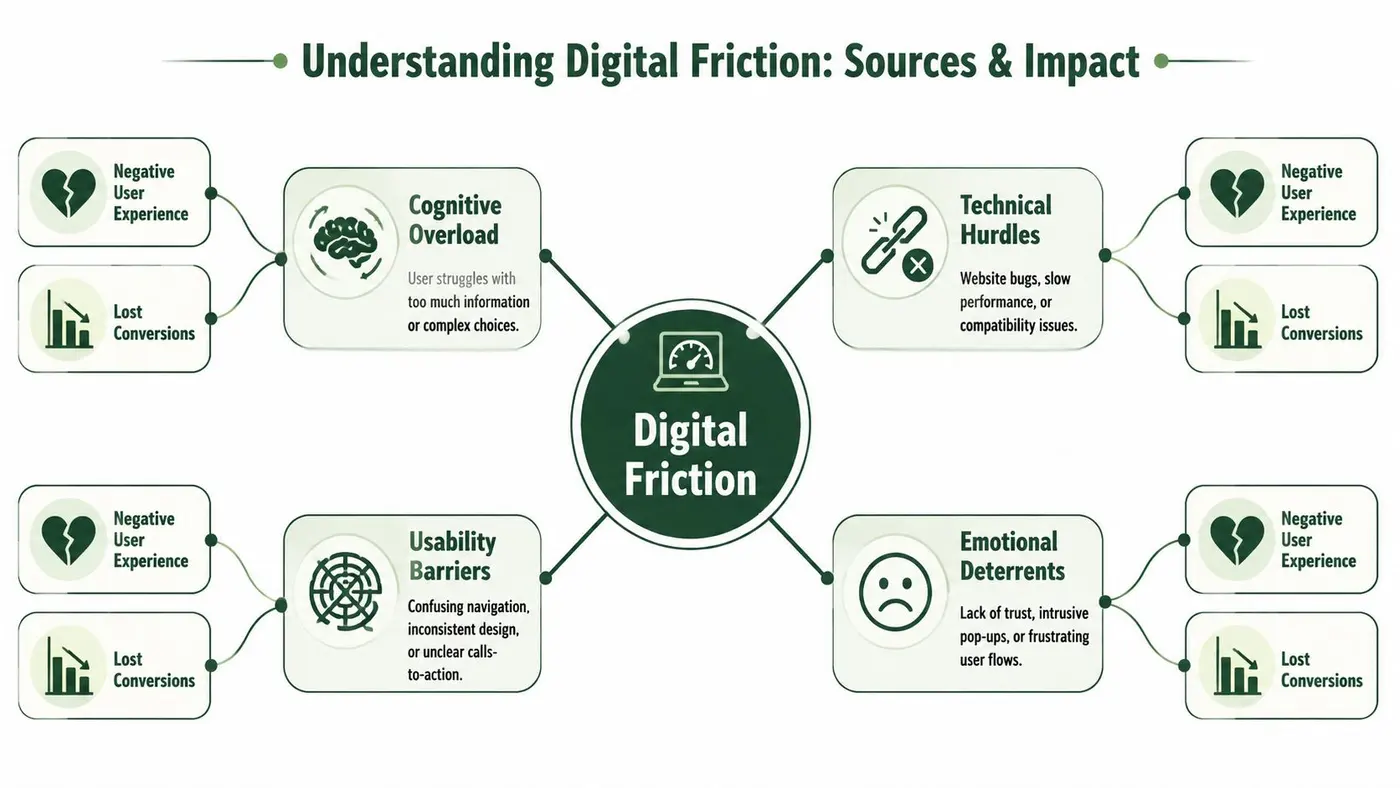
Digital friction is any point in the journey that adds unnecessary effort, uncertainty, or delay. I break it into three categories because that makes diagnosis much easier.
Cognitive friction
This is the thinking load. Users have to work out what a page means, where to go next, or whether the offer fits them.
Common signs include cluttered category pages, weak information hierarchy, vague pricing, and product pages that answer the wrong questions. A user shouldn't need to reverse-engineer your offer.
Interaction friction
This is the physical effort of using the interface. The user knows what they want to do but the product makes that action awkward.
Typical examples include long forms, buttons that don't feel tappable, dropdowns that are painful on mobile, coupon fields that distract at checkout, and validation messages that appear too late. This type of friction often appears in analytics as repeated clicks, abandoned fields, or sharp step-to-step drop-offs.
Emotional friction
This is the trust problem. The user can technically proceed but doesn't feel comfortable doing so.
It shows up when shipping timelines are unclear, return policies are hard to find, social proof feels weak, payment reassurance is absent, or the design looks inconsistent enough to raise doubt. Emotional friction is especially common near payment and signup moments because that's where perceived risk rises.
A simple way to separate the three is to ask what the user is struggling with:
| Friction Type | What It Feels Like to the User | Common Examples |
|---|---|---|
| Cognitive | “I'm not sure what this means or what to do next.” | Confusing navigation, poor hierarchy, unclear pricing, thin product detail |
| Interaction | “I know what I want, but this is annoying to use.” | Long forms, broken mobile layouts, weak button states, late validation |
| Emotional | “I'm not confident enough to continue.” | Missing trust cues, unclear returns, weak delivery information, inconsistent design |
Reduce the effort to understand, the effort to act, and the anxiety about proceeding. That's the real scope of friction reduction.
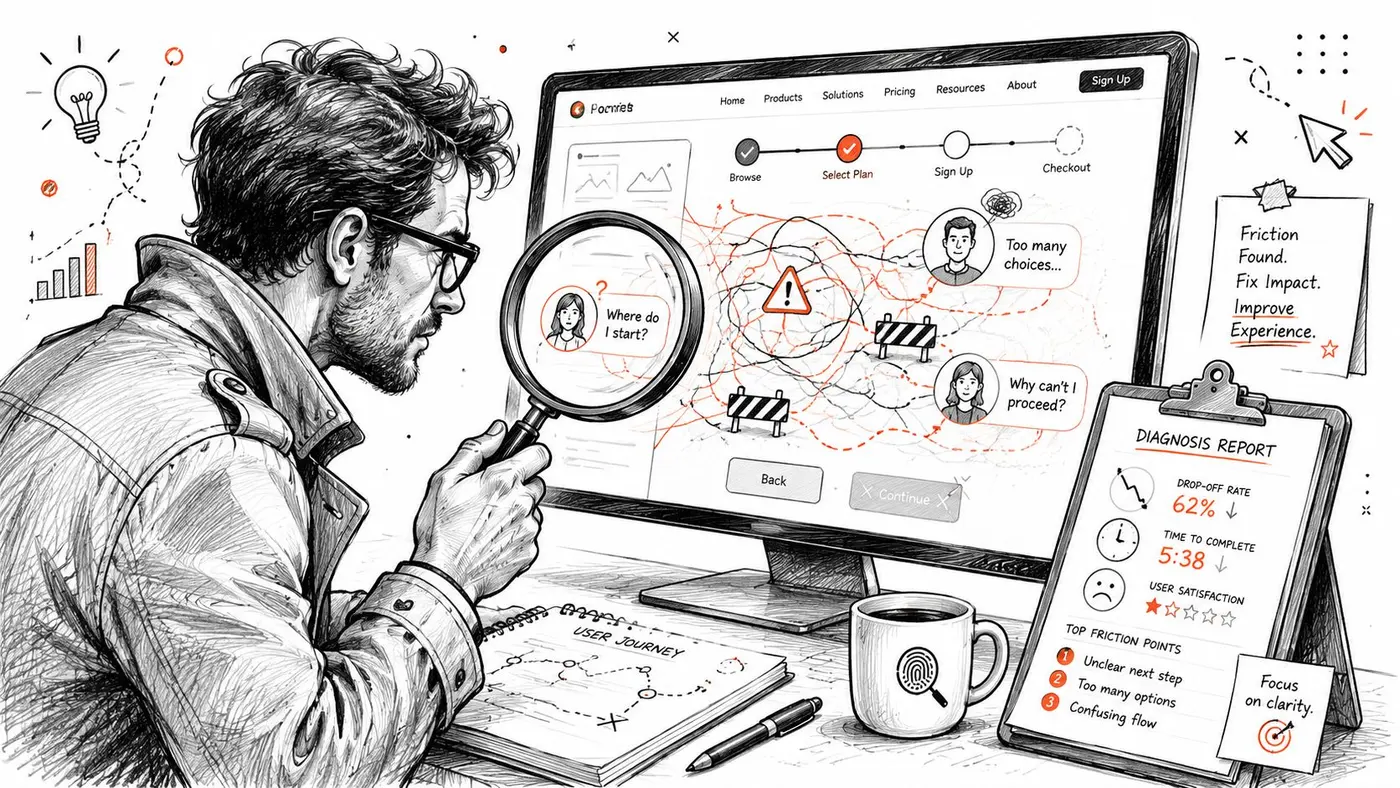
How to Identify and Measure User Friction
Teams often look for friction in the wrong order. They start with redesign ideas instead of diagnosis. That usually leads to attractive changes, weak prioritisation, and inconclusive tests.
The better sequence is this. Use quantitative data to find where users struggle. Use qualitative research to understand why they struggle. Then rank issues by business impact, confidence, and implementation effort.
Start with the funnel, not the homepage
A homepage may be messy, but that doesn't automatically make it your biggest problem. Start with high-intent paths where friction is most likely to hurt revenue directly. For e-commerce, that usually means product page to cart, cart to checkout, checkout to payment, and post-purchase account creation if that's part of your flow.
Review:
- Entry pages with strong intent: Landing pages from paid search, product listing pages, and product detail pages.
- Checkout steps: Look for pages where abandonment jumps or completion slows.
- Mobile-specific paths: Friction often hides inside responsive layouts, tap targets, and autofill behaviour.
- Micro-conversions: Add to cart, email capture, account creation, and checkout progression.
If you need a structured framework for that review, a user experience audit process is a useful way to move from broad suspicion to a page-by-page diagnosis.
What to pull from analytics
Analytics won't explain user intent by itself, but it will tell you where to investigate.
Look for patterns such as:
- High exit rates on high-intent pages: Product pages, basket pages, or pricing pages that lose users unusually early.
- Drop-offs between adjacent steps: Especially when the preceding step suggests strong intent.
- Device asymmetry: If mobile underperforms desktop in a specific part of the journey, inspect the interface before blaming traffic quality.
- Event-level anomalies: Repeated interactions with the same element can signal uncertainty or failure.
- Form behaviour: Field abandonment, restarts, and repeated validation errors often point to interaction friction.
A useful discipline is to annotate every suspected friction point with the commercial behaviour around it. Don't just say “users struggle with the delivery section”. Say “users who reach delivery options often stop progressing after interacting with this block”. That forces better hypotheses later.
Why recordings and research matter
Numbers tell you where. They rarely tell you what the user was trying to understand.
Session recordings help you see hesitation. You'll notice users bouncing between tabs, reopening accordions, highlighting text, zooming product images, or stalling after error messages. Those behaviours are often more informative than headline metrics.
Qualitative inputs are where the strongest test ideas come from:
- On-site surveys: Ask what stopped the user from completing the task.
- Support logs: Great for recurring objections around delivery, sizing, billing, and returns.
- User testing: Watch people attempt common tasks without intervention.
- Sales or service calls: These reveal the language customers use when they're uncertain.
Field note: The best friction findings are specific enough to rewrite. If a user says, “I couldn't tell whether this would arrive before Friday,” that's not abstract UX feedback. It's a concrete copy and information problem.
Prioritise by revenue proximity
Not every rough edge deserves immediate attention. A misaligned icon matters less than a product page missing delivery information or a payment step producing anxiety.
I prioritise fixes using three questions:
- How close is this issue to revenue?
- How many users are exposed to it?
- Can the team implement and test a change cleanly?
That approach prevents teams from spending weeks refining cosmetic elements while serious blockers remain untouched.
Prioritised Tactics for Friction Reduction
A shopper lands on a product page from a paid ad, likes the product, then hesitates. The price is visible, but delivery timing is buried, returns are vague, and the size guide opens awkwardly on mobile. Traffic quality was not the problem. The interface made the purchase harder than it needed to be.
That is usually how friction shows up in revenue terms. Not as a dramatic usability failure, but as avoidable hesitation at points close to purchase. The work here is to remove effort that slows decisions, while keeping the information buyers need to feel safe proceeding. Teams that strip pages back too aggressively often create a new problem. Users still have the same questions, but now they have to work harder to answer them.
Design changes that usually pay off
Start with decision order. Buyers need to grasp the product, price, availability, proof, and next action fast, especially on mobile screens where weak hierarchy gets expensive.
Useful design fixes include:
- Clearer visual hierarchy: Make the primary action obvious. Keep competing links and secondary actions in the background.
- Better grouping: Put delivery, returns, payment reassurance, and key specs near the buying decision, not scattered across tabs and accordions.
- Mobile-first cleanup: Remove pinch-zoom moments, awkward sticky elements, and hidden content patterns that force extra taps.
- Progressive disclosure: Show the highest-value details early, then let users expand into fuller specifications, FAQs, or comparison content.
For Shopify teams, checkout constraints affect what can be changed and tested. A practical overview of Shopify Plus checkout features helps separate theme issues from checkout issues so teams do not waste cycles redesigning the wrong part of the journey.
Copy changes that remove hesitation
Copy usually carries more conversion weight than teams expect. If the page looks polished but leaves obvious questions unanswered, users pause, open another tab, or abandon and promise themselves they will come back later.
The strongest copy fixes usually target these areas:
- CTA language: Match the action to the user's next step and level of intent.
- Product information: Answer practical objections such as dimensions, compatibility, delivery windows, returns, care, and what is included.
- Microcopy: Reduce uncertainty around forms, payment, and fulfilment.
- Error states: Explain how to fix the problem in plain language, right where it occurs.
Revenue and UX directly meet. A clearer delivery message or returns explanation can lift conversion more than a visual refresh because it resolves a buying objection, not just a design preference. If you need evidence before rewriting, review click concentration, rage clicks, and scroll drop-off on key templates. A practical guide to using heat maps on websites helps pinpoint where users go looking for information that should have been easier to find.
Technical fixes that protect conversion intent
Technical friction tends to survive internal review because stakeholders browse on fast connections, saved devices, and known paths. Customers do not.
Look closely at:
- Form validation timing: Show issues early enough to help completion, without interrupting users before they finish typing.
- Input compatibility: Check mobile keyboards, autofill, address lookup, and payment flows across common devices.
- Responsive stability: Prevent layout shifts, clipped fields, and buttons moving during interaction.
- Third-party clutter: Audit widgets, pop-ups, chat prompts, and scripts that interrupt checkout intent or slow page rendering.
The trade-off is straightforward. More information can improve confidence, but only if the page structure keeps it easy to scan. More widgets can add reassurance, but each script adds weight, distraction, or both. Friction reduction works when teams treat every change as a commercial choice: reduce effort, preserve clarity, and make it easier for high-intent users to complete the purchase.
The AB Testing Workflow for Proving Impact
A team spots a clear friction point, ships a cleaner experience, and sees early engagement rise. Then revenue stays flat, or average order value slips. That happens when the test proves interaction change but not commercial impact.
A friction fix counts when it changes user behaviour and improves the business outcome you were trying to move. In UK ecommerce especially, where margins are often squeezed by shipping costs, returns, and paid traffic, that distinction matters. Better UX is useful. Revenue lift is what gets investment for the next round of fixes.
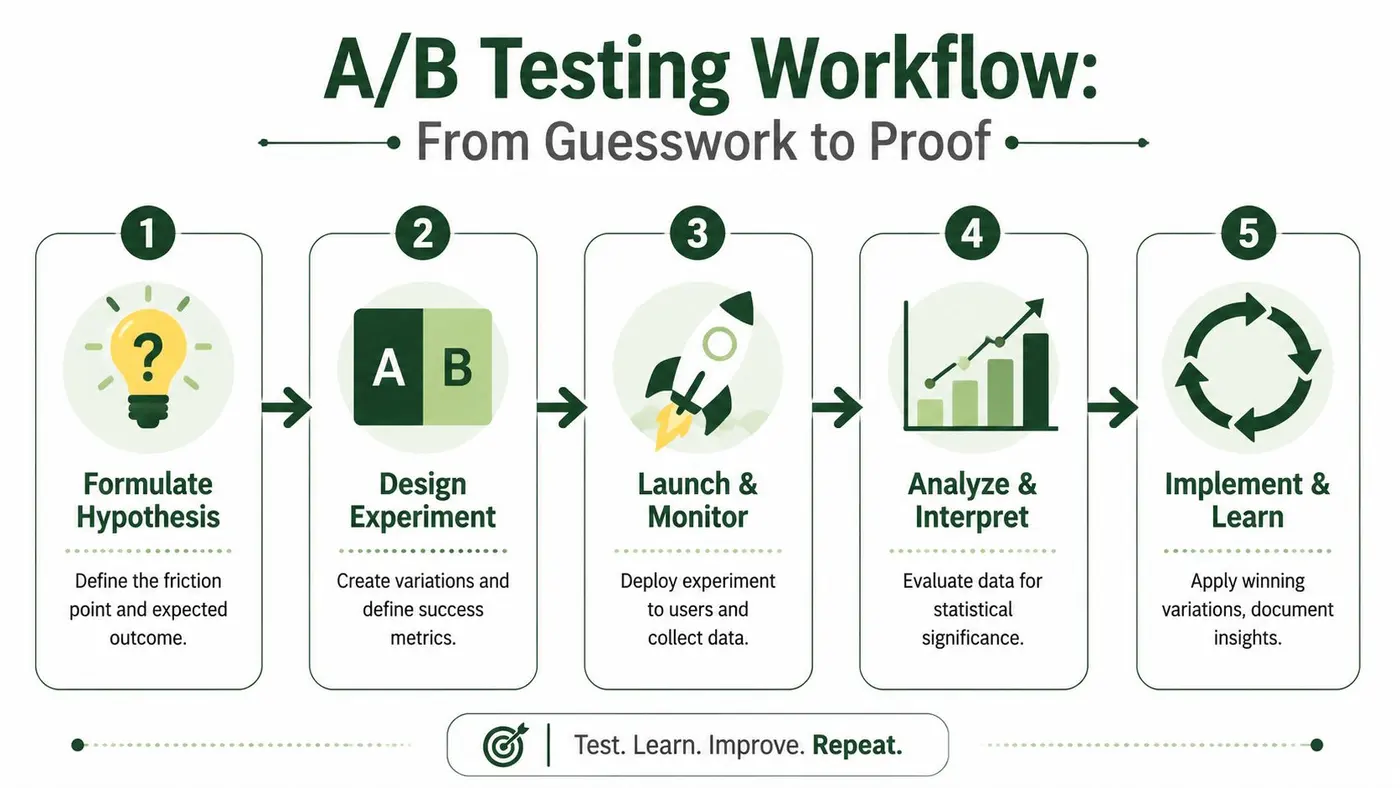
Step one and two
Start with a hypothesis tied to a specific point of hesitation. “Improve the product page” is too broad to test well. “Adding delivery timing beside the primary CTA will reduce hesitation for high-intent visitors who are deciding whether to buy now” gives the team something measurable.
Then keep the experiment narrow enough to explain the result. If a variant changes layout, messaging, trust signals, and CTA treatment at the same time, the test may produce a winner but leave you guessing about why it won. That makes it harder to repeat the gain elsewhere.
Use a simple structure:
- Observed friction: Users hesitate, abandon, or repeat actions at a defined step.
- Suspected cause: Missing information, interaction effort, or a confidence gap.
- Proposed change: One variation designed to remove that blocker.
- Expected outcome: Higher progression, more completed orders, stronger order value, or a cleaner revenue-per-visitor result.
Step three
Choose metrics that match the commercial risk of the change.
For upper-funnel tests, click-through rate or progression rate can be enough for an initial read. For product, basket, and checkout tests, that is rarely enough on its own. A variant can increase clicks to checkout while lowering completed purchases, reducing basket value, or attracting lower-intent traffic into the funnel.
That is why I usually set primary and guardrail metrics before launch. Primary metrics track the outcome the business cares about, such as completed purchases or revenue per visitor. Guardrails protect against false wins, such as lower average order value, worse mobile conversion, or a drop in completed payment rate.
If the team uses Otter A/B, the useful part is not the tool name. It is the ability to compare variants against downstream outcomes, not just surface engagement. That is the standard to hold. Friction reduction should prove commercial value, not just cleaner interaction patterns.
Before launch, set expectations on test duration and evidence thresholds. Teams that guess here often stop too early, call noise a win, and roll out changes that do not hold up. Use this guide on how to calculate sample size for an A/B test to set a realistic sample target before traffic starts flowing.
Step four and five
Run the test cleanly. Avoid changing audience targeting, promotional offers, creative, or major traffic sources during the test window unless the business has no choice. If something does change, log it. That context matters when results look stronger or weaker than expected.
Once results are in, review more than the headline winner. Check mobile against desktop, new visitors against returning customers, and high-intent entry pages against broader traffic. A losing variant can still expose a useful pattern, such as stronger reassurance copy paired with the wrong placement or a better message attached to too much visual weight.
Decision rule: Treat every friction test as a revenue case first and a learning asset second. Keep both.
The strongest programmes build a repeatable loop. Analytics, session recordings, support tickets, and merchandising feedback identify friction. Tests validate whether removing it creates measurable revenue gain. That process is what turns UX improvements into a credible commercial growth plan.
Your Friction Reduction Checklist and Sample Experiments
This is the part teams often need. Not another framework. A practical review list and a few experiments that can go live without months of planning.
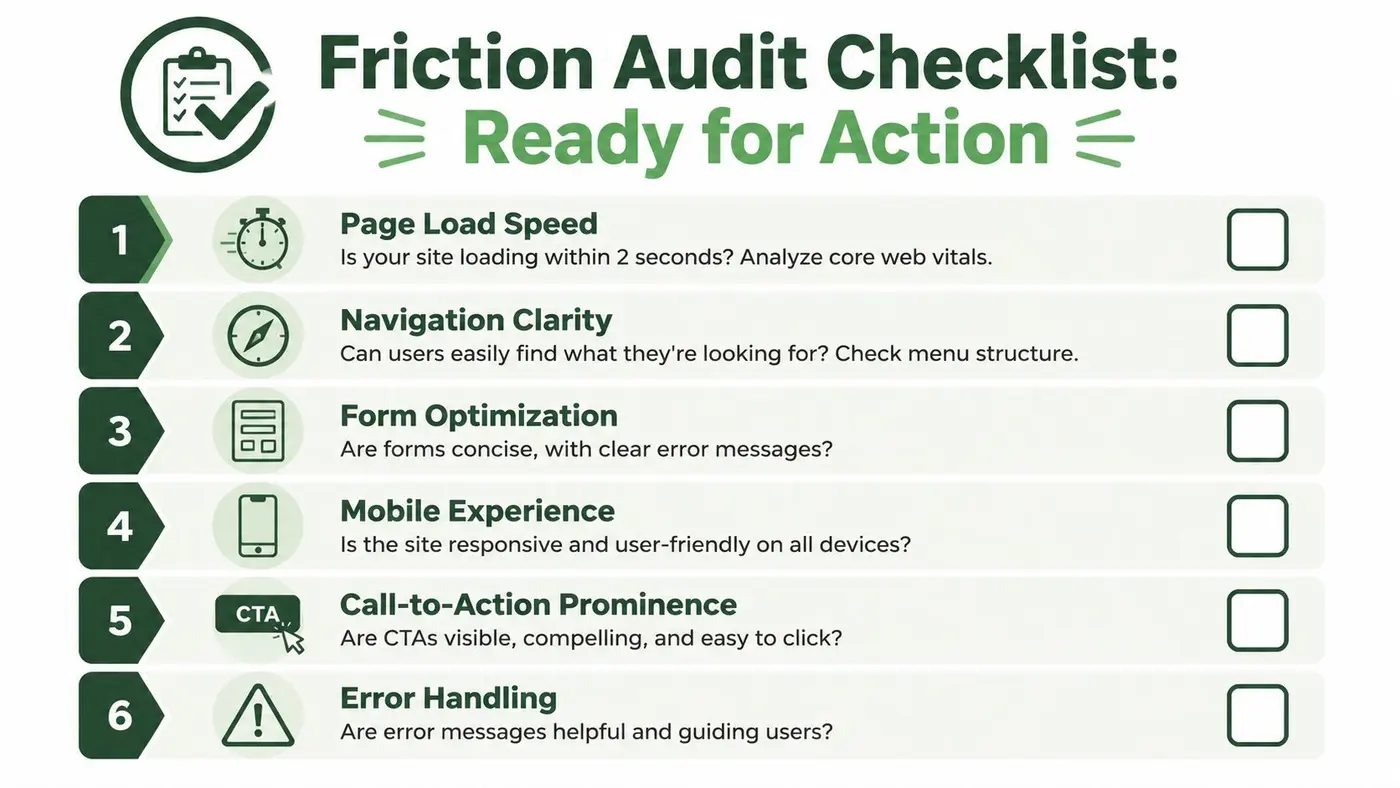
Friction audit checklist
Use this during a live walkthrough of your main revenue paths.
- Landing page clarity: Can a new visitor identify the offer, audience, and next step quickly?
- Product page confidence: Are the core questions answered clearly, including specs, delivery, returns, and fit?
- CTA continuity: Does each page make the next action obvious, with no competing primary actions?
- Form effort: Are fields limited to what's necessary, with helpful validation and sensible mobile inputs?
- Checkout reassurance: Are costs, fulfilment details, and payment expectations visible before commitment?
- Error recovery: Can users recover from mistakes without losing progress or confidence?
- Mobile usability: Is every key task comfortable on a phone, not just technically possible?
- Trust signals: Do reviews, policy details, and payment reassurance appear near decision points?
Sample experiments to run
Try these as starting points:
-
Delivery information near CTA
Variant A keeps delivery details lower on the page. Variant B places concise delivery timing near the main call to action.
Primary metric: purchase completion. -
Detailed specs versus stripped-down product content
Variant A uses a minimal product page. Variant B adds scannable specifications, fit or compatibility details, and returns information.
Primary metric: add-to-cart rate, with purchase quality checked downstream. -
CTA clarity at checkout start
Variant A uses a generic button label. Variant B uses copy that makes the next step explicit.
Primary metric: progression to the next checkout step. -
Inline form guidance
Variant A shows validation only after submission. Variant B provides earlier guidance and clearer recovery language.
Primary metric: form completion.
Make Every Improvement Count
A team trims a checkout, removes a few fields, and sees no revenue lift. Another team adds delivery timing, returns detail, and payment reassurance to the same journey and gets a measurable gain. Friction reduction works like that in practice. The win comes from fixing the right point of hesitation, not from making an interface look simpler.
That is why high-performing CRO teams treat friction work as a revenue programme, not a design tidy-up. The task is to find where users slow down, identify the cause, change the experience, and measure the commercial result. In UK ecommerce especially, small losses at product, basket, or checkout stage add up fast because intent is already high and traffic is expensive.
Good prioritisation changes the conversation. Instead of debating taste, teams focus on points closest to cash flow: unclear product information, avoidable form effort, weak reassurance, hidden costs, and poor mobile usability. Each fix has a trade-off. Removing content can improve speed to action, but it can also cut the reassurance a buyer needs. Adding detail can improve confidence, but only if it answers a real objection instead of creating noise.
The practical approach is iterative and accountable. Diagnose. Rank by revenue impact. Test. Keep what lifts the metric. Drop what does not.
That process is less dramatic than a relaunch, but it is usually more profitable. Over time, each experiment sharpens the team's understanding of buyer behaviour and lowers the cost of future decisions. As noted earlier, Otter A/B gives teams a lightweight way to test headlines, CTAs, layouts, and other revenue-affecting changes without adding unnecessary implementation overhead.
Stop guessing
Ready to start testing?
Set up your first A/B test in under five minutes. No credit card required.
- 14-day free trial
- No credit card required
- Cancel anytime