A/B Testing in Marketing: A Practical Guide for Growth
A practical guide to A/B testing in marketing, covering experiment design, KPIs, statistical significance, and how to tie tests to revenue and growth.
You've launched a homepage experiment after a lively planning session. Variant B changes the headline, moves the call to action, and appears to produce more clicks almost immediately. The team wants to declare a win. Sales, however, says the new leads look less relevant, and the revenue dashboard hasn't moved.
That situation captures the core challenge of A/B testing in marketing. The hard part isn't putting two versions in front of visitors. It's designing a fair comparison, choosing an outcome that matters, and resisting the urge to turn noisy evidence into a confident decision. A disciplined programme treats each experiment as an operational decision about revenue, customer quality, and future learning.
What A/B Testing in Marketing Really Means
A homepage CTA test can look conclusive before it's trustworthy. Suppose variant B beats variant A by 12% over a long weekend. The result is exciting, but the apparent lift could reflect a Monday morning traffic pattern, a paid campaign that ended partway through the test, or a different mix of returning visitors. A short burst of stronger performance isn't the same as a reliable improvement.
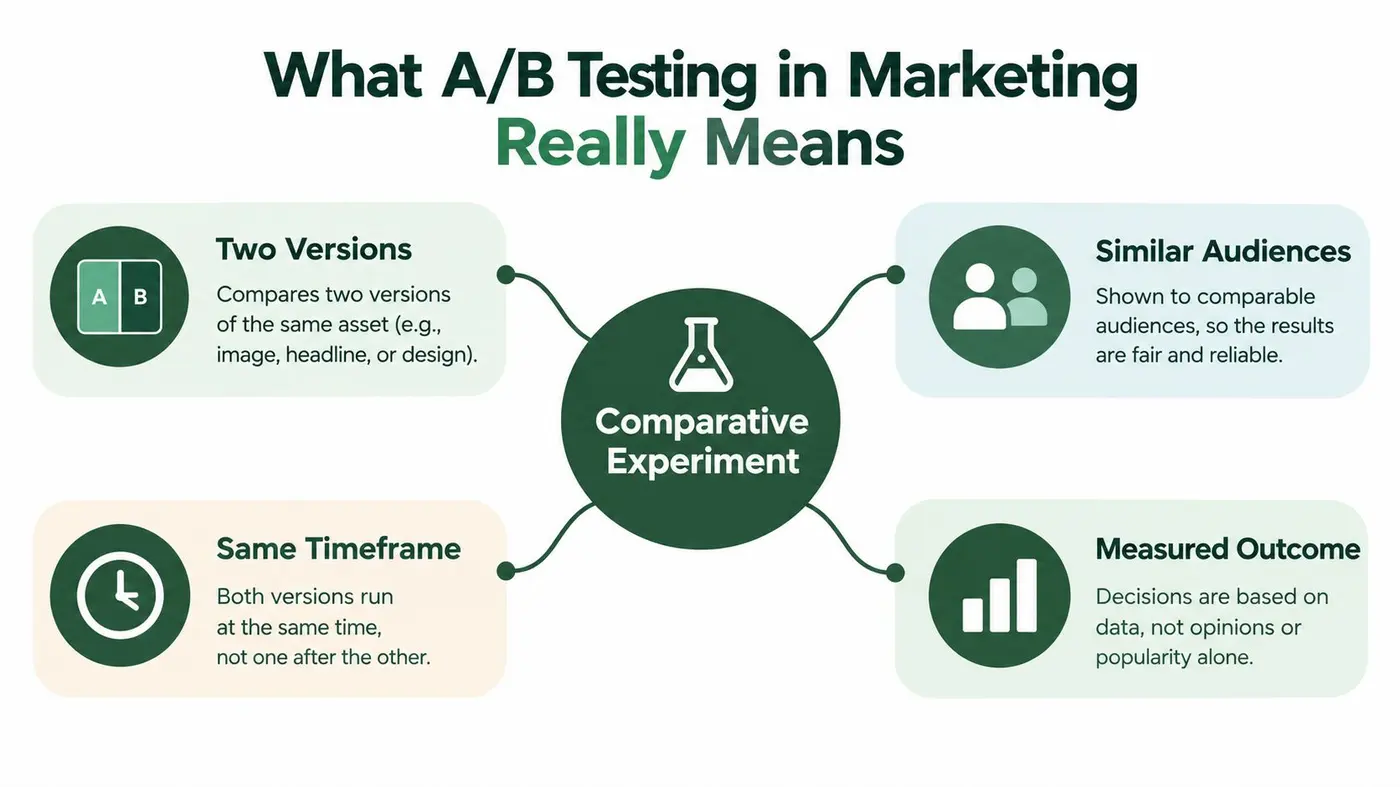
A/B testing is a controlled comparison between two versions of a marketing asset shown to comparable audiences during the same period. The asset might be a landing page, email, product page, pricing flow, or advertisement. Version A is usually the control, while version B is the challenger. The team measures a preselected outcome and asks whether the observed difference is large and reliable enough to guide a business decision.
What it is not
A/B testing isn't a one-time redesign followed by a before-and-after comparison. If you compare this month's conversion rate with last month's, the result can be affected by seasonality, campaign spend, pricing, traffic sources, and changes in audience intent. A simultaneous split reduces those confounding factors because both versions operate within the same market conditions.
It also isn't a popularity vote among colleagues. A headline that feels clearer to the marketing team may fail with buyers, while a visually plain CTA may outperform a more fashionable design. The test provides evidence only when the team defines the audience, timing, exposure, event tracking, and decision rule in advance. The practical distinction between A/B testing and related approaches is also covered in this guide to split testing in marketing.
Multivariate testing changes several elements at once and evaluates combinations of those changes. That can reveal interactions between a headline, image, and CTA, but it also demands more traffic and creates a harder interpretation problem. A/B testing is usually the cleaner starting point because the team can connect the outcome to a more specific intervention.
Practical rule: A winning click-through rate is only a useful result if the visitors who clicked went on to do something commercially valuable.
The promise of A/B testing is attribution. A well-designed experiment lets you say that a deliberate change probably caused a measured difference, rather than merely coinciding with it. That promise disappears when teams change multiple things without documenting them, compare different time periods, or celebrate an early result before the audience and data have stabilised.
Designing an Experiment That Actually Answers a Question
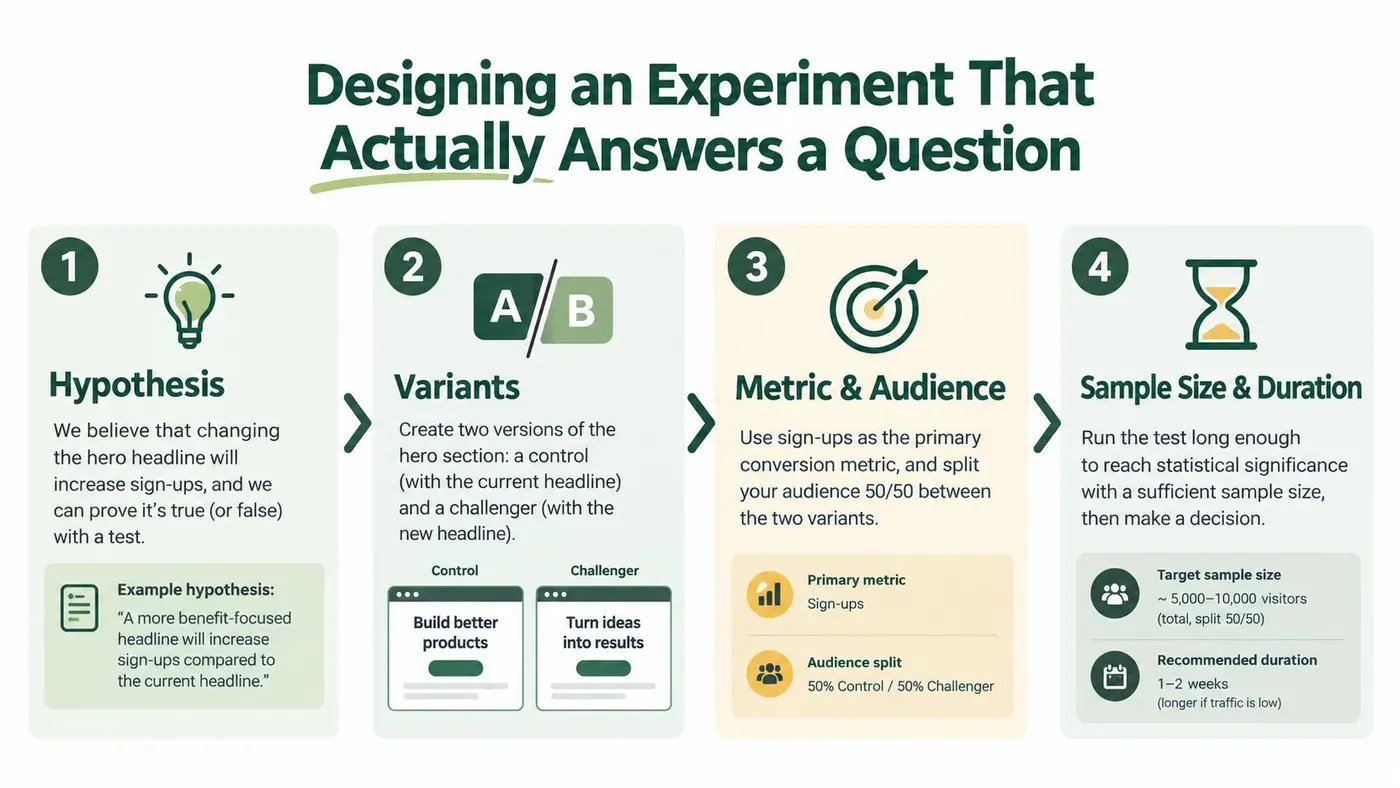
A strong experiment starts with a question someone could answer with a clear result. “Can we improve the homepage?” is too broad. “Will an outcome-led headline increase qualified demo requests because visitors currently can't tell what the product does?” gives the team something testable.
Use the homepage example to define four building blocks.
Start with a falsifiable hypothesis
The hypothesis should name the change, the audience problem, and the expected business outcome. The control might use a feature-led headline. The challenger might explain the customer outcome instead. Everything else, including the hero image, CTA location, form behaviour, and supporting copy, should remain unchanged unless the experiment is explicitly testing those elements too.
A precise variant specification protects the result from accidental scope creep. Write down the exact headline, device rules, rendering behaviour, eligibility criteria, and implementation owner before launch. If engineering changes the form while design changes the headline, you no longer know which intervention produced the outcome.
Define who sees what
Allocate traffic consistently and keep the audience rules stable. Match the main traffic sources where possible, then exclude internal users, known bots, test accounts, and visitors who shouldn't receive repeated exposure. Decide how returning visitors are handled before the test begins. A visitor who sees A on one visit and B on another can create attribution problems, especially when the conversion takes time.
The audience definition should also reflect the decision. If the headline is meant for new prospects, a test dominated by existing customers may produce a misleading average. Record device type, geography, source, customer status, and other meaningful attributes for later review, but don't keep slicing until a convenient segment appears.
Choose metrics and feasibility together
Set one primary metric, supporting guardrails, and a minimum detectable effect. For the homepage test, qualified demo requests might be primary, while form completion errors, bounce behaviour, sales acceptance, and downstream opportunity quality act as safeguards. A small click lift may not justify implementation effort if it doesn't improve qualified demand.
Finally, ask whether the change is worth testing at all. Can the team ship it cleanly? Is the expected effect large enough to matter? Is the available traffic sufficient to detect it within a reasonable window? A test that can't answer those questions is not a failed experiment. It's an experiment that wasn't ready to run.
Choosing the KPIs and Metrics That Tie to Revenue
Teams often start with the easiest metric to see. A new CTA attracts more clicks, the dashboard turns green, and the experiment is labelled a success. That conclusion is weak if the new wording attracts visitors who submit a form but never become qualified opportunities.
A useful measurement hierarchy separates diagnostic metrics from decision metrics. Click-through rate can help explain behaviour. Conversion rate can show whether a page moves more visitors to the next step. Neither automatically tells you whether the business earned more from the change.
| Metric | What It Measures | Decision It Supports |
|---|---|---|
| Click-through rate | The share of visitors who click an element | Whether copy, placement, or creative earns attention |
| On-page conversion rate | The share of visitors completing the immediate action | Whether a page or form removes friction |
| Average order value | The average value of completed orders | Whether merchandising, pricing, or offers affect basket size |
| Revenue per visitor | Revenue generated relative to exposed visitors | Whether the experience creates more commercial value overall |
| Qualified pipeline created | The value or volume of leads accepted by sales | Whether lead-generation changes attract viable prospects |
| Net revenue retention impact | The effect on retained and expanded customer revenue | Whether pricing or onboarding changes improve customer economics |
| Incremental margin | Additional contribution after relevant costs | Whether paid acquisition changes improve profitable growth |
Revenue per visitor is particularly useful for ecommerce because it combines purchase behaviour and order value into one commercial lens. Qualified pipeline is more appropriate for a B2B demo test, where a raw lead can conceal poor fit or low sales acceptance. Pricing and onboarding experiments need a longer view, because a higher initial conversion rate can coexist with weaker retention. Paid acquisition tests should include incremental margin when a variant changes spend efficiency or payback.
The metric that wins the test should be the metric that governs the rollout.
Consider a homepage challenger that increases CTA clicks but reduces qualified pipeline. The copy may be clearer, but it could also be making a broad promise that attracts the wrong audience. A variant can therefore win an interface metric while losing the business decision. Keep the diagnostic result because it tells you how behaviour changed, but don't promote the variant on that basis alone.
A practical rule keeps reporting honest: if a metric can't be tied to revenue within two steps, treat it as a diagnostic rather than a decision input. That doesn't make clicks or engagement useless. It gives them the correct job in the analysis.
Statistical Significance Without the Headache
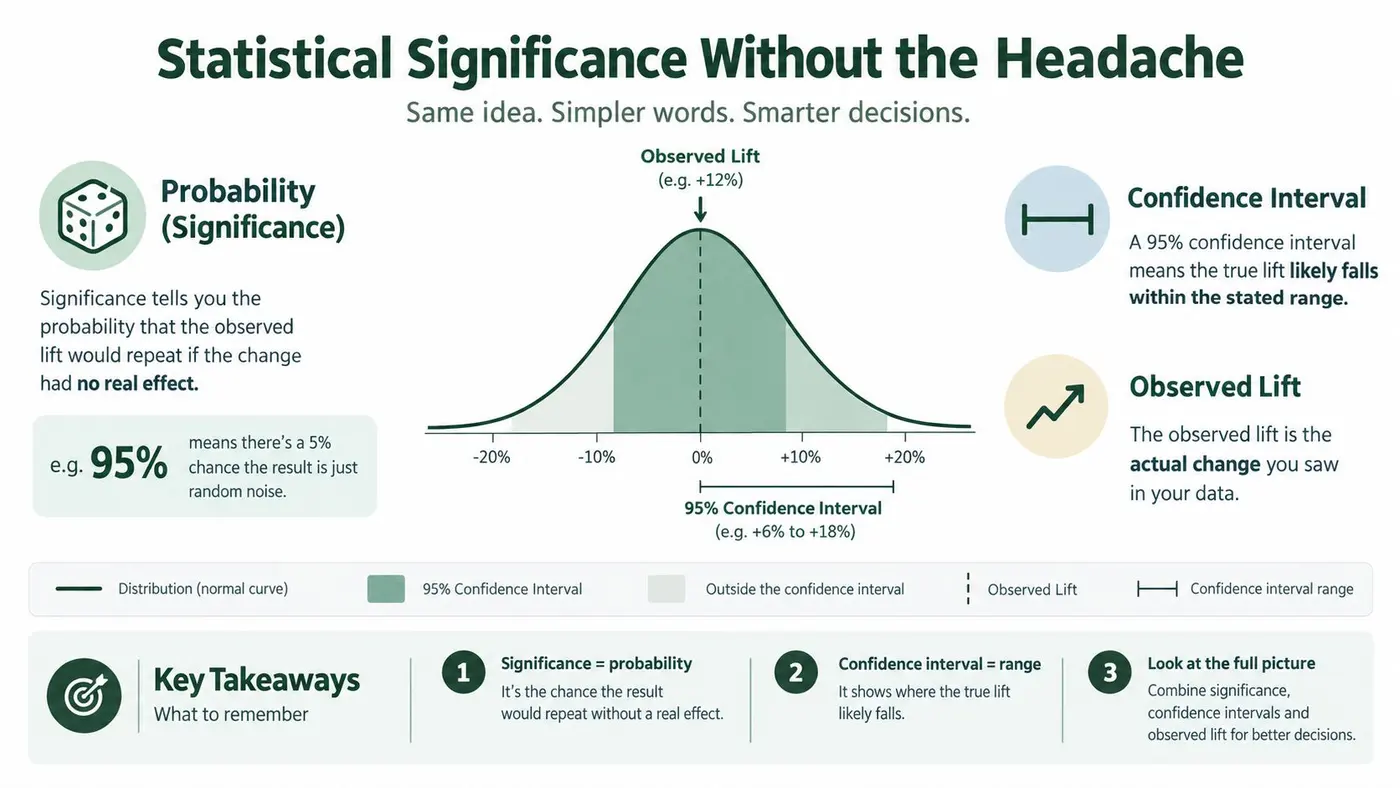
Statistical significance is a decision aid, not a guarantee. It asks how likely the observed difference would be if the change had no real effect. Confidence intervals add a range around the estimate, showing how uncertain the measured lift remains. A result can look positive while the plausible range still includes no meaningful improvement.
The operational questions are straightforward:
- What is the baseline? Establish the current conversion rate or revenue level.
- What change matters? Set the minimum detectable effect, meaning the smallest improvement worth acting on.
- How much evidence is needed? Choose the confidence level and statistical power before launch.
- How long will that take? Translate the required sample into a runtime using current traffic.
Many teams target 80% statistical power, which means the experiment has a strong chance of detecting an effect of the chosen size if that effect really exists. Sample size depends on the baseline rate, the minimum detectable effect, the confidence level, and the number of variants. Smaller expected changes require more observations, so a low-traffic site shouldn't spend its programme chasing tiny improvements.
Set the stopping rule before launch
Fix the sample size first, then calculate the runtime. For many early-stage marketing experiments, the required window falls somewhere between one and four weeks, but the actual duration depends on traffic, conversion behaviour, seasonality, and the effect size the team cares about. A calendar target alone is not a statistical plan.
A UK-focused dataset of 2,408 A/B tests found a median test duration of 22 days, while the reported median requirement was 14,800 sessions per variation to detect a 5% minimum detectable effect on a 3% baseline conversion rate at 95% confidence and 80% power (Otter A/B's ecommerce testing analysis). These figures aren't a universal template. They show why teams should calculate requirements from their own baseline and decision threshold.
A homepage CTA lift of 4.3% at 95% confidence may pass a rollout review if it clears the predefined practical threshold and the guardrails hold. A 2.1% lift at the same confidence may be statistically detectable but too small to justify engineering, design, risk, and maintenance. Significance doesn't replace judgement about materiality.
Bayesian methods use different language, often expressing the probability that one variant is better than another. The operational discipline remains similar: define the decision, collect sufficient evidence, check uncertainty, and avoid treating an early probability estimate as a guaranteed outcome. For a plain-English treatment of the subject, see this guide to A/B testing statistical significance.
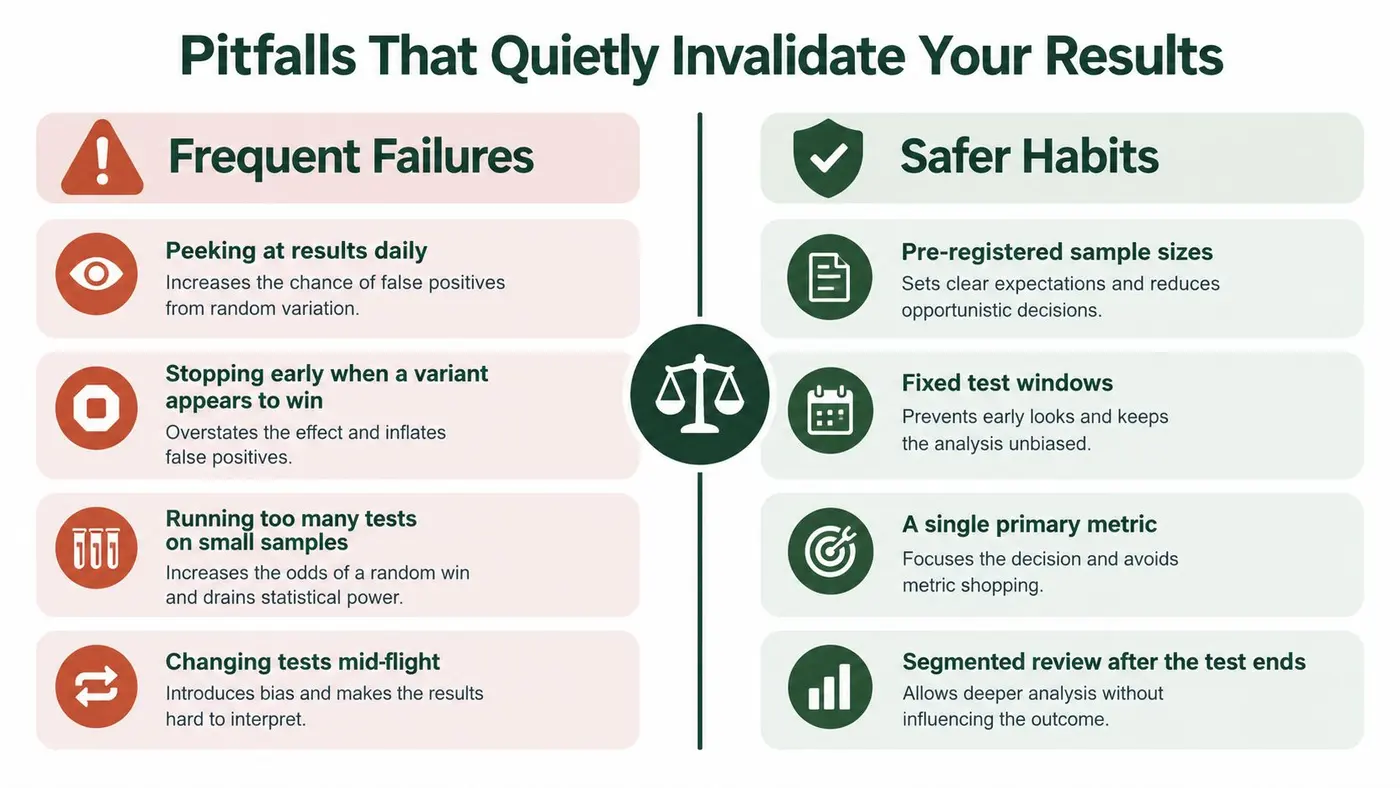
Pitfalls That Quietly Invalidate Your Results
Most bad experiment decisions don't come from a team refusing to measure. They come from teams measuring the wrong thing, stopping at the wrong moment, or changing the rules after seeing the data.
The early winner problem
Daily dashboards create a strong temptation to peek. If variant B leads after a few days, someone asks whether the team can stop early and ship it. Repeatedly checking and stopping when the result looks favourable increases the chance of treating random fluctuation as a discovery. A test that runs for two weeks isn't automatically reliable if the team decided to end it the moment the chart turned green.
Under-powered tests create the opposite failure. The team runs a modest traffic volume, hopes to detect a small lift, and then calls the result inconclusive. That may mean the idea failed, but it may also mean the experiment lacked the evidence needed to distinguish a real effect from noise.
Calendar habits aren't experimental controls
Stopping at a neat seven-day or fourteen-day mark can miss meaningful business cycles. A weekday-heavy audience may behave differently from weekend visitors, while a campaign launch, pay-day pattern, promotion, or product release can shift intent. Choose a duration that covers the relevant cycle and keep unusual events documented.
Running a test indefinitely creates its own problems. Novelty can fade, campaigns can change, and the control can become increasingly unrepresentative of the experience you'd operate. Stop when the predefined evidence and exposure requirements are met, not when the team gets bored or when the variant reaches a convenient round number.
Instrumentation and contamination failures
A button click is not a purchase. A form submission is not necessarily a sales-accepted lead. If the implementation tracks an intermediate event while the business reviews completed orders or qualified pipeline, the experiment can report a win that disappears in the revenue system.
Check for sample-ratio mismatch, broken mobile rendering, missing events, overlapping campaigns, and visitors exposed to more than one experiment. Don't create a new segment after seeing the overall result and present it as the primary answer. Segment review is valuable after the main analysis, but only when the team treats it as exploratory unless it was planned in advance.
Safer habit: Freeze the hypothesis, audience, primary metric, sample requirement, and stopping rule before the first visitor enters the experiment.
Turning One-Off Tests Into a Growth Programme
A testing programme compounds learning only when each result changes what the team does next. The starting point is a prioritised backlog, not a queue of ideas from whoever has the loudest opinion.
ICE is a simple way to rank hypotheses by impact, confidence, and ease. RICE adds reach, while PIE focuses on potential, importance, and ease. None of these frameworks predicts the future. They create a visible trade-off between a potentially valuable change and a low-effort change that merely happens to be convenient.
| Hypothesis | Impact (1-10) | Confidence (1-10) | Ease (1-10) | ICE Score |
|---|---|---|---|---|
| Clarify the homepage outcome in the hero headline | 8 | 7 | 8 | 7.7 |
| Reduce friction in the demo request form | 9 | 6 | 5 | 6.7 |
| Add proof near the pricing CTA | 7 | 6 | 7 | 6.7 |
| Reorder secondary navigation links | 4 | 5 | 9 | 6.0 |
The scores above are planning judgements, not performance claims. The best first test usually sits where commercial impact and confidence overlap with an implementation the team can control. Don't let ease become a disguised strategy. A fast test that answers an irrelevant question can consume the same review time as a high-value experiment.
Build a usable learning record
Every completed test should leave a compact record:
- Hypothesis: What change did the team expect to matter, and why?
- Implementation: What changed, for whom, and under which conditions?
- Outcome: What happened to the primary metric and guardrails?
- Confidence: How much uncertainty remains?
- Decision: Roll out, iterate, retest, segment, or stop?
- Operational takeaway: What should the next team avoid or investigate?
A central repository prevents the same idea returning under a new label. A homepage lesson can inform pricing-page copy, onboarding prompts, sales enablement, and paid landing pages without being copied blindly. The result is a connected body of evidence rather than a collection of isolated dashboard screenshots.
Tie cadence to the roadmap
Quarterly planning should reserve experimentation capacity against funnel stages, campaigns, and product initiatives. A test should have a reason to exist in the roadmap. That reason might be improving acquisition quality, reducing checkout friction, supporting a new offer, or validating an onboarding change.
A squad may run 2 to 4 concurrent tests when its traffic, engineering capacity, and audience separation support that load. More tests aren't automatically better. Overlapping experiments can contaminate one another, stretch analysis capacity, and encourage shallow hypotheses.
A north-star metric keeps the programme pointed at commercial value. The distribution of outcomes matters too. In the UK-focused study of 2,408 tests across 240 brands, 17.4% produced a statistically significant winner, while 74.2% were inconclusive or showed no detectable difference (the 2026 UK A/B testing study). The lesson is practical: a programme must be designed to learn from non-winners, not structured around the expectation that every launch will produce a rollout.
A Practical Checklist Before and After Every Test
A good checklist turns experimentation from a specialist ritual into normal team operations. Keep it short enough to use in a stand-up, but specific enough that someone can verify each item rather than nodding at a principle.
Before launch
- Name the question: Write the hypothesis in a falsifiable sentence.
- Freeze the change: Document the control and challenger, including copy, layout, logic, and device behaviour.
- Set eligibility: Define traffic sources, new and returning visitors, geography, customer status, exclusions, and allocation.
- Choose the primary metric: Select the outcome that determines rollout.
- Add guardrails: Include errors, cancellations, lead quality, order value, margin, or other risks relevant to the change.
- Set the minimum detectable effect: Decide what improvement would justify shipping.
- Calculate the requirement: Record the needed sample, power, confidence level, and expected runtime.
- Name owners: Assign responsibility for implementation, analytics validation, approval, and final decision.
- Test the tracking: Confirm that both variants fire the correct page views, clicks, custom events, purchases, revenue, or CRM events.
- Check the experience: Review mobile, desktop, accessibility, loading, form behaviour, and fallback states.
The A/B testing best practices guide is useful as a companion reference, but the team still owns the experiment design. A platform can calculate a result. It can't decide whether the hypothesis was commercially meaningful or whether a tracking event represents a real customer outcome.
After readout
- Check allocation: Look for sample-ratio mismatch and unexplained delivery differences.
- Validate the window: Confirm the test covered the relevant business cycle and record campaigns or incidents.
- Inspect the primary result: Review the estimate, uncertainty, practical effect, and guardrails together.
- Review planned segments: Compare meaningful audiences without promoting an unplanned slice to the main conclusion.
- Reconcile revenue: Check orders, average order value, qualified pipeline, retention signals, or margin in the source system.
- Record the outcome: Mark the test as a rollout, iteration, retest, segment opportunity, or inconclusive result.
- Choose one next action: Assign the owner and date for implementation, follow-up research, or termination.
A negative or inconclusive test deserves the same documentation as a winner. It may prevent an expensive rollout, refine the next hypothesis, or reveal that the problem sits somewhere else in the funnel. The discipline is complete only when the result changes the roadmap.
For teams that want to operationalise this workflow, Otter A/B provides visual experiment creation, traffic allocation, goal tracking, revenue-per-variant reporting, and statistical readouts for website tests. Start a test with Otter A/B, connect the result to commercial metrics, and give your next growth decision a clearer evidence trail.
Stop guessing
Ready to start testing?
Set up your first A/B test in under five minutes. No credit card required.
- 14-day free trial
- No credit card required
- Cancel anytime