What Is Split Testing in Marketing and How It Works
What Is Split Testing in Marketing. Learn what split testing in marketing is, how A/B testing boosts conversions, key metrics, common pitfalls, and practical
Split testing in marketing is a randomised experiment that compares two or more versions of a page or creative against a control, with traffic split equally and outcomes judged at p < 0.05. In UK government practice, that usually means a 50/50 allocation, so the result reflects measured user behaviour rather than a design opinion.
You may be facing the familiar problem right now: a checkout page is attracting visitors, but fewer people are completing their orders than your forecast suggests. Someone proposes changing the button colour, another person wants shorter copy, and a third recommends a full redesign. Split testing gives the team a safer way to decide. Instead of arguing over preferences, you expose different users to controlled versions and compare the result against a defined business goal.
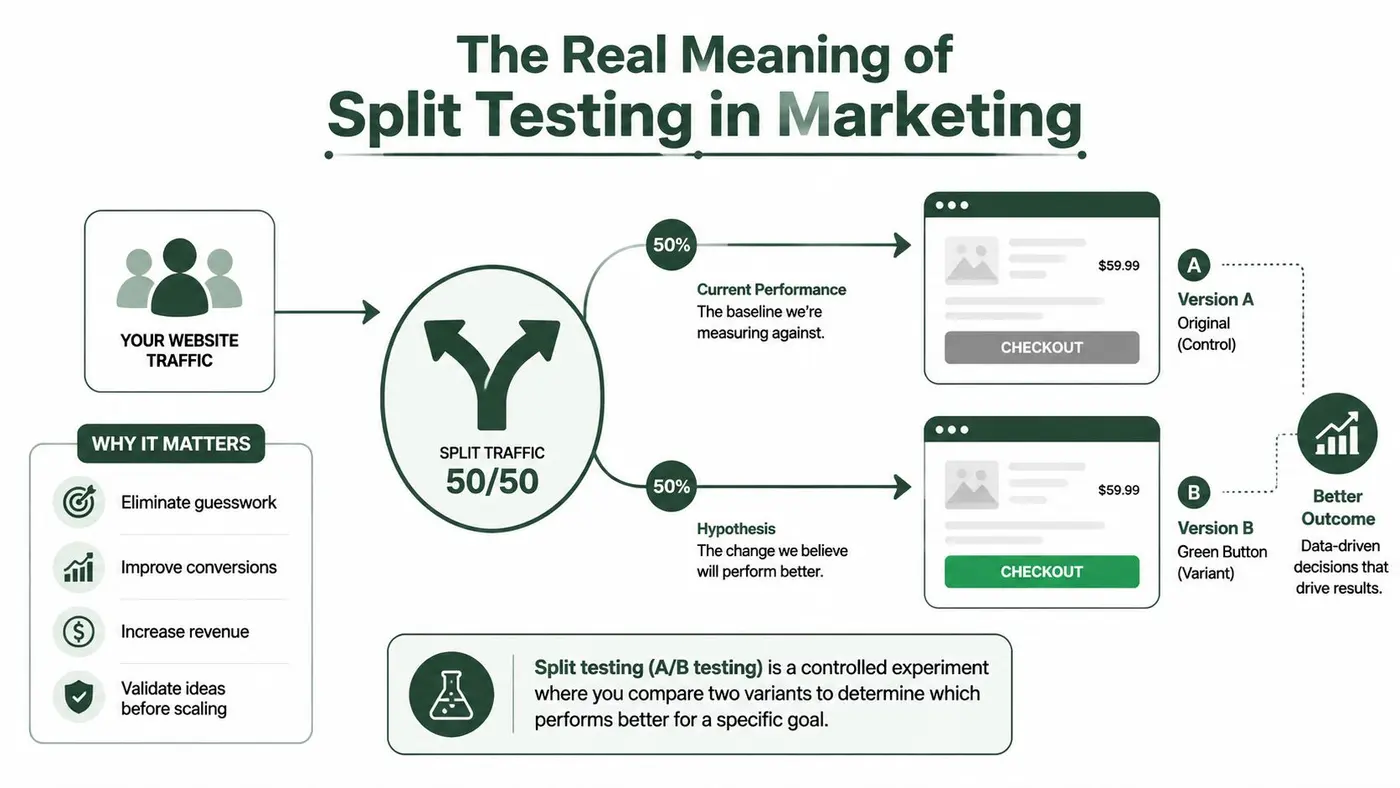
The Real Meaning of Split Testing in Marketing
Suppose your current checkout page is underperforming. You create a second version with a different call-to-action button and send half of the eligible visitors to the existing page and half to the new one. The important detail isn't the button colour. It's the random allocation, the shared conditions, and the decision rule applied after enough data has been collected.
In plain English, split testing asks: if we change this one thing, does the target outcome change reliably? Version A is usually the control, meaning the current experience. Version B is the variant, or challenger. The outcome might be checkout completion, a purchase, a form submission, or another conversion that matters to the organisation.
UK public-sector practice makes the discipline especially clear. UK Government guidance on A/B testing defines split testing as showing two versions to randomly assigned users and comparing outcomes with statistical analysis. GOV.UK guidance says users should be split equally and randomly, while HMRC describes a common setup in which 50% receive the variant and 50% receive the control. The UK Government Communication Service commonly uses p < 0.05 as its significance threshold, which means the observed difference has less than a 5% probability of being caused by chance under the test assumptions.
Why the method matters
GOV.UK and HMRC have treated experimentation as part of digital service delivery, not merely as a campaign trick. Their documented processes include testing through Fastly or CDN infrastructure, maintaining an A/B test register, and analysing results with GA4 custom dimensions, as described in the UK government's operational A/B testing guidance. That history matters because it shows how a simple comparison became an operational decision system for real user journeys.
A split test won't always produce a winner. A UK dataset covering 2,408 A/B tests across 240 brands found that only 17.4% produced a statistically significant winner. The same source reported 38.4% as significant results showing no detectable difference and 35.8% as inconclusive because the sample was insufficient, while winning tests had an average uplift of 8.4% and a median uplift of 6.1%. These figures are from Visionary Marketing's UK experimentation analysis, and they make the practical lesson hard to miss: most tests are learning exercises, not instant victories.
A/B testing normally compares a control with one challenger, or a small number of challengers. Multivariate testing changes several elements at once and evaluates combinations. The former is easier to interpret because the team can connect the outcome to a focused hypothesis. The latter can reveal interactions, but it demands more traffic and produces more complicated evidence.
A/B Testing and Multivariate Testing Compared
A team preparing its first formal experiment has a practical choice: isolate one decision, or examine how several page elements work together. A/B testing compares a control with a focused alternative, such as a shorter headline or a different CTA. Multivariate testing changes multiple elements and evaluates their combinations, such as different pairings of a headline, hero image, navigation, and button treatment.
The choice should follow the decision you need to make, not the apparent sophistication of the method. UK public-sector practice, including guidance used around GOV.UK and HMRC journeys, treats testing as part of an operating process. That means selecting a method the team can interpret, record, and act on, rather than launching a complex test because the platform supports it.
| Decision criterion | A/B testing | Multivariate testing |
|---|---|---|
| Decision to make | Which focused change should we adopt? | Which combination works best, and do elements affect one another? |
| Suitable question | Will clearer checkout CTA copy improve completion? | Does the effect of the CTA depend on the headline or page layout? |
| Evidence to review | A relatively direct comparison against the control | Main effects plus interactions between changed elements |
| Operational fit | Easier to brief, analyse, document, and roll out | Requires stronger measurement and a clear plan for interpreting combinations |
| Choose it when | One decision can be expressed in one sentence | The interaction between elements is the decision itself |
For example, an online service team could test a clearer HMRC-style form instruction against the existing wording. If the question is whether that instruction helps users continue, A/B testing keeps the decision narrow. The team can hold the form structure constant and assess the agreed primary metric without trying to explain several simultaneous changes.
MVT fits a different situation. Suppose a high-traffic landing page depends on the relationship between its promise, image, navigation, and CTA. A combination may work because the elements reinforce one another. Testing each element separately could miss that relationship, while a multivariate design can examine it directly. The trade-off is a larger evidence burden, since each combination needs enough observations to support a useful conclusion.
This guide to multivariate testing provides further detail when interactions, rather than one isolated change, are the subject of the experiment.
Organisations launching their first formal testing programme will usually gain clearer operational learning from a focused A/B test. That is a decision rule, not a universal ranking. Choose MVT when the interaction question is explicit, the measurement setup can support it, and the team has agreed how each possible result will affect the product. Otherwise, a simpler test is easier to interpret and more likely to produce an action the organisation can document and implement.
The Split Testing Workflow From Hypothesis to Rollout
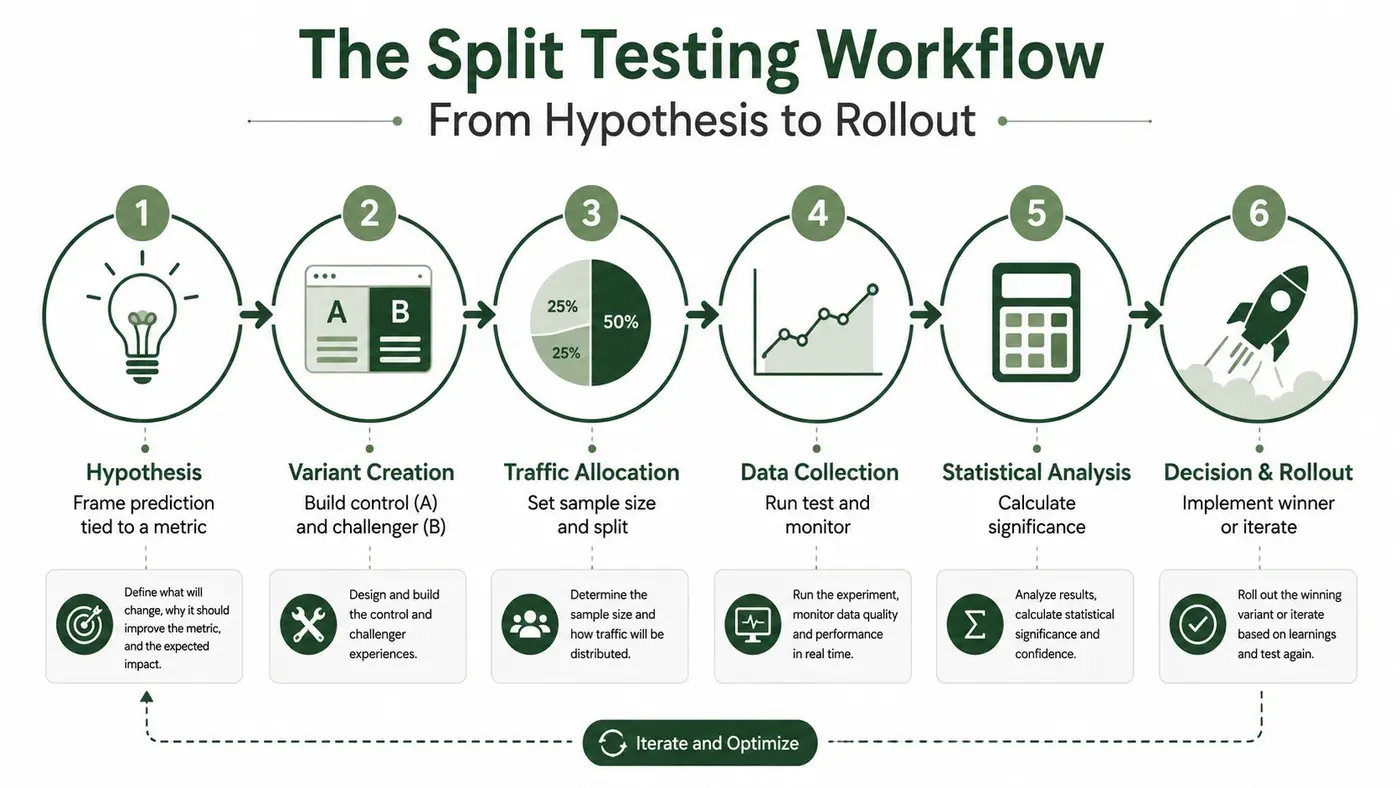
A useful workflow protects the experiment from vague objectives and last-minute decisions. The following six steps work across e-commerce, SaaS, lead generation, email, and product UX.
-
Write the hypothesis. Describe the change, the audience, the expected behaviour, and the primary metric. For example, you might predict that changing a checkout button from grey to green will increase completion from 3.2% to 3.6%. Those values are an example of how to express a prediction, not a general benchmark.
-
Build the variants. Change only what the hypothesis requires. If the question concerns CTA clarity, keep the page structure, pricing, imagery, and form fields stable. Unnecessary changes turn one experiment into several overlapping explanations.
-
Allocate traffic. Use the platform's randomisation engine to assign visitors evenly, commonly 50/50 for a control and one variant. Verify that assignment works, that returning visitors remain consistently bucketed, and that analytics records the correct experience.
-
Choose metrics before launch. Set one primary conversion metric, then add guardrails. A checkout test might track completion as its primary measure while monitoring average order value, page load time, refunds, or customer support contacts for unintended effects.
-
Set the evidence threshold. Calculate the required sample size before launch using visitor volume, baseline performance, expected effect size, and the minimum detectable effect. UK guidance warns that an underpowered test can stay inconclusive even where a real uplift exists. Don't stop only because the dashboard looks promising early.
-
Roll out and record the learning. Declare a winner only when the result meets the agreed significance threshold and has adequate power. Ship the supported version, check the implementation, and store the hypothesis, audience, change, result, and decision in a shared experiment log.
A CRO programme needs more than a testing interface. Research, prioritisation, analytics QA, and stakeholder communication all determine whether the organisation learns. Teams working on Shopify can browse this CRO playbook for Shopify for broader optimisation context alongside their experiment plan.
The workflow also benefits from visual explanation during team training. The following video can help newcomers understand the basic mechanics before they work with live data.
Key Metrics and Statistical Concepts You Need
A test result is only useful if the team knows what it was designed to measure. The primary metric should represent the decision you need to make. For e-commerce, that might be purchase completion or revenue per visitor. For SaaS, it could be activation or a meaningful product action. For an email, click-through may be more relevant than an open.
Guardrail metrics protect against a narrow win that damages the wider experience. Depending on the journey, monitor bounce behaviour, average order value, page speed, cancellations, complaints, or support tickets. A variant that generates more clicks but creates lower-quality orders hasn't necessarily improved the business.
The statistical ideas in plain English
The UK dataset cited earlier found that only 17.4% of tests produced a statistically significant winner, while many showed no detectable difference or remained inconclusive. That result makes statistical planning operational rather than academic. It helps the team distinguish “we saw a lead” from “we have enough evidence to act”.
| Concept | Typical target | What happens if you skip it |
|---|---|---|
| Confidence level | 95%, commonly represented by p < 0.05 | The team accepts a higher risk of treating random variation as a real effect |
| Statistical power | 80% | A genuine difference may go undetected, creating a false negative |
| Minimum Detectable Effect | A predefined smallest effect worth detecting | Sample size and business value become disconnected |
| Sample size | Calculated from baseline, expected effect, variants, and duration | The test may be underpowered or waste traffic |
| Primary metric | One declared outcome | Teams can search many metrics until something appears positive |
| Guardrails | Measures of quality, value, or harm | A local conversion gain can hide a broader business cost |
A p-value helps evaluate how unusual the observed difference would be if the tested versions were effectively equal under the statistical model. It doesn't tell you the probability that your variant is true, nor does it measure commercial importance. A small effect can be statistically reliable but not worth implementing, while a large-looking effect can disappear when the sample is too small.
Power addresses the opposite danger. If your test lacks sufficient power, the absence of significance doesn't prove that the variants perform identically. It may mean the experiment couldn't detect the chosen effect size.
Decision rule: Treat “no detectable difference” and “inconclusive” as different outcomes. Keep the control, refine the idea, or gather more evidence based on which one you have.
A one-tailed test asks whether one direction was expected in advance. A two-tailed test allows the variant to perform either better or worse. Choose the approach before viewing results, and document why it fits the hypothesis. For practical guidance on planning power, use this explanation of statistical power in A/B testing.
Common Pitfalls and How to Avoid Them
The belief that more tests automatically create more wins causes teams to value activity over evidence. The UK data on experimentation barriers supports a different diagnosis. 43% of marketers cited lack of budget, while 39% cited lack of resources, time, or focus; 20% said their current web experimentation approach wasn't effective, according to UK data on barriers to marketing experimentation.
Those constraints make process more important, not less. A team with limited traffic and limited time can't afford to launch poorly specified experiments or discard useful null results.
Where tests go wrong
-
Underpowered tests: Too little traffic makes the result unstable or inconclusive. Calculate sample requirements before launch and reduce the number of simultaneous questions.
-
Peeking at results: Repeatedly checking the p-value and stopping at the first promising movement changes the decision process. Use a fixed-horizon rule, or use a sequential method designed for repeated looks.
-
Too many variants: Each extra variant spreads observations more thinly and increases the opportunity for a false positive. Keep the initial experiment focused. If many comparisons are unavoidable, consider a correction such as Bonferroni or false-discovery-rate control.
-
Segment hunting: A null overall result can appear positive for mobile visitors, returning visitors, or a particular channel purely because the team checked enough slices. Predefine important segments and validate an apparent segment effect in a follow-up or holdout test.
-
External changes: Sales activity, seasonality, pricing changes, and acquisition campaigns can alter the audience while the test runs. Record those events and avoid treating an unusual period as a normal baseline.
-
Weak documentation: Without the original hypothesis and stopping rule, a later analyst can't tell whether the decision followed the plan. Maintain a shared experiment log with the implementation details, metric definitions, result, and next action.
Statistical discipline doesn't mean refusing to learn from an inconclusive experiment. It means labelling the evidence accurately, then choosing whether to repeat, redesign, or move to a stronger opportunity.
Practical Examples for E-commerce and Product UX
A split test becomes easier to understand when you follow the decision from the initial hypothesis to the learning. The examples below illustrate the structure teams should record, while the outcomes are qualitative scenarios rather than reported performance claims.
E-commerce checkout
An online retailer suspects that its address form creates unnecessary friction. The hypothesis is that reducing the form from five fields to three will improve checkout completion without harming order quality. The control and variant receive an even random allocation, with completion as the primary metric and support contacts as a guardrail.
The first result suggests a small improvement, but the team doesn't ship immediately. When the analysis is separated by device, the effect holds on desktop but not on mobile. The lesson isn't “shorter forms always win”. It's that a form change can interact with screen size, input behaviour, and error handling, so the mobile experience deserves its own investigation.
For further ideas, review these practical A/B testing examples and adapt them to your funnel rather than copying another site's result.
SaaS onboarding
A product team wants more new users to reach a meaningful activation event. It tests a guided tour against a blank dashboard, routing new accounts evenly and measuring activation at day seven as the primary outcome. The result shows no detectable difference.
That isn't wasted effort. The team learns that the tour may not address the actual barrier, so it interviews users, examines where they stop, and redesigns the first task instead of polishing the tour. The test prevents a confident launch of a feature that didn't solve the problem.
Direct-to-consumer imagery
A retailer believes a lifestyle hero image will make the product feel more relevant than a plain product photograph. The experiment tracks purchases and revenue per visitor, then compares new and returning visitors as predeclared audience contexts.
The lifestyle image performs better for new visitors but not for returning ones. That result supports a more precise rollout, perhaps using different creative for acquisition and retention audiences, subject to further validation. The learning is more valuable than a single sitewide winner because it identifies where the message fits and where it doesn't.
Tooling, Checklist and Frequently Asked Questions
Tools should reduce implementation risk, not replace experimental judgement. Your stack may include an experimentation platform, GA4, a customer data layer, Shopify or another commerce system, and a documentation space. Check that the platform can preserve assignment, record exposure, connect conversions to the right variant, and support the statistical method your team has agreed to use.
For teams comparing lightweight options, Otter A/B provides visual variant creation, traffic allocation, goal tracking, revenue-per-variant measurement, and integrations including Shopify, WordPress, Webflow, Wix, WooCommerce, ClickFunnels, Squarespace, Framer, Next.js, and Google Tag Manager. It can support client-side and server-side experiments, while its frequentist engine reports significance at a 95% confidence threshold. Treat those capabilities as implementation options, not substitutes for sound hypotheses or adequate samples.
The pre-launch checklist
- Hypothesis: Is the predicted change tied to a user problem and business metric?
- Primary metric: Has the main decision metric been fixed before launch?
- Sample size: Has the required sample been calculated from baseline and detectable effect?
- Threshold: Have the confidence and power requirements been agreed?
- Allocation: Is traffic randomised and evenly assigned where appropriate?
- Quality assurance: Has the experience been checked across relevant devices and browsers?
- Tracking: Do exposure and conversion events appear correctly in analytics?
- Stopping rule: Does everyone know when the test can end?
- Stakeholders: Have product, marketing, engineering, and support teams been informed?
- Retro: Is there a template ready for recording the result and next action?
Frequently asked questions
How long should a test run?
There isn't a universal duration. Use the planned sample size, expected effect, visitor volume, and traffic stability to determine the window. Don't stop because a variant leads briefly, and don't extend a test to search for a preferred answer.
What should we do with an inconclusive result?
Check tracking, sample adequacy, audience consistency, and implementation first. If the setup is sound, record the result and either keep the control, test a sharper hypothesis, or prioritise another opportunity.
Can paid traffic be included?
Yes, if the assignment and audience are comparable. Record campaign changes, creative shifts, bidding changes, and landing-page differences because paid traffic can change quickly.
How does consent affect testing?
Follow your organisation's GDPR and analytics governance requirements. Make sure the experiment respects the consent state and doesn't collect or retain data beyond the stated purpose.
UK survey data also shows why sustaining a programme is difficult. In 2024, 65% of marketers used AI within their experimentation approach, and two-thirds of those adopters used it to improve personalised content, while 20% still considered their approach ineffective, according to UK data on AI in marketing experimentation. AI can help generate hypotheses, draft variants, or support personalisation, but it can also encourage indiscriminate testing. Teams should evaluate AI outputs with the same discipline as human ideas.
For wider commercial context, CRO strategies for sales teams can help connect conversion work with lead quality and sales follow-up. The important operating principle is consistency: a test log, prioritised backlog, clear ownership, and regular review turn split testing from an occasional campaign tactic into a repeatable learning system.
Otter A/B helps teams run controlled experiments on headlines, CTAs, layouts, purchases, average order value, and revenue per visitor without committing to a large enterprise platform. Visit Otter A/B to start planning your next hypothesis and connect the result to the business metric that matters.
Stop guessing
Ready to start testing?
Set up your first A/B test in under five minutes. No credit card required.
- 14-day free trial
- No credit card required
- Cancel anytime