A B Testing Website Guide That Actually Ships Results
A B Testing Website. Run real A B testing on your website with this hands-on guide. Learn experiment design, traffic splitting, significance testing
The team has a backlog of ideas, a developer ready to change the checkout, and a manager asking when the test will produce a winner. The easy move is to launch a variation and watch the conversion graph. The harder, more useful question is whether the change will produce better business results without slowing the site, skewing the measurement, or creating a worse customer experience.
That's the difference between running a test and running a sound experiment. For a UK retailer, online journeys now shape a substantial share of commercial activity, so a small change can matter. But a statistically significant lift isn't automatically a good decision if it comes with lower revenue, weaker performance, or unreliable data.
What a Website A B Test Really Is
A growth meeting ends with the familiar assignment: “We should run some tests.” Someone suggests a brighter checkout button, someone else wants to rewrite the product headline, and a developer asks which change needs building first. Without a shared definition of the experiment, the team can easily end up testing several ideas at once and learning very little from the outcome.
A website A/B test is a controlled comparison. Visitors are randomly assigned to an existing experience, the control, or a changed experience, the variant. The team then compares a predefined outcome, such as completed purchases or revenue per visitor, to understand whether the change affected the result. Random assignment helps make the groups comparable, but it doesn't fix a weak hypothesis, faulty tracking, or a metric that doesn't reflect the business goal.
The test type should match the question. A standard A/B test compares the control with one variant. An A/B/n test compares the control with several variants, which can help evaluate distinct versions of one idea but divides visitors among more experiences. A multivariate test examines combinations of changes, such as different headlines paired with different calls to action. That can help reveal interactions between elements, but it also makes interpretation and traffic requirements more demanding.
The stakes have changed as UK retail has moved online. ONS data records internet sales at 3.4% of total UK retail sales in 2007, rising to 19.2% in 2019 and 33.4% in May 2020 during the pandemic disruption (ONS internet sales data). That shift makes digital experience a commercial concern, not a cosmetic one. Testing can help teams decide what to change, but it doesn't turn every result into a mandate to ship.
Keep the decision bigger than the flag: A test result tells you about an observed outcome under a particular setup. It doesn't, by itself, prove the change is good for the business.
Teams that want a practical companion for interpreting outcomes can consult these AB test analysis articles. The working principle is simple: treat each test as a way to reduce uncertainty, not as a machine for producing winners.
Designing an Experiment You Can Trust
The most expensive testing mistakes often happen before the code is written. Teams launch a variation without agreeing on what they're trying to learn, then negotiate the success metric after the dashboard starts showing results. That creates room to favour whichever number looks most encouraging.
Start by stating the problem and hypothesis in plain language. For example: “Shoppers may hesitate at checkout because delivery timing is hard to find. Showing the estimated delivery window beside the order summary may increase completed purchases without reducing revenue per visitor.” The proposed change is specific enough to build, and the reason for testing it can be challenged before launch.
Next, choose one primary metric. If the hypothesis concerns completed orders, purchase conversion may be the primary measure. Decide in advance how you'll assess commercial impact, including revenue per visitor or order value, and set relevant guardrails such as page performance. Don't change the primary metric once the test is underway just because another result looks more favourable.
Agree on the decision rules first
Work out the minimum detectable effect the business considers worth acting on, then use the baseline rate and experiment design to estimate the sample size needed to detect it. A smaller effect usually takes more evidence to distinguish from ordinary variation. Set a stopping rule before launch, and plan for a test duration that includes representative customer behaviour rather than ending as soon as a dashboard turns green.
A UK-focused dataset covering 2,408 ecommerce tests reports that 17.4% produced a statistically significant winner, while 74.2% were inconclusive or showed no detectable difference (UK ecommerce test analysis). Those figures are a useful reminder: an inconclusive outcome isn't an excuse to keep checking until the test produces a preferred answer.
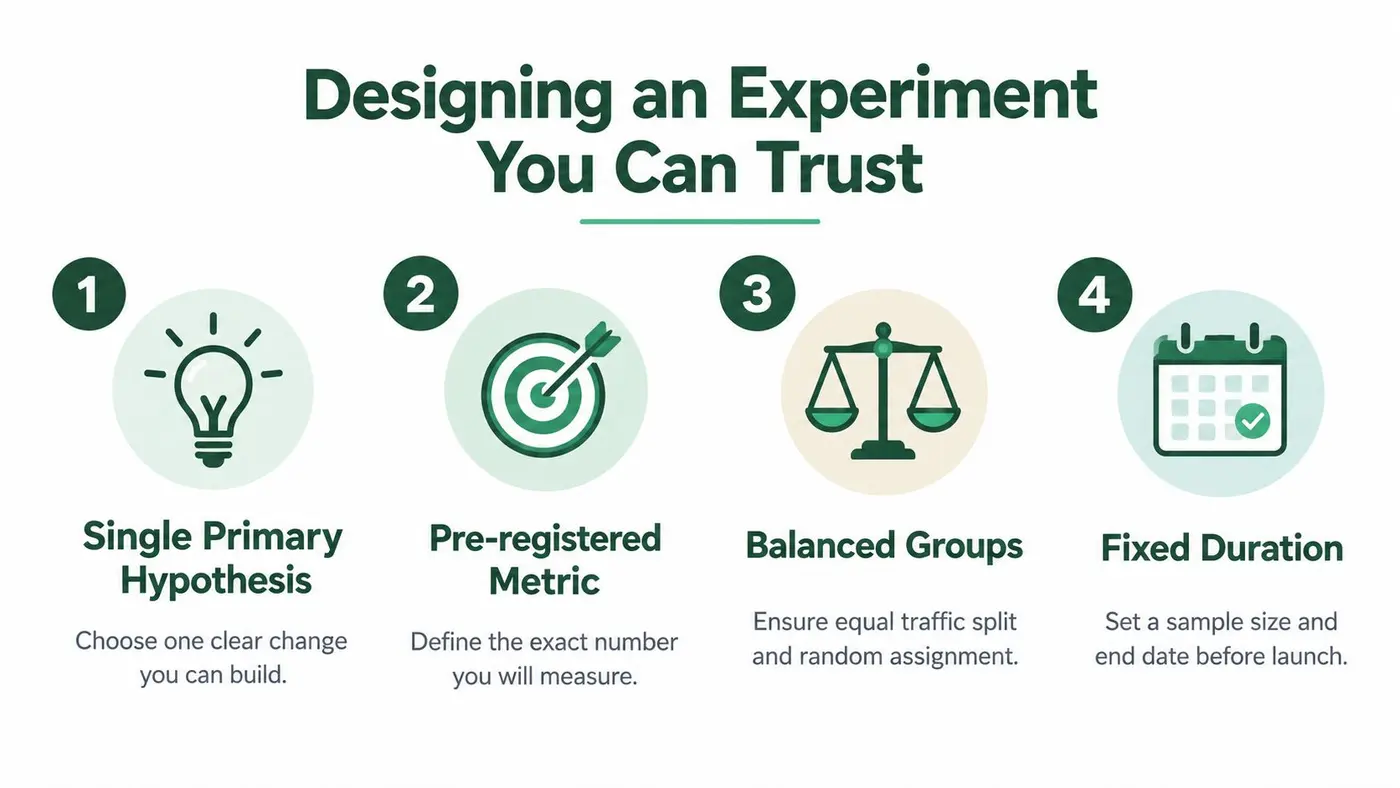
A one-page test brief can keep everyone aligned:
- Hypothesis: What customer problem are you addressing, and what change could address it?
- Primary metric: What single outcome will drive the decision?
- Guardrails: Which business or experience measures must not deteriorate?
- Audience and allocation: Who is eligible, and how will random assignment work?
- Sample and stopping rule: What evidence is needed, and when will analysis begin?
- Decision plan: What will the team do if the result is positive, negative, or inconclusive?
For the checkout example, the brief should also state how the team will treat revenue, device mix, and timing. Once the team agrees on those choices, implementation becomes an engineering task rather than an argument about what success means.
Implementing Variants Without Hurting Performance
A test can be well designed and still fail in production. The usual culprits are late-loading scripts, a visible flash of the original page before the variant appears, assignment that changes between visits, or conversion events that fire inconsistently. These issues affect both the customer experience and the trustworthiness of the result.
Choose a client-side snippet or server-side implementation based on what you're changing. A client-side tool can suit presentation changes such as headlines, layouts, or button copy. More fundamental changes to application logic may need server-side assignment so the server sends the intended experience from the outset. Whichever route you choose, have the team check script loading, variant rendering, event wiring, and fallback behaviour before sending production traffic.
Performance is a guardrail, not a detail to inspect after the test. Google's “good” Core Web Vitals thresholds are LCP at or below 2.5 seconds, INP at or below 200 milliseconds, and CLS at or below 0.1, assessed at the 75th percentile of real-user visits (Core Web Vitals and UK site performance). A testing script that adds work to the page, blocks rendering, or shifts content can undermine the change it is meant to measure.
Assign people consistently and QA the journey
Decide whether assignment persists at the visitor or session level. Visitor-level assignment usually keeps a returning shopper in the same experience, which avoids showing them different versions across visits. Session-level assignment can make sense for some questions, but it risks inconsistent experiences when customers return before purchasing. Document the choice and confirm that the assignment survives the navigation and return journeys you expect.
Before launch, test both variants on the devices and browsers your audience uses. Confirm that the purchase event fires once per completed order, that revenue values are attached correctly, and that a visitor doesn't switch between versions after refreshing or moving through the funnel. A small test that looks correct on a developer's machine can still break in a tag manager or on a real checkout.
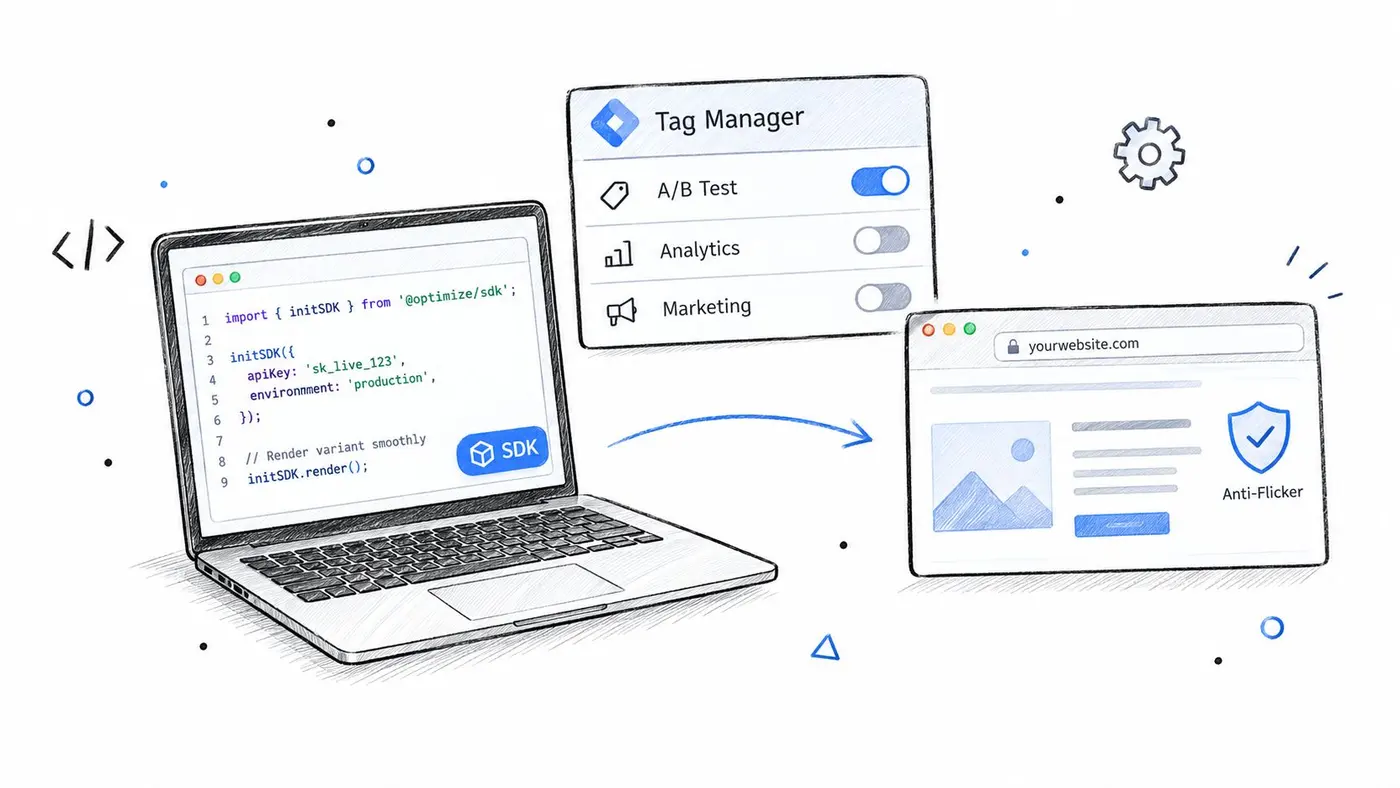
Otter A/B is one example of a website testing platform that provides a JavaScript snippet, traffic allocation, and goal tracking. For implementation teams, its stated SDK size and loading characteristics are product claims to verify against the site's own monitoring, not a substitute for measuring real-user performance after launch. Teams evaluating test environments can also review Faberwork LLC browser testing successes for context on browser testing workflows.
For practical implementation detail, see this guide to JavaScript for A/B testing. Whatever the stack, keep the variant logic understandable, make the experiment easy to disable, and verify the experience before trusting the results.
Reading Significance Without Fooling Yourself
A dashboard can announce statistical significance while the commercial decision remains uncertain. Statistical significance is evidence evaluated under a chosen statistical method and decision threshold. It doesn't mean the variant is certainly better, that the effect is large enough to matter, or that it will hold when the audience or business conditions change.
A confidence interval adds information about uncertainty around an estimate. A narrow interval suggests more precision than a wide one, but neither should be interpreted in isolation. Compare variants using the experiment's statistical method, then consider the estimated effect and the range of plausible outcomes. Don't decide whether two versions differ by looking at whether their individual intervals overlap.
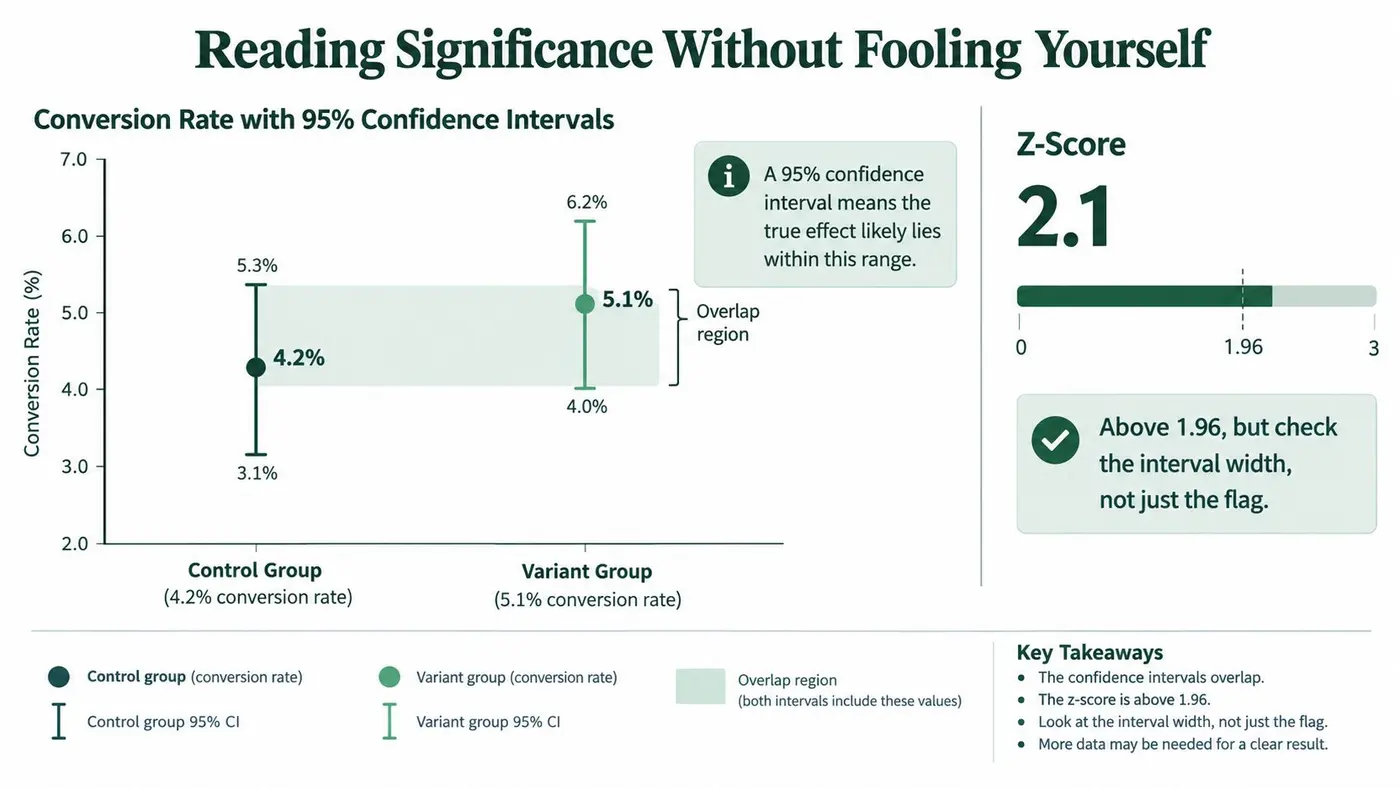
Repeatedly checking results and stopping as soon as they look significant can produce false confidence when the statistical method wasn't designed for that kind of monitoring. The same problem arises when teams inspect many metrics, audience segments, and variations, then report only the most favourable result. Predefine the primary metric, sample plan, and stopping rule. If your platform uses a sequential method, follow its decision procedure rather than mixing it with an incompatible fixed-horizon rule.
Treat mobile and desktop as different contexts
A UK analysis reports ecommerce conversion ranges of 1.8–2.9% on mobile and 3.9–5.06% on desktop (UK mobile and desktop conversion analysis). That difference makes device balance important: if the mix shifts between experiment arms, an overall conversion change may reflect the audience rather than the page treatment.
Plan device checks, but don't rummage through every segment after the fact until one looks like a success. Segment analysis is most useful when the team has a reason to expect a different response and enough data to evaluate it. If the overall test is inconclusive, record that. A result that didn't answer the question can still inform a sharper follow-up hypothesis.
The useful output isn't always a winning variant. It may be evidence that the proposed change didn't produce a detectable effect under the conditions tested, or that the team needs to improve the implementation or measurement before making a decision.
Choosing the Metrics That Match the Business
Conversion rate is a useful starting point, but it can hide trade-offs. A variant might persuade more visitors to place an order while reducing average order value, increasing cancellations, or making the site harder to use. If the test changes a critical page, the team needs to understand the quality and value of the outcomes, not just count them.
Set the primary metric according to the decision you're making. Then add secondary measures and guardrails that reveal whether the apparent gain comes at an unacceptable cost. Teams deciding which measure should guide product choices can use this overview of a north-star metric as a starting point, but an experiment still needs its own predefined decision rule.
| Metric | Role in the test | When to use it |
|---|---|---|
| Purchase conversion | Primary or secondary outcome | When the hypothesis concerns whether more eligible visitors complete an order |
| Revenue per visitor | Commercial outcome | When order value matters alongside the chance of purchasing |
| Average order value | Diagnostic or guardrail | When a change may affect basket composition or promotional behaviour |
| Revenue by variant | Business comparison | When stakeholders need to compare total commercial value, not clicks alone |
| LCP, INP, and CLS | Experience guardrails | When the treatment could affect loading, responsiveness, or layout stability |
| Delivery or fulfilment outcomes | Operational guardrails | When a checkout or delivery change could affect what happens after purchase |
Make the result actionable
Agree what each measure means before the test begins. For instance, decide whether a purchase is counted at order confirmation, how refunds or cancellations will be handled in later analysis, and whether the team can rely on revenue tracking across both variants. If the instrumentation differs between the control and variant, the result may reflect measurement rather than behaviour.
Keep the primary metric tied to the hypothesis, and use the other measures to explain the result or protect the business. Don't promote a secondary metric to “the real winner” after launch because the primary metric missed. That changes the question after seeing the answer.
Revenue is a decision measure, not a decorative dashboard tile. If conversions rise but the commercial or experience guardrails move in the wrong direction, investigate before shipping.
Finally, distinguish a statistically detectable difference from a worthwhile one. The team should ask whether the effect is large and dependable enough to justify implementation, whether performance remains acceptable, and whether the result fits the customer experience it intends to deliver.
Handling Consent and Legal Context in the UK
Testing teams often treat assignment and analytics as one technical step. In practice, changing which presentation a visitor sees is not necessarily the same activity as using a cookie or similar technology to measure that individual. Treating them as identical can lead to an overbroad consent rule, while assuming that all testing or analytics is exempt can be just as careless.
The ICO says that non-essential cookies and similar technologies generally require clear, active consent, with exemptions limited to technologies strictly necessary for a service (ICO guidance on cookies and similar technologies). The team needs to understand what its implementation stores or accesses, what information its measurement collects, and what legal basis applies. The answer depends on the actual setup, so involve the privacy or legal lead rather than relying on a generic testing rule.
Keep eligibility and measurement clear
A consent-aware workflow should make the population and reporting transparent:
- Define eligibility: State which visitors can be assigned to the experiment and whether that depends on consent state.
- Separate assignment from analytics: Don't assume that an experiment identifier and individual measurement have identical privacy implications.
- Disclose exclusions: Report whether conversion rates cover all eligible visitors or only visitors whose analytics consent allows measurement.
- Document the reasoning: Record the technologies used, consent state, purpose, retention, and the legal assessment for the implementation.
- Review the actual behaviour: Ask the privacy lead to check what the website does in practice, including the tools and tags involved.
Consent can also affect representativeness. If only visitors who opt in are included in analytics, the measured group may differ from the full eligible audience. Make that limitation visible in the test report, and avoid presenting an opt-in-only result as if it described every visitor.
The practical next step is to map the experiment's assignment and measurement separately, then review both with the person responsible for privacy compliance. Teams can use the Otter A/B privacy and consent guidance as implementation documentation, while confirming that their own consent setup and legal assessment fit their use case.
Your First 90 Days of Website Experimentation
A testing programme needs a reliable operating rhythm more than a long list of ideas. Start with measurement and workflow, then earn the right to run more ambitious experiments. If the team can't tell which version a visitor saw, whether a purchase event fired, or how revenue was attributed, adding variants will only make the uncertainty harder to diagnose.
Build the foundations before increasing volume
First, audit the journey. Check the pages where customers decide, compare, and pay. Look for friction in mobile layouts, unclear delivery information, weak product details, and tracking gaps. Turn observations into hypotheses that describe a customer problem and a change the team can build.
Then establish a launch checklist. Agree on the metric, sample-size approach, stopping rule, traffic allocation, privacy review, and performance guardrails before each test. QA both variants and their events before production traffic reaches them. If the site becomes slower, the checkout breaks, or assignment is inconsistent, pause the experiment and fix the cause.
Create a review habit. After each test, document the hypothesis, implementation, results, limitations, decision, and next action. An inconclusive result isn't a reason to discard the work. It may show that the effect was too small to detect, the implementation didn't address the problem, or the measurement wasn't good enough to support a decision.
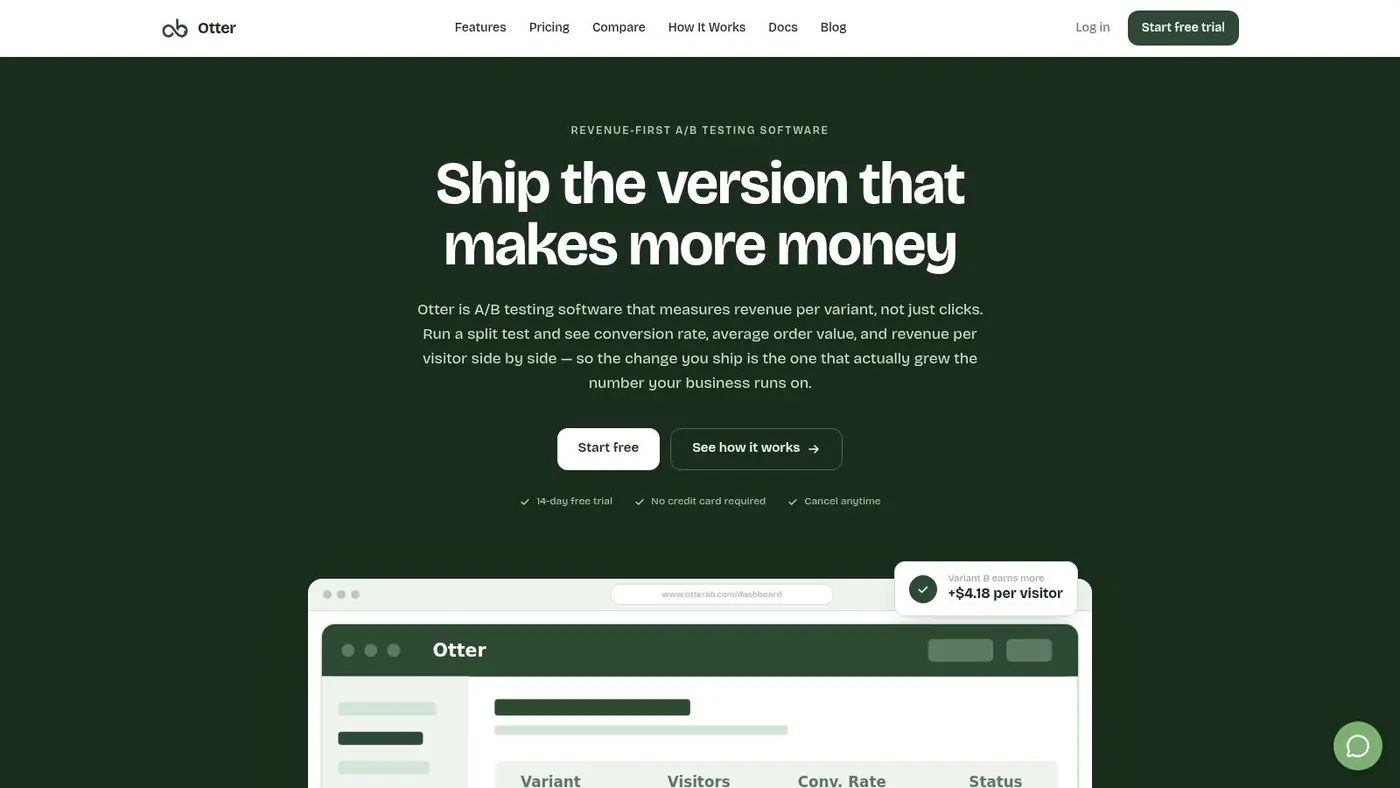
When choosing a platform, assess how it handles assignment, goal tracking, performance, reporting, and the way your team builds its site. Otter A/B supports website experiments through a snippet and integrations that include Shopify, WordPress, Webflow, Wix, WooCommerce, ClickFunnels, Squarespace, Framer, Next.js, and Google Tag Manager. Those options may suit a team that wants a lightweight workflow, but validate implementation and results against your own setup rather than assuming any tool removes the need for QA.
The practical move today is to choose one high-value customer problem and write a test brief before anyone edits the site. If the team can't agree on the hypothesis, primary metric, and guardrails, it isn't ready to launch the experiment.
Otter A/B helps teams create website variants, split traffic, and measure goals including purchases, average order value, and revenue alongside conversion. If you're ready to turn a specific customer problem into a properly measured experiment, visit Otter A/B and review how it fits your site and workflow.
Stop guessing
Ready to start testing?
Set up your first A/B test in under five minutes. No credit card required.
- 14-day free trial
- No credit card required
- Cancel anytime