AB Testing Metrics Explained: Lift, Power and Revenue
Learn the AB testing metrics that matter most: conversion rate, relative lift, p-values, power, MDE and revenue per visitor, with worked UK examples.
Your dashboard says the new checkout button is winning. Conversion is up, someone has already shared a screenshot in Slack, and you're being asked whether to ship it today. Then finance asks a harder question. Did each visitor make you more money, or did you just win more, smaller orders?
You can't answer that from one green percentage. Good A/B testing metrics separate three jobs. One metric decides, a few explain, and others warn you when a supposed win is causing damage somewhere else.
Core Metrics Every A/B Test Needs
Start with one rule. One primary metric decides the outcome, diagnostic metrics explain why it moved, and guardrail metrics catch harm elsewhere. If you decide after the results arrive, you'll always find a flattering number to justify shipping.
Say you send 4,000 unique visitors to each arm. The control gets 160 orders, or 4.0%, and the variant gets 180 orders, or 4.5%. Control revenue is £9,600. Every metric below comes from those same numbers, so you can check the maths yourself. A conversion rate calculator will confirm the basic rates before you interpret them.
The ten metrics on one page
Metric Formula Worked example Role in the test Conversion rate Orders ÷ unique visitors 4.0% control, 4.5% variant Primary or diagnostic Absolute lift Variant rate − control rate 4.5% − 4.0% = 0.5 percentage points Size of the change Relative lift (Variant − control) ÷ control 0.5 ÷ 4.0 = 12.5% Comparing changes across baselines Average order value Revenue ÷ orders £9,600 ÷ 160 = £60 control Diagnostic Revenue per visitor Total revenue ÷ all assigned visitors £9,600 ÷ 4,000 = £2.40 control Primary commercial metric P-value Chance of a result this extreme if there were no real difference Compared with 0.05 Significance decision Confidence interval Plausible range for the true difference Range around the 0.5-point lift Uncertainty check Statistical power Chance of detecting a real effect of a given size 80% planning target Planning Minimum detectable effect Smallest lift the test can reliably find Set before launch Planning False positive rate Chance of declaring a winner with no real difference Set by the threshold, usually 5% Risk controlDon't treat these as ten separate verdicts. Conversion rate tells you whether more people bought. Average order value tells you what buyers spent. Revenue per visitor combines both across everyone assigned, including people who didn't buy, which is why it often makes the better commercial decision metric.
If you're learning how to turn website visitors into customers, that distinction matters early. More buyers don't help if each order becomes much smaller. Bigger orders don't help either if far fewer people complete checkout.
What to write down before launch
- Primary metric: Name the single measure that decides whether you'll ship.
- Significance threshold: Fix the line you'll use before traffic starts.
- Planned sample size: Record how many visitors each arm needs.
- End date: Set it from traffic and sample size, not from an exciting early result.
That short record protects you later. Without it, a stakeholder can promote whichever secondary metric looks best and call the test decisive.
Why Relative Lift Flatters Low Conversion Rates
Think of a savings account. A rate rise from 1% to 1.1% sounds tiny, and on a small balance it is tiny. On a large balance, that same 0.1 percentage point can matter. Conversion needs the same care, because percentage points and relative percentages answer different questions.
A UK benchmark dataset reported a 1.68% average conversion rate in September 2025, equivalent to roughly 17 orders per 1,000 visits, according to the IRP Commerce UK ecommerce market data. Define that rate as completed orders divided by ecommerce visits. Don't use product views, basket creations or pageviews as substitutes, because each changes the denominator and inflates what looks like buying intent.
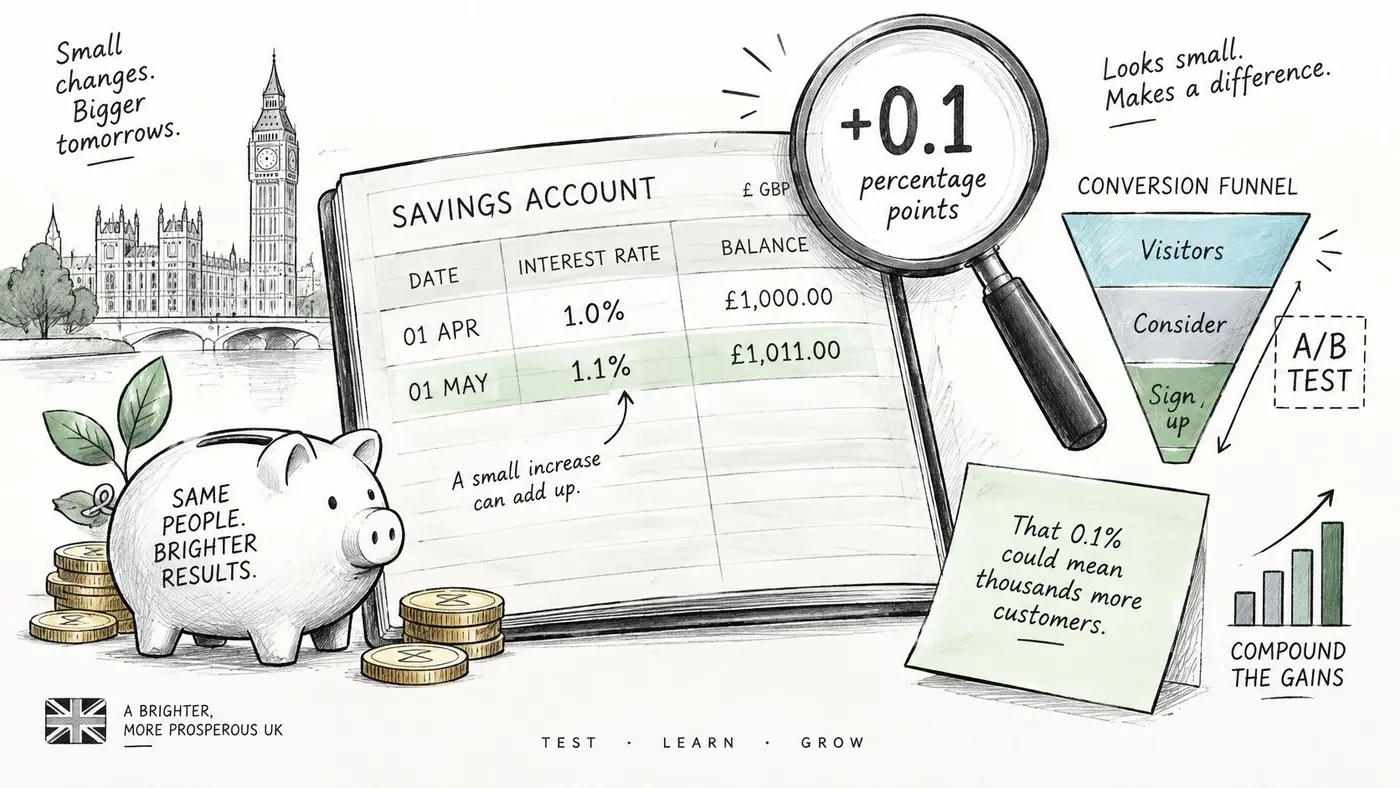
Suppose conversion rises from 1.68% to 1.85%. The relative lift is 10.1%, which sounds substantial in a meeting. The absolute lift is only 0.17 percentage points. Across 10,000 visitors per arm, that's 168 orders against 185 orders, or 17 extra orders. Those orders may be valuable, but they aren't the flood suggested by a double digit headline.
The baseline changes the story
Now start from the earlier 4.0% baseline. A 10% relative lift takes you to 4.4%, an absolute gain of 0.4 percentage points. Across 10,000 visitors, you'd gain roughly 40 orders rather than 17. The relative claim is almost identical, yet the commercial effect is more than twice as large because more visitors were buying to begin with.
Practical rule: Report relative lift for comparison, absolute lift for scale, and visitor counts so readers can see how many extra buyers the change produced.
Low baselines are especially easy to flatter. A move from two orders to three orders is a 50% relative increase, but it's still one order. Random variation can easily create that difference, and a percentage headline hides how fragile the evidence is.
Always use unique eligible visitors as the denominator. If one person generates five pageviews, counting pageviews makes conversion look lower and can bias the result if one variant encourages more browsing. Assign the visitor once, count the completed order once, and keep that definition fixed for both arms.
Report both lifts together, then show the uncertainty around the difference. A point estimate alone can't tell you whether 17 extra orders reflect a real improvement or an ordinary wobble in who happened to visit that week. That uncertainty is where significance testing earns its keep.
Significance, P-Values and Confidence Intervals
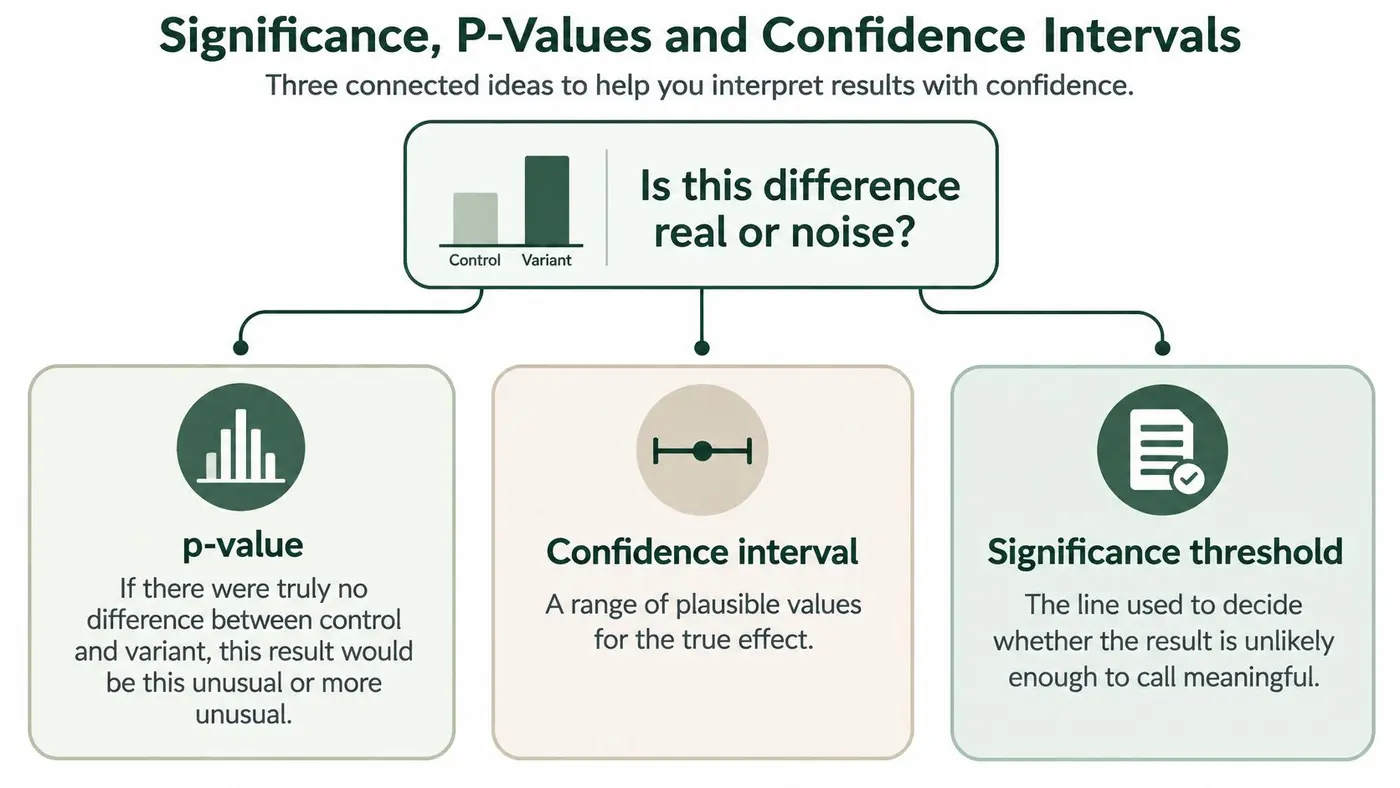
The question you're really asking is simple. Is this difference real or noise? A p-value, a confidence interval and a significance threshold each answer a related part of that question. They don't prove a variant works, and they don't tell you whether the gain is worth having.
A p-value asks you to imagine there's no difference between control and variant. Under that assumption, how unusual would a result at least this extreme be? At the usual 0.05 threshold, it would appear less than 1 time in 20 by chance alone. That doesn't mean there's a 95% chance your variant is better. That common reading reverses the logic and overstates what the test knows.
The UK Office for National Statistics guide to uncertainty explains that confidence intervals use the standard error to define a range likely to contain an unknown population value, and that 95% is the most frequently used confidence level. If you drew 20 random samples and calculated a 95% interval for each, approximately 19 intervals would contain the true population value and 1 would not. It also describes the commonly used 5% significance threshold as a probability of less than 1 in 20 of obtaining the observed result, or a more extreme one, if there were no underlying difference.
Apply it to the worked example
Your control converts at 4.0% and the variant at 4.5%, with 4,000 visitors per arm. The observed lift is 0.5 percentage points. A rough 95% confidence interval for that difference runs from about −0.4 to +1.4 percentage points, and the p-value is around 0.27.
Read that interval carefully. The true effect could plausibly be a small loss, no change, or a gain larger than the one you observed. Because the interval spans zero and the p-value is well above 0.05, you don't have a significant winner yet. The positive headline is only the middle estimate from a wide range.
A confidence interval shows the range of effects your data can support. A p-value only tells you whether zero sits far enough outside that range under your chosen threshold.
One sided or two sided
A two sided test allows the variant to be better or worse. A one sided test looks in one direction only, so it reaches significance more easily for gains but gives up the ability to declare harm in the same way. Choose before launch and don't switch because the early result points the way you hoped.
Fix the primary metric and threshold in advance for the same reason. If you test conversion, revenue, clicks and basket starts, then promote whichever crosses the line, you've given chance several opportunities to produce a false winner.
Use the chain in order. Estimate the effect, inspect its interval, compare the p-value with your pre-set threshold, then decide. None of those steps measures commercial value, implementation cost or harm to other metrics. Statistical significance means the signal is unlikely to be pure noise under your assumptions. It doesn't mean the effect is large enough to matter.
Statistical Power, MDE and Sample Size Before You Launch
Planning feels less exciting than watching results, but it decides whether the results can answer your question. Statistical power is the chance of detecting a real effect of a specified size. Teams commonly plan for 80% power, which means they'd still miss that real effect about one time in five.
The minimum detectable effect, or MDE, is the smallest lift worth finding. Don't choose it because it makes the sample size convenient. Choose the smallest improvement that would justify the design, engineering and maintenance cost of shipping. If a tiny gain wouldn't change your decision, it isn't a useful MDE.
We recommend running the sample size calculator before launching any test to check whether there is enough traffic. Do that while you can still change the design, traffic allocation or expected duration.
How sample size grows
These figures are approximate visitors per variant for a two sided test at 95% confidence and 80% power, rounded to the nearest 100.
Baseline conversion Relative lift Visitors per variant 4.0% 20% (to 4.8%) 10,300 4.0% 10% (to 4.4%) 39,400 4.0% 5% (to 4.2%) 154,000 1.68% 10% (to 1.85%) 94,100Take the second row. A store converting at 4.0% needs about 39,000 visitors per variant to detect a 10% relative lift. If it sends 2,000 visitors a day to each arm, the test needs about 20 days. That's before you allow for uneven traffic, tracking exclusions or the need to cover full weekly cycles.
Halving the lift roughly quadruples the sample. Moving from a 10% target to a 5% target at the same baseline takes you from about 39,400 to 154,000 visitors per arm. Small effects are expensive to prove because random variation doesn't shrink at the same pace as the signal you're chasing.
Low baselines make the problem harder. At 1.68%, even a 10% relative lift is only 0.17 percentage points, so you need about 94,100 visitors per variant. A low traffic store may need a bolder change, a higher intent page, or a longer test. It shouldn't lower the threshold until the dashboard turns green.
Confirm you are ready
- Estimate eligible daily traffic: Count unique visitors who can enter the test, not total sessions.
- Choose the MDE: Use the smallest lift that would change a real business decision.
- Calculate sample size: Enter baseline, MDE, confidence and power before launch.
- Set duration from the calculation: Include complete weeks so weekday and weekend behaviour both appear.
If the required duration is unrealistic, say so before spending traffic. An underpowered test doesn't become informative because everyone is impatient. It usually produces a wide interval, an inconclusive decision and pressure to reinterpret noise as insight.
Revenue per Visitor, Order Value and Guardrails
A variant can produce more orders and less revenue. The control gets 160 orders at a £60 average order value, for £9,600 in revenue. Across 4,000 assigned visitors, that is £2.40 revenue per visitor. The variant gets 180 orders at a £50 average order value: £9,000 total, or £2.25 per visitor.
Conversion rises by 0.5 percentage points, but each visitor brings in 15p less. Multiply that per-visitor difference by your expected traffic to estimate the value at stake over the period you plan to run the change. A conversion lift alone would miss the loss.
Calculate revenue per visitor by dividing realised order revenue by all eligible assigned visitors, including non-buyers. Keep the attribution window consistent so each variant has the same opportunity to collect orders.
Guardrails that stop a false win
- Refund-adjusted revenue: Check whether extra orders remain after returns and cancellations.
- Checkout and basket abandonment: Look for friction that the test may have pushed further down the funnel.
- Page performance: Check whether slower loading could be affecting results.
- Delivery cost and support contacts: Track costs that arise after the purchase.
- Task completion with assistive technology: Check keyboard and screen-reader journeys separately. An average conversion rate can hide problems such as broken focus order, unclear labels or difficult error recovery.
Revenue can be skewed by a few large orders. Compare variants with a method that accounts for unequal variance, such as Welch's t-test, rather than treating revenue like a conversion proportion.
Decision rule: A conversion gain that lowers revenue per visitor is not a win unless you have a documented reason to accept the trade-off.
That reason might be a deliberate strategy, such as prioritising customers with strong repeat value. Set the rationale before interpreting the result, rather than using it afterward to defend a preferred design.
False Positives, False Negatives and Peeking Mistakes
Teams don't set out to fool themselves. They open the dashboard each morning, see significance cross 95% on day three, and stop while the story looks good. That habit is called peeking, and it breaks the risk level you thought you'd chosen.
A false positive means declaring a winner when no real difference exists. Your significance threshold controls that risk if you follow the planned analysis. A false negative means missing a real improvement, and power controls that risk. You can't make both disappear with the same traffic, so planning involves choosing which mistake would cost you more.
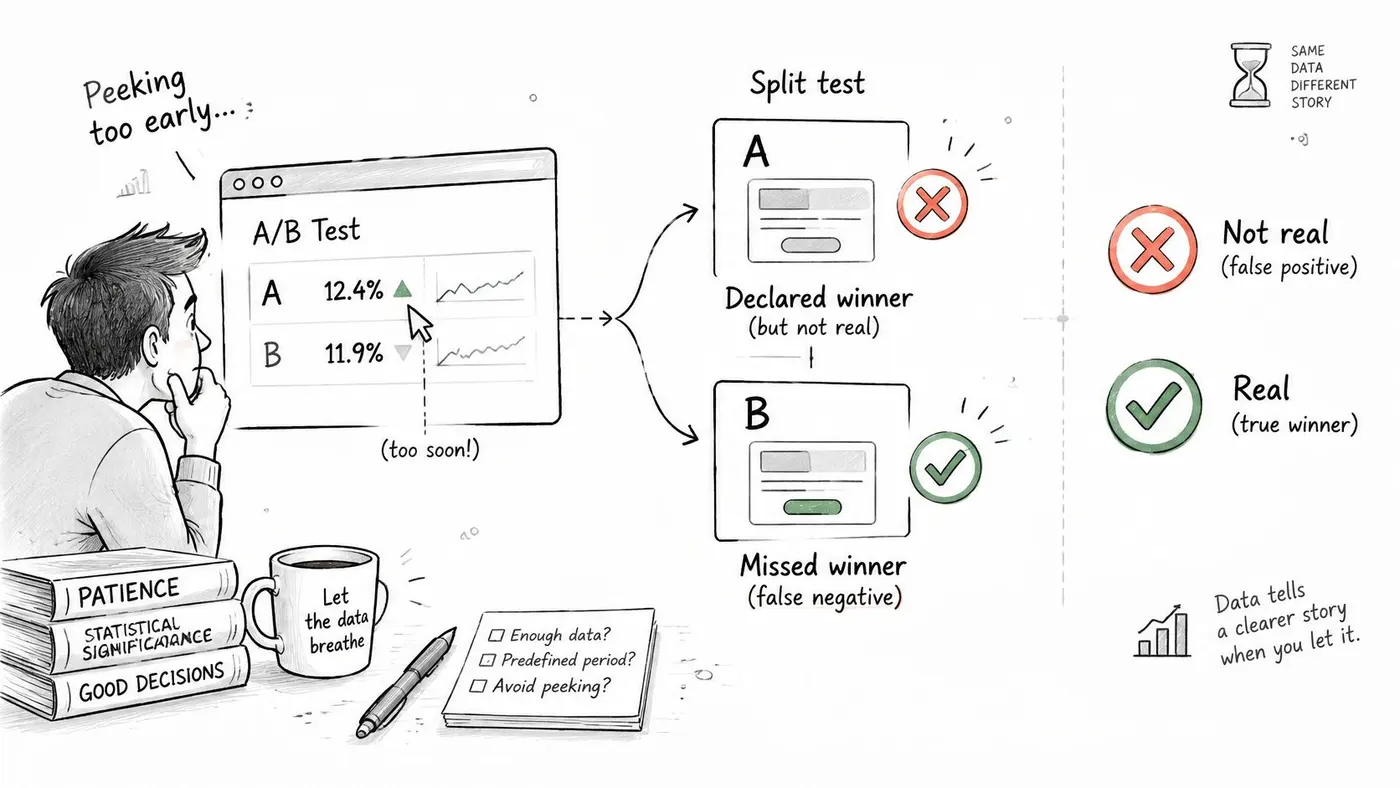
Cumulative conversion rates swing widely early on because each new order changes a small denominator. A variant can look comfortably ahead on day two, then drift back by day fourteen as ordinary weekday traffic replaces launch curiosity. Nothing mysterious has happened. The early estimate was unstable, and repeated checking gave randomness many chances to cross your line.
Multiple variants create a similar problem. Test enough headlines and one may look significant by chance, even when none improves buying. For A/B/n tests, the significance threshold adjusts automatically using a Bonferroni correction in our workflow, making each comparison stricter as comparisons multiply.
Fix the end date in advance, or use a sequential method designed for repeated looks. Don't treat a daily p-value as a final answer just because it suits the release schedule. If an urgent guardrail fails, stop for safety and record that reason separately from the efficacy result.
Confirm the Decision Before You Ship, Keep Testing or Stop
Use the same order at the end of every test. A fixed sequence stops a persuasive headline number from jumping ahead of basic checks on sample size, tracking and commercial value.
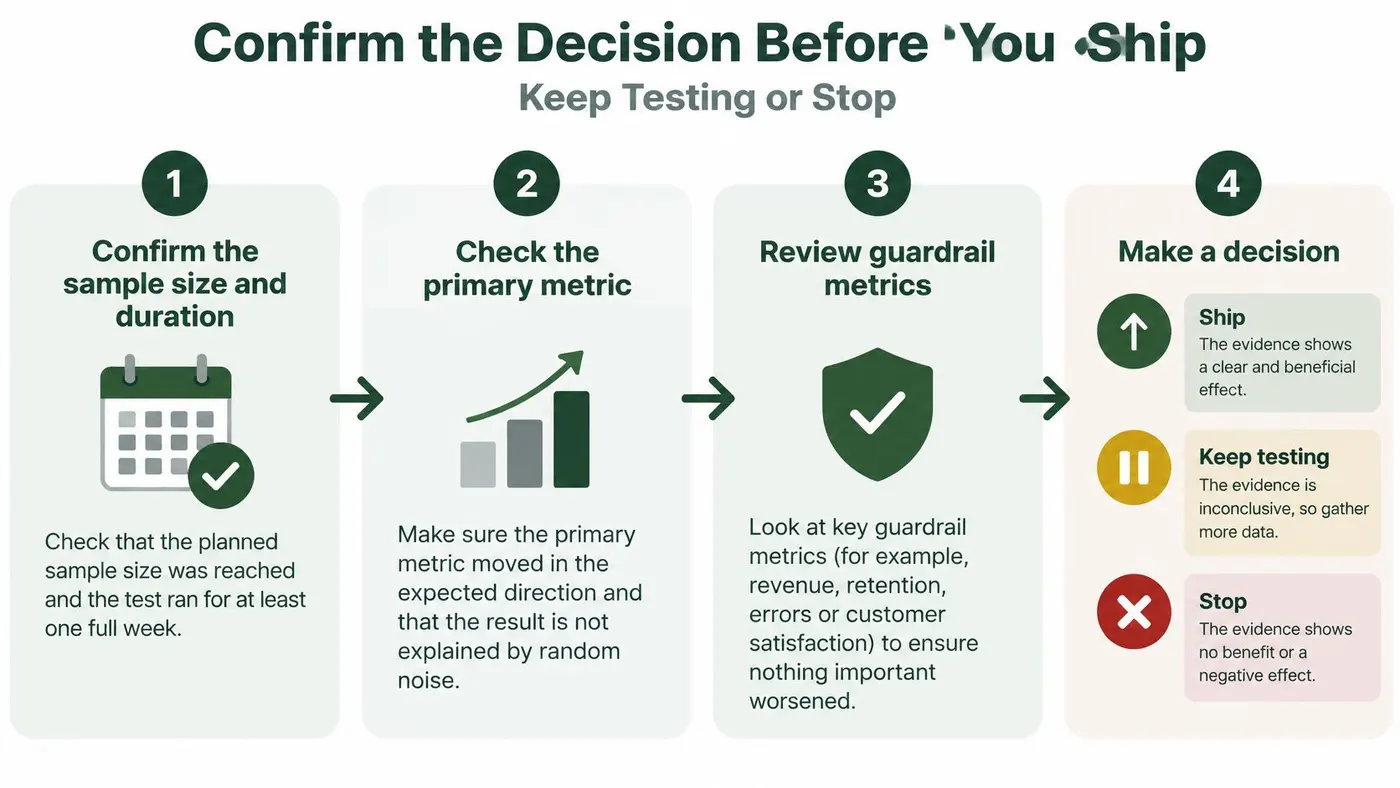
- Confirm duration and sample: Check the planned sample size and at least one full week were reached.
- Match the plan: Verify the primary metric and threshold are the ones written before launch.
- Read effect and uncertainty: Review absolute and relative lift with the confidence interval, such as 0.5 points with a range of roughly −0.4 to +1.4 points.
- Compare commercial metrics: Read revenue per visitor and average order value beside conversion, so a fall from £2.40 to £2.25 isn't missed.
- Review guardrails: Check refunds, checkout abandonment, page speed, support contacts and task completion for shoppers using assistive technology.
- Inspect tracking: Look for uneven traffic splits, missing purchase events or one arm collecting data for longer.
- Decide: Ship when the primary metric is significant and guardrails are clean, keep testing when evidence is underpowered, and stop when a guardrail worsens.
Every results page includes an automatic experiment health checklist that shows whether the numbers are safe to trust and what to fix if they are not. It also has an executive summary card that states in one line whether to ship the change, keep testing, or stop. Use those prompts to support the checks above, not replace your commercial judgement.
Record the lift, interval, guardrail results and reason for the decision in the test log before the next experiment starts. Teams running tests on Otter A/B can keep this log alongside each experiment. A clear record stops the next team from rerunning a dead idea or mistaking an inconclusive test for proof that a change failed.
Ready to judge your next variant by revenue rather than applause for a conversion headline? Visit Otter A/B to measure conversion rate, average order value and revenue per visitor side by side for each variant. Set your primary metric before launch, run the test to its planned sample, and ship the change that pays.
Stop guessing
Ready to start testing?
Set up your first A/B test in under five minutes. No credit card required.
- 14-day free trial
- No credit card required
- Cancel anytime