8 Experiment Report Example Templates for 2026
See 8 annotated experiment report example templates covering metrics, significance, revenue impact and shareable formats, with tactics you can copy today.
Your team finishes a landing page test, sends the client a screenshot of a green number, and moves on to the next campaign. A fortnight later, someone asks whether the test improved purchases or just button clicks. Nobody agreed on the primary metric, and the screenshot doesn't answer the question.
The gap between a completed test and a usable decision is often the report, not the statistics. A result can be calculated correctly yet still leave stakeholders unsure what changed, who was included, whether revenue improved, or what they're supposed to approve.
A useful experiment report example makes those decisions visible. It separates observed results from interpretation, records uncertainty, and gives the next person enough context to challenge or reproduce the analysis. It also tells a busy client what to do without requiring them to become a statistician.
The formats below range from a standard A/B report to a Slack-triggered significance alert. Each has a different job: documenting evidence, explaining revenue, preserving learning, or prompting action. Choose the format around the decision and audience, then copy the fields that make that decision defensible. You don't need a longer report for every test. You need the right information in the right place.
1. Standard A/B Test Experiment Report Template
Use this format when a controlled experiment needs a complete, auditable record. For a Shopify product-page CTA test, that means documenting the copy change, eligible visitors, purchase attribution, and commercial outcome, not just the winning button.
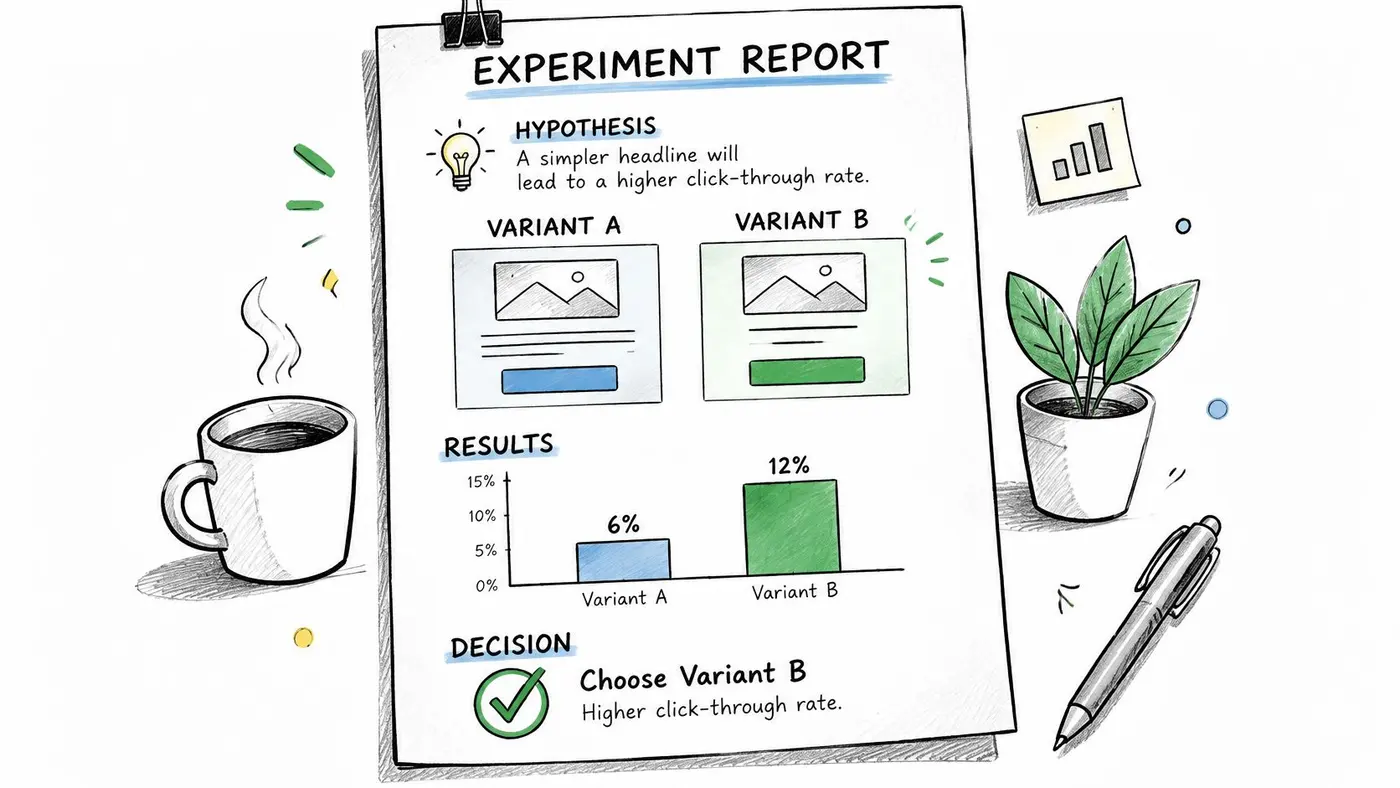
Put a decision summary first, then the methods and results. Follow a consistent test result reporting structure so stakeholders can compare experiments without decoding a new document every time.
- Hypothesis and treatment: Explain the customer problem, expected behaviour change, and exact difference between control and variant.
- Measurement plan: Name the primary metric, guardrails, randomisation unit, planned sample, duration, and stopping rule.
- Results: Include visitors, conversions, absolute rates, absolute and relative lift, uncertainty, and the analysis method.
- Business decision: Record revenue per visitor, average order value, implementation costs, limitations, and the recommendation.
Separate results from interpretation
Say a WooCommerce store tests more explicit delivery wording beside its purchase CTA. Purchase conversion might improve while average order value falls. The report must resolve that trade-off rather than promote whichever metric looks strongest.
Keep the factual results separate from your explanation of why they occurred. The same distinction supports clearer discussion sections for academic papers: interpretation should acknowledge alternative explanations rather than restate the preferred hypothesis.
Share it: Send stakeholders the summary and recommendation, with the full analysis attached or linked. Give the implementation owner a named action and approval condition.
Copy this:
Decision: [Ship, iterate, or discard]. Primary outcome: [Rate and effect interval]. Commercial outcome: [Revenue per visitor and uncertainty]. Conditions: [Guardrails and limitations]. Owner: [Person responsible for the next action].
2. Google's 41 Shades of Blue Experiment Report
Treat this familiar colour-testing premise as a single-variable report template, not as permission to assume that cosmetic changes produce meaningful revenue. Without a primary case report, don't attach a historical uplift or earnings figure to the example.
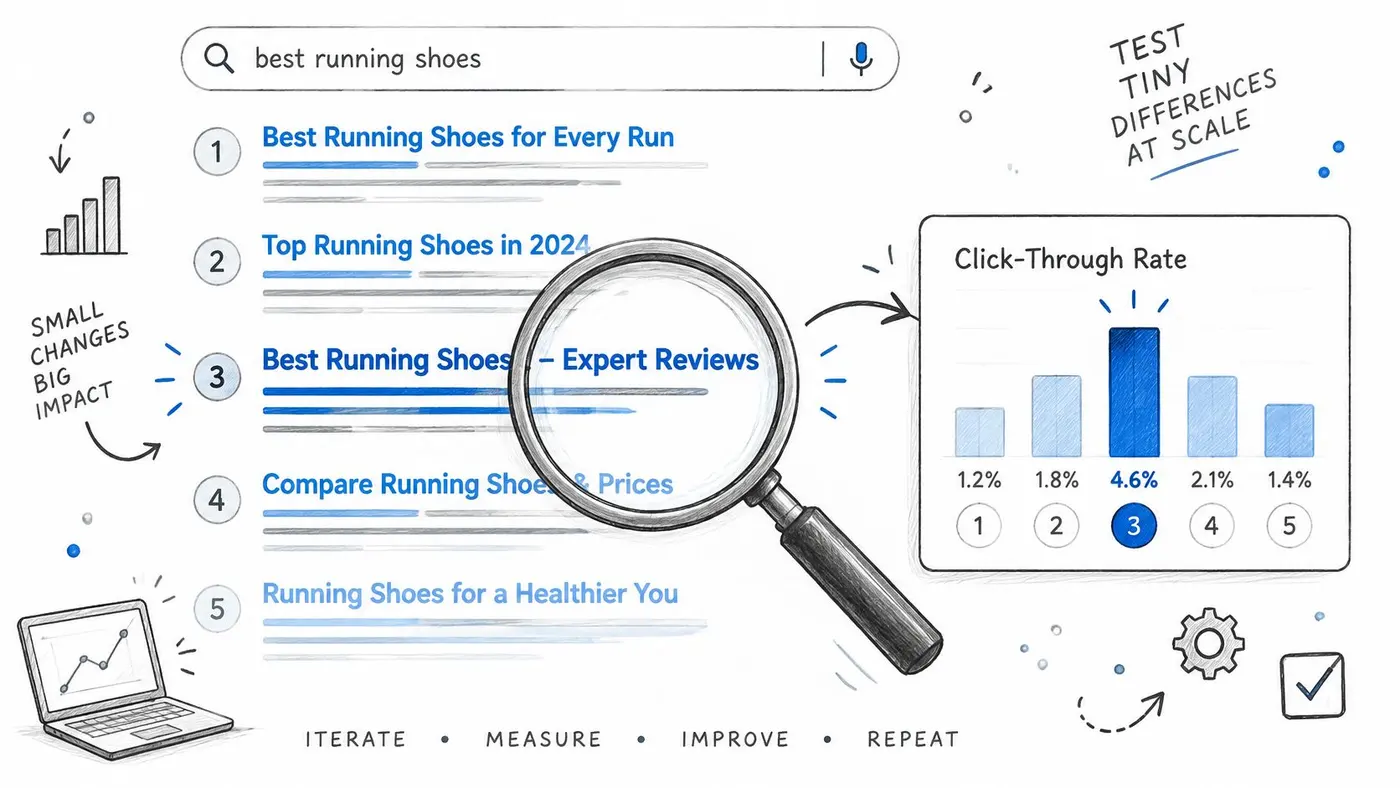
For a Webflow landing page, keep the button wording, position, destination, and surrounding content unchanged while testing colour. Document each treatment precisely enough that a developer can recreate it, including hover and focus states.
A useful reporting model comes from the GOV.UK subtopic-page experiment, where the list design achieved 75.9% click-through, compared with 66.0% for the accordion. Those figures describe that navigation experiment, not a colour test, but they show why reporting the actual rates is more informative than just declaring a winner.
Make the metric choice explicit
Click-through rate answers whether people progressed. It doesn't establish that they bought, completed onboarding, or found the right information. Add downstream completion as a guardrail, and report accessibility checks separately from performance.
A visually stronger treatment isn't automatically a commercially stronger treatment.
Testing many variants also creates an analysis burden. Plan how you'll handle multiple comparisons before launch, and limit treatments to what your traffic can support. A smaller experiment with a clear decision is more useful than an elaborate test with weak evidence.
Share it: Give designers annotated treatment screenshots, and give commercial stakeholders the primary outcome plus downstream effects. Don't let a colour preference become the reporting headline.
Copy this:
Variable changed: [Colour specification]. Held constant: [Copy, placement, destination]. Primary metric: [Click-through]. Guardrail: [Downstream completion]. Comparison method: [Multiplicity handling]. Decision: [Action supported by the evidence].
3. Bing Headline Experiment Report
A headline-formatting report should answer a commercial question: did the change improve value per exposed visitor? Use the Bing headline premise to structure that question without importing an unverified revenue claim into your own presentation.
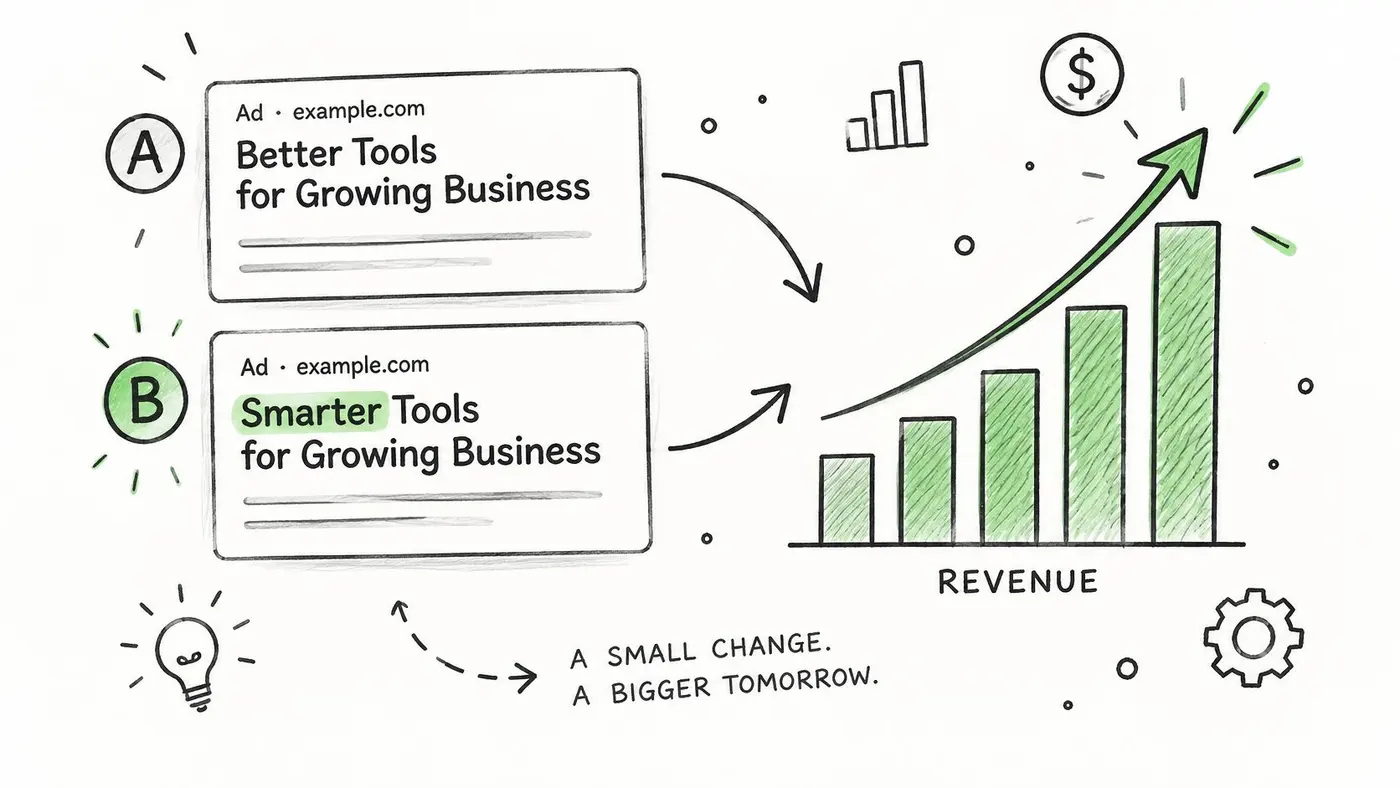
Say a Shopify store changes product-title formatting to make size and material easier to scan. More product clicks would be encouraging, but the commercial report should follow those visitors through purchase, basket value, and revenue. Record why the team prioritised the idea, especially if someone initially dismissed it as too small.
The HMRC webchat experiment illustrates the value of looking beyond an interface action: on a target page, support-ticket submissions fell by 43% and phone-call volume fell by 12%. Those are service outcomes rather than retail revenue, but the reporting principle transfers: measure what happens after the immediate interaction.
Distinguish observed revenue from projected value
- Observed impact: Show revenue per visitor and revenue per variant, with the relevant exposure counts and uncertainty.
- Economic context: Include discounts, returns, margin implications, and implementation effort where available.
- Projection: Label any rollout estimate as a scenario, stating eligible traffic and assumptions rather than presenting it as realised revenue.
Unequal traffic allocation makes total revenue alone a poor comparison. Revenue per visitor helps normalise exposure, but it still needs an appropriate uncertainty analysis.
Share it: Ask finance or the commercial owner to review the projection assumptions. Consider a repeat test or holdout when a surprising result would justify an expensive rollout.
Copy this:
Change: [Headline treatment]. Prior assumption: [Why it seemed promising or unimportant]. Observed value: [Revenue per visitor and interval]. Projected value: [Conditional scenario]. Validation: [Repeat test, holdout, or monitored rollout].
4. Multivariate Test Experiment Report
A multivariate report earns its extra complexity only when the team needs to understand combinations, not merely pick a redesigned page. If you change a headline, image, and CTA together in an ordinary A/B test, you can evaluate the package, but you can't confidently attribute its effect to an individual element.
For a lead-generation landing page, a multivariate design might examine whether benefit-led copy works differently with a product image than with a customer image. The report must show the tested combinations and distinguish main effects from interaction effects.
This introduction provides context for the design choices behind the report.
Report the design before the winner
Explain the design using plain language alongside the technical method. A stakeholder should understand whether every combination was tested and whether the sample supports the proposed conclusions.
- Factors and levels: List the elements changed and the alternatives for each.
- Allocation: Record exposure and outcomes for each combination, including excluded or broken experiences.
- Effects: Present estimated element effects and interactions with uncertainty.
- Commercial safeguards: Include qualified leads, purchases, or revenue rather than relying solely on form starts.
Use the multivariate testing guide to distinguish this approach from testing complete page variants. Plan the sample around the effects you intend to estimate, not around the total traffic count alone.
If traffic is limited, test major changes sequentially. That sacrifices some visibility into interactions, but it can produce a clearer decision sooner.
Share it: Give analysts the full combination-level results and stakeholders a plain-language explanation of the recommended combination.
Copy this:
Factors: [Elements and alternatives]. Design: [Combinations tested]. Primary outcome: [Metric]. Main effects: [Estimates]. Interactions: [Supported findings]. Recommendation: [Combination, uncertainty, and implementation decision].
5. Pre-Registered Experiment Report
Write this report before you launch, then complete it without rewriting the original plan. It's particularly useful when an agency needs client agreement on what will count as success.
Say a SaaS team tests onboarding prompts. The pre-registration should define feature adoption, the eligible population, the measurement window, and an activation guardrail. It should also explain what happens if the planned sample isn't reached or an instrumentation issue interrupts the test.
The BBC's guidance on reporting statistics and data emphasises study design, sample size, representativeness, collection methods, analysis, and uncertainty. A report that merely labels a variant significant leaves those important questions unanswered.
Preserve the plan and disclose departures
Before launch, record the hypothesis, primary metric, minimum worthwhile effect, sample-size assumptions, statistical method, and stopping rule. Agree which segments are confirmatory and which will be exploratory.
After completion, add observed results, guardrail outcomes, data-quality findings, and deviations from the plan. Don't replace an unsuccessful primary metric with an encouraging secondary result.
Practical rule: A threshold crossing is not a substitute for the stopping rule you agreed before launch.
For a fixed-horizon frequentist analysis, inspect the final result at the planned endpoint. If the team needs continuous decisions, use a method designed for repeated looks rather than treating repeated ordinary tests as independent opportunities to stop.
A non-significant result doesn't prove that the treatments are equivalent. Compare the uncertainty interval with the smallest effect that would justify implementation.
Share it: Obtain stakeholder approval before launch, then distribute the completed report with deviations clearly marked. Keep the original version accessible.
Copy this:
Pre-registered decision: [Hypothesis, population, metric, method, sample, stopping rule]. Observed result: [Effect and uncertainty]. Departures: [What changed and why]. Exploratory findings: [Clearly labelled observations]. Decision: [Action justified by the planned analysis].
6. Experiment Learning Log (Knowledge Base Report)
A learning log answers a different question from a standalone report: what should the team test next? It preserves the reasoning behind decisions, including experiments that didn't produce a winner.
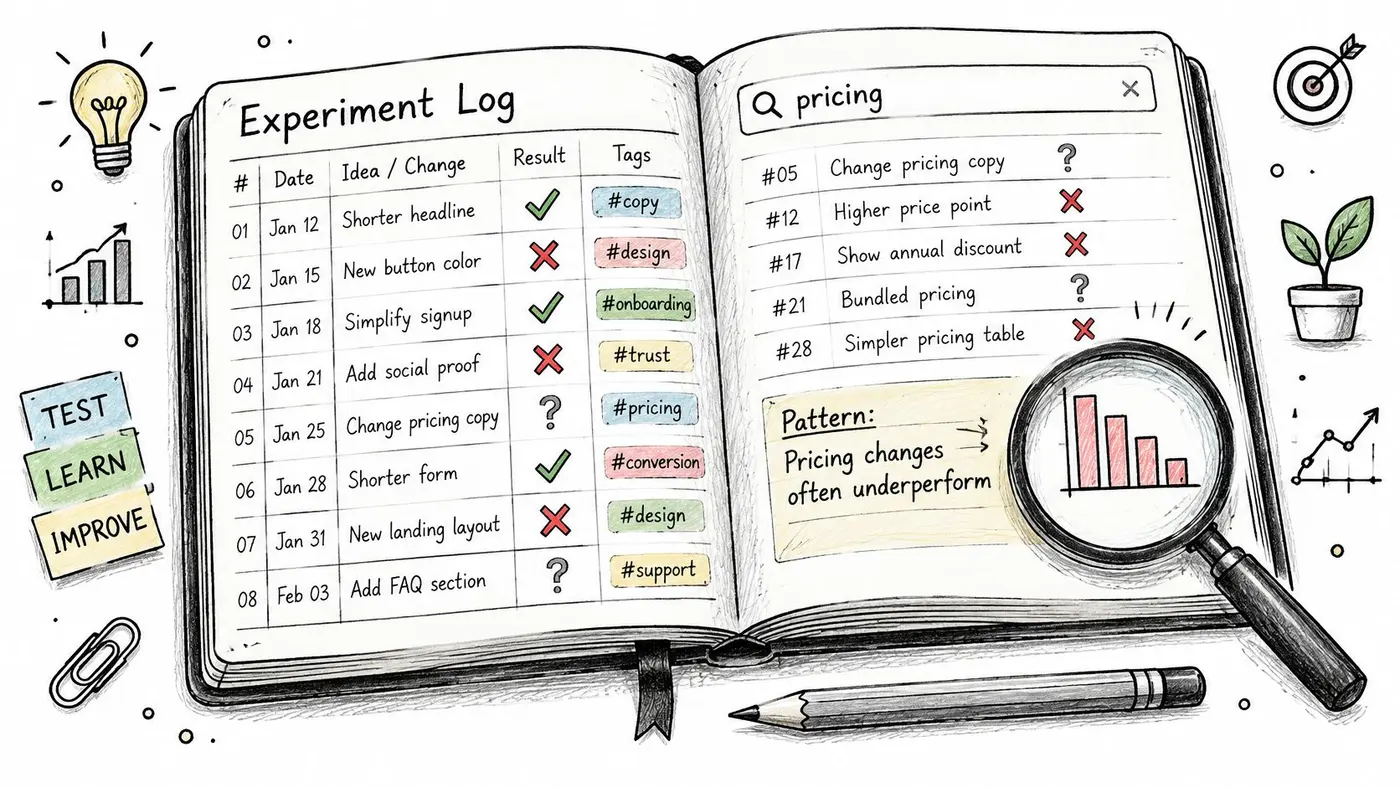
An agency can use a client-specific library to track delivery messaging, price presentation, and CTA wording across Shopify and WooCommerce pages. Tag entries by customer problem, page type, audience, and conversion goal, not just by the colour or copy tested.
Context matters. A winning message on a returning-customer product page isn't automatically a recommendation for a new-visitor homepage.
Store evidence, not slogans
- Test record: Include the hypothesis, treatments, dates, population, primary outcome, and link to the full report.
- Evidence status: Distinguish positive, negative, inconclusive, and invalid results.
- Interpretation: State what the evidence supports and what remains unknown.
- Next hypothesis: Explain how the result changes the next proposed experiment.
Keep inconclusive separate from invalid. An inconclusive test may have sound measurement but insufficient precision; an invalid test may have broken assignment or missing conversions. Combining them makes the knowledge base less useful.
Don't turn a weak finding into a permanent rule such as urgency doesn't work. Record the particular treatment, audience, and uncertainty instead. During roadmap reviews, look for comparable tests and conflicting evidence rather than counting wins.
Share it: Maintain a searchable shared workspace with an owner responsible for tagging and linking completed reports. Use short entries for discovery and the original analysis for scrutiny.
Copy this:
Customer problem: [Problem]. Test context: [Page and audience]. Evidence status: [Positive, negative, inconclusive, or invalid]. Supported learning: [Bounded conclusion]. Unresolved question: [Gap]. Next test: [Hypothesis]. Full report: [Location].
7. Client-Facing Branded Results Report
Your client needs to know what changed commercially, how reliable the evidence is, and what you recommend. Branding helps recognition, but decision clarity matters more than a polished cover.
Open with the recommendation and its conditions. For a checkout-assistance experiment, that might mean recommending a limited rollout while monitoring purchase completion and support demand, rather than claiming success from increased help-widget engagement.
External trading conditions also belong in the interpretation. The Office for National Statistics reported that Great Britain's online sales values were 4.7% higher in August 2025 than in August 2024. That isn't evidence that a particular website treatment worked; it illustrates why overall sales growth and an experiment's estimated treatment effect must remain separate.
Give the client a decision, not a dashboard tour
Organise the report around the questions a budget holder will ask:
- What happened? Show absolute conversion rates, effect size, sample, and uncertainty.
- What is it worth? Separate observed revenue from projected rollout value and implementation costs.
- What could change the decision? Explain guardrail deterioration, data-quality concerns, or uncertainty.
- What happens next? Name the action, owner, approval required, and monitoring plan.
Avoid presenting a confidence level as the probability that the variant is better unless the analysis supports that interpretation. Explain the method in an appendix and keep the main narrative readable.
Share it: Use a read-only report with access appropriate to the client's data. Put sensitive customer-level material elsewhere, and make clear which version contains the final decision.
Copy this:
Recommendation: [Action]. Business outcome: [Observed result]. Reliability: [Sample, method, and uncertainty]. Financial scenario: [Assumptions and costs]. Approval requested: [Specific decision]. Next owner: [Name and responsibility].
8. Real-Time Significance Alert Report
A Slack alert should prompt a review, not automatically authorise a rollout. Its job is to communicate a milestone quickly while preserving the distinction between statistical status and decision readiness.
Say a checkout CTA reaches the configured significance threshold. The alert should identify the experiment, metric, effect, sample status, and stopping-rule status. If a guardrail is deteriorating or tracking is unreliable, include that warning before the suggested action.
Use a real-time reporting workflow to connect the notification to the live analysis. The destination matters: send it to the channel where the experiment owner and decision-maker can act, rather than a general feed nobody owns.
Make the next action conditional
A useful alert contains:
- Identity: Experiment name, variant, primary metric, and report location.
- Evidence: Absolute rates, estimated lift, uncertainty, and analysis method.
- Readiness: Planned sample, duration, stopping-rule status, and guardrail checks.
- Action: Review now, continue collecting, investigate tracking, or prepare a rollout.
Treat an alert as a request to inspect the evidence, not as a command to ship.
Minimum sample and duration checks don't, by themselves, solve repeated-testing problems. The alerting logic must match the statistical method, and the final decision must respect the original analysis plan.
For agencies, connect the alert to broader website performance reporting without replacing the experiment's controlled comparison with a before-and-after dashboard.
Share it: Tag the accountable owner and link the full report. After completion, replace provisional wording with a documented final decision.
Copy this:
Milestone: [Threshold reached]. Outcome: [Rates, effect, uncertainty]. Readiness: [Sample, stopping rule, health, guardrails]. Next action: [Review or continue]. Owner: [Name]. Full report: [Location].
How the eight experiment report formats differ in purpose, metrics and sharing
Item Best for Primary metric focus Shareable format Significance approach Standard A/B Test Experiment Report Template Documenting a single controlled experiment Predefined primary and guardrail metrics Reusable stakeholder report Confidence interval or p-value at a set threshold Google's 41 Shades of Blue Experiment Report Testing small design differences at high traffic Click-through rate Publicly discussed case report Large-sample comparison across variants; correct for multiple comparisons Bing Headline Experiment Report Evaluating simple changes for business impact Revenue per search Publicly discussed case report Large-scale impact analysis Multivariate Test Experiment Report Testing combinations of page elements Main effects and interaction effects Structured analysis report with results tables Account for statistical power across combinations Pre-Registered Experiment Report High-stakes tests and credible, auditable results Fixed primary metric Pre-test plan followed by final report Prespecified analysis method and stopping rule Experiment Learning Log (Knowledge Base Report) Building institutional knowledge across tests Outcomes and lessons across experiments Searchable, tagged archive Records wins, losses, and inconclusive results Client-Facing Branded Results Report Sharing experiment outcomes with clients Revenue and conversion outcomes Branded report with restricted access Statistical confidence indicators Real-Time Significance Alert Report Notifying teams about test milestones Variant lift and confidence Slack or email alert linked to the full report Significance alerts paired with minimum sample requirementsTurning Your Next Test Into a Report Worth Sharing
Choose the format that matches the decision, not the format that looks most impressive. A product manager approving a small interface change needs a different summary from a finance lead evaluating projected revenue or an analyst investigating interactions.
The standard A/B template is a sensible default. Add pre-registration when agreement before launch matters, a learning-log entry when the test closes, and a client-facing summary when someone outside the testing team needs to approve the next action.
Agree on the decision before collecting results
Fix the primary metric, minimum worthwhile effect, guardrails, and stopping rule before launch. Define the eligible population and attribution window, and make sure the implementation can record the outcomes the report promises to explain.
Keep revenue and significance in the same decision process, but don't confuse them. Statistical evidence addresses uncertainty in the estimated effect; commercial judgement addresses whether that effect justifies costs, operational risk, and engineering effort.
- If the result supports rollout: State the scope, implementation owner, and monitoring conditions.
- If the result is inconclusive: Explain which useful effects remain plausible and whether further testing is worthwhile.
- If the test is invalid: Record the measurement failure and repair it before interpreting treatment differences.
Log every outcome, including results that challenge the team's preferred explanation. A searchable record of careful, bounded conclusions is more useful than a gallery of winning screenshots.
Make sharing part of the workflow
Keep the decision summary short and the supporting evidence accessible. Stakeholders should be able to see what you recommend immediately, then inspect the method, uncertainty, and limitations without requesting a separate analysis.
Otter A/B supports this workflow with an executive summary card on every results page that states whether to ship, keep testing, or stop, alongside an experiment health checklist that flags numbers you shouldn't trust and what needs fixing. Password-protected shared reports support stakeholder access, while Slack notifications surface significance milestones for review rather than replacing the final report.
For your next experiment, choose a template before you launch and fill in the planned decision fields first. When the test ends, complete the evidence, record the trade-offs, and assign the next action. That's how an experiment report becomes something a team can use rather than file away.
Otter A/B helps you connect variant results, revenue, and statistical evidence in reports you can share with stakeholders. Visit Otter A/B to start a free account, with no credit card required, and build your first report using the template that fits your next test.
Stop guessing
Ready to start testing?
Set up your first A/B test in under five minutes. No credit card required.
- 14-day free trial
- No credit card required
- Cancel anytime