What Is AB Testing in Marketing? a Practical Guide
Want to know what is AB testing in marketing? Learn how controlled experiments compare two versions and measure conversions and revenue.
A/B testing is a controlled experiment that randomly splits visitors between two versions of a page, email or ad and measures which version achieves a defined goal more often. On a typical UK store, where only a small share of visits become orders, that experiment is a revenue decision, not a scoreboard for clicks.
Did the new button win, or did you just count a noisier week? Plenty of marketers treat a green chart as proof. A chart can move because of payday, a sale, or a flood of cheap traffic. None of those is the change you made.
Online retail represented 27.1% of total UK retail sales in 2024, according to the Office for National Statistics. A large slice of British demand now sits on pages you can edit. The useful question is whether one defined change caused more valuable action, not whether sales rose this month.
That is what A/B testing in marketing is for. You hold the audience as steady as you can, change one thing, and judge the result on money as well as on the action you set out to count.
What A/B Testing Means for Marketers
Picture a baker who hands two loaves out at random and counts which one sells out. The morning's crowd does not pick the winner. Chance does, so the count belongs to the loaf.
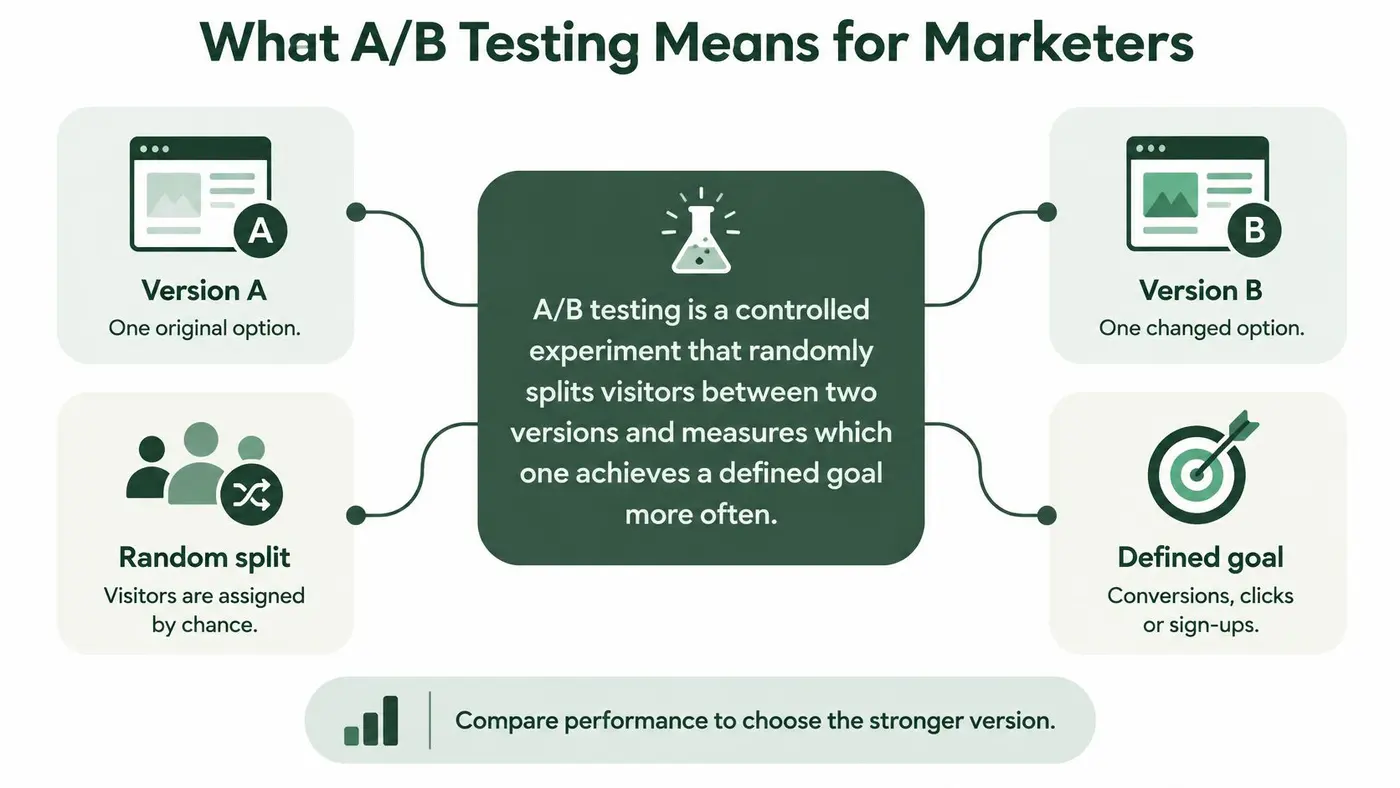
A/B testing works the same way. Each visitor has a known, roughly equal chance of seeing one version, and you compare a goal you named in advance.
Three labels keep the method honest.
- Control (version A): the page, email or ad you already run.
- Variant (version B): the same experience with the single change under test.
- Goal: the outcome you count, such as a purchase, a sign-up or a click.
Marketers commonly test headlines, calls to action, product page layouts, checkout steps, email subject lines and ad copy. Random allocation matters because a keener audience must not land on the new version by accident. A before-and-after read mixes your edit with seasonality, promotions and a shift in where traffic came from.
The test answers one question. Did this change cause more people to act, rather than did sales rise this month?
Multivariate testing alters several elements at once and needs far more traffic before any combination is trustworthy. Split URL testing sends people to wholly separate addresses, which suits a full redesign more than a single line of copy. A standard A/B test keeps one change on the same path.
The same habit helps website optimization for local service businesses, where a clearer service page has to earn the enquiry rather than collect extra taps.
The map below puts the four moving parts in one place.
How a Split Test Runs From Start to Finish
A clean test is a sequence, and each stage exists to stop a particular kind of self-deception. The flow below is the order worth keeping.
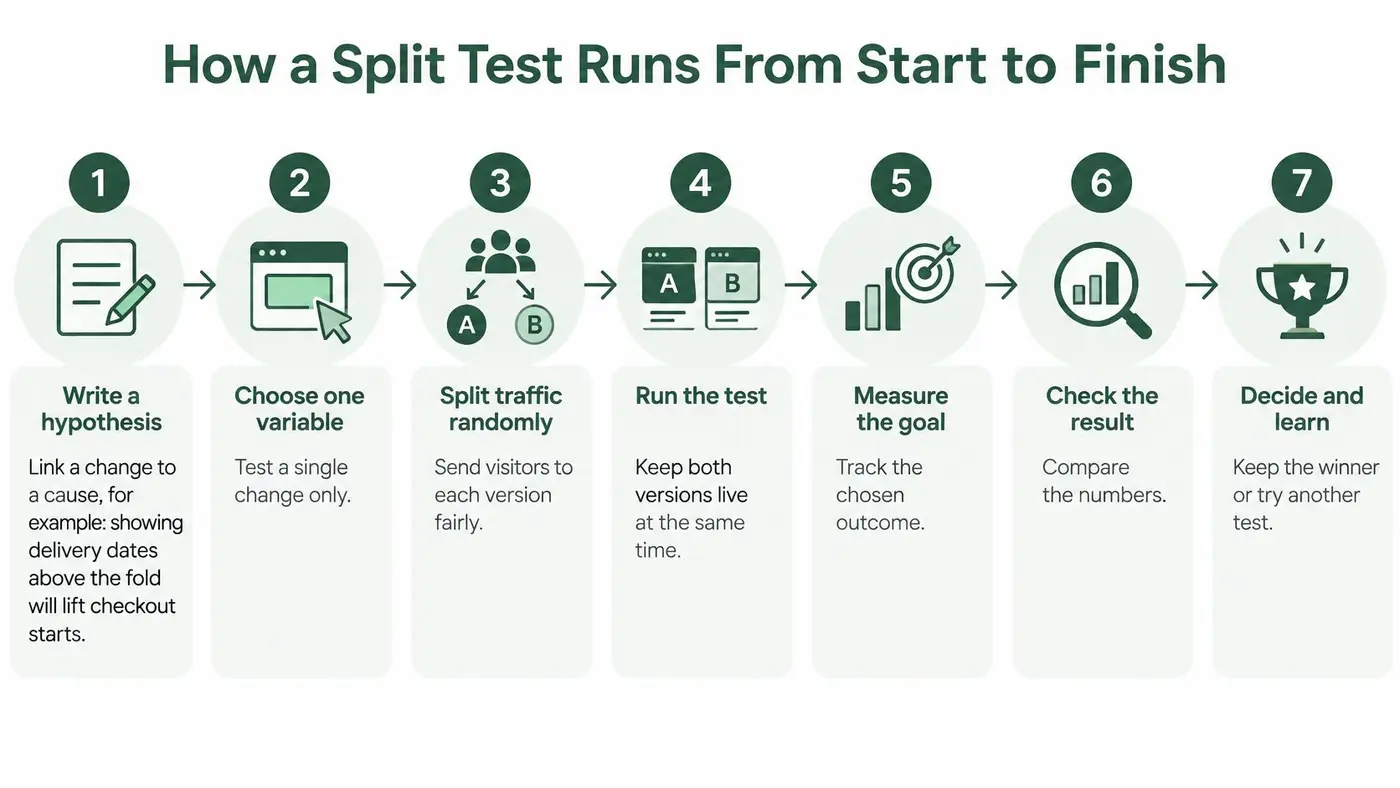
- Write a hypothesis that names a cause. "Showing delivery dates above the fold will lift checkout starts because shoppers worry about timing." If the test fails, you can tell a weak idea from a weak execution.
- Change one element and count one primary goal. Two edits at once leave you guessing which one moved the number, so the next test has nothing solid to build on.
- Fix the sample size and the smallest effect worth detecting before launch. That pair is your stopping rule. A pretty line on day two is not a reason to call the result.
- Split traffic at random, as evenly as you can, and keep each visitor in one version for the whole test. If someone sees both, you no longer know which experience produced the order.
- Run until the planned sample is in and at least one full week has passed. Do not stop because a chart looks promising. Weekday and weekend shoppers are not the same people.
- Read the primary metric first, then the guardrails. Refunds, cancellations, page speed and average order value can spoil a conversion win that looked tidy on its own.
- Decide in writing. Ship the winner, rerun a sharper idea, or record a clear no-change. An inconclusive result still earns its keep when it blocks an expensive rollout that would not have helped.
A hypothesis you can judge afterwards sounds like this. "Moving the delivery promise above the fold will raise checkout starts among mobile visitors, because timing anxiety shows up in support chats, without cutting average order value." Afterwards you know whether starts rose, whether order value held, and whether the cause you named still looks plausible.
If you want the same sequence talked through out loud, this short walkthrough covers hypothesis, split, measurement and the decision.
Metrics That Decide Whether a Variant Wins
Every test needs one primary metric chosen before launch, and that metric should match the business goal rather than the easiest number to move. Eligible visitors are assigned to a control and one or more variants, such as a headline, a call to action or a checkout layout, while that outcome is measured the same way throughout. The IRP Commerce ecommerce dataset is a useful reminder of how small the absolute movement usually is.
Yes-or-no outcomes and money
Purchase conversion is binary, so a two-proportion comparison or a logistic model is the fitting analysis. Revenue per visitor is continuous and typically needs variance-aware analysis. IRP Commerce reported a 1.68% average conversion rate for September 2025, roughly 17 orders per 1,000 visits. At that baseline, a relative 10% uplift reaches about 1.85%, or about 1.7 additional orders per 1,000 visits. A valid test therefore needs a pre-declared primary metric, user-level randomisation where you can get it, mutually exclusive variants, a stable split, and enough observations to detect the smallest uplift you would act on.
Say 6,000 people reach a sample product page and 120 of them order. Conversion is 2.0%. If those orders bring in £8,640, average order value is £72 and revenue per visitor is £1.44. More orders at a thinner basket can leave that £1.44 untouched. That is why revenue sits beside the conversion rate, not underneath it as a footnote. A plain explanation of the rate itself sits in this guide to site conversion rate.
Check the overall result across device, acquisition channel, geography, and new versus returning visitors. Those cuts can show you where a change is fragile. They do not replace the primary analysis you declared.
When each metric earns the decision
Metric What it measures Best for Conversion rate Share of visitors who complete the goal Checkout, sign-up and landing page tests Average order value Mean spend per completed order Upsell, bundle and pricing display tests Revenue per visitor Total revenue divided by all visitors Any test where conversion and order value may move in opposite directions Click-through rate Share of visitors who click a button or link Early-funnel tests such as headlines and banners Lead submission rate Share of visitors who submit a form B2B enquiry forms and lead generation pages Refund or cancellation rate Share of completed orders later reversed Checking that a winning variant does not inflate low-quality ordersGuardrails keep a hollow win off the site. Watch refund rate, cancellation rate, margin and page load time. A variant that adds orders and also adds returns has not created customer value.
Pick the metric that reflects the commercial value of the action. Treat click metrics as diagnostic, not decisive.
Designing a Test and Working Out Sample Size
Sample size has three inputs. You need the baseline conversion rate, the minimum detectable effect (the smallest relative lift worth acting on), and the confidence and power settings, usually 95% and 80%. Power is the chance of detecting a real effect of the size you planned, usually 80%.
Low baselines make small lifts expensive to prove. Klaviyo's UK ecommerce conversion guidance reports that IRP Commerce recorded an overall session conversion rate of 2.03% in June 2026, up from 1.85% in June 2025. The same guidance says that detecting a 10% relative lift on a 3% conversion rate can require about 52,000 users per variant, more than 100,000 total exposures. At rates like these, a variant that adds orders can still cut average order value, margin or revenue per visitor. Stopping early so you can "test faster" is how false winners get shipped.
Visitors you should plan for
The figures below are planning bands for a 10% relative lift at 95% confidence and 80% power. Use them to choose the page and the size of the change, then confirm the count with a calculator on your own baseline. A fuller walk-through of the inputs is in this piece on A/B testing sample size.
Baseline conversion rate Practical note 1.68% (UK ecommerce benchmark, September 2025) Typical UK store; plan for several weeks of traffic 3% Matches the UK-focused guidance case; more than 100,000 total exposures 2% Common for general retail landing pages 5% Higher-intent pages such as checkout Bolder change at 1.68% baseline Far fewer visitors than the 10% lift case; test this first when traffic is limitedRules that keep the split fair
- Keep variants mutually exclusive. One visitor, one experience, for the whole run.
- Use an even split unless you have a deliberate reason to protect the control.
- Do not edit the page mid-test. A copy tweak halfway through creates a third, unplanned variant.
- Cover at least one full weekly cycle so weekday and weekend patterns both appear.
A larger expected lift needs far fewer visitors, so a bold change is cheaper to test than a tiny tweak. Divide the required sample by daily eligible traffic to estimate duration. If the answer is many months, test a bigger change or move the experiment to a higher-traffic page. An inconclusive result on a change you could never have measured is not learning. It is a queue.
Real Marketing Tests and What They Teach
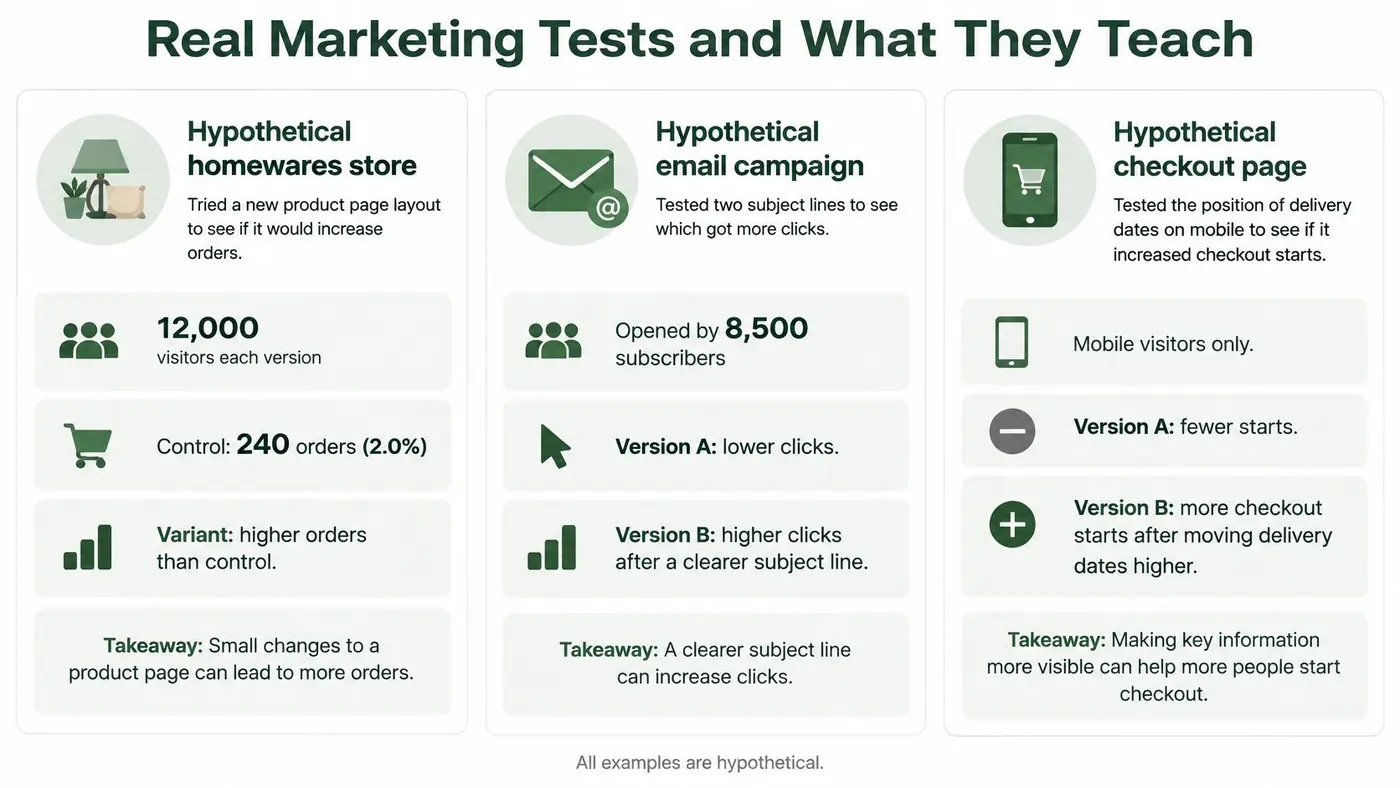
The three stories below are hypothetical. The numbers are there so you can see the decision, not so you can copy the lift.
A homewares headline that earned the rollout
A homewares store tested one headline on the category page. 12,000 visitors saw each version. The control produced 240 orders (2.0%). The variant produced 300 orders (2.5%), a 25% relative lift that cleared a 95% bar in this illustration. Refunds did not rise, so the team shipped the new line.
Version Visitors Orders Conversion Control 12,000 240 2.0% Variant 12,000 300 2.5%The lesson is narrow. A conversion lift is shippable only after the quality of those orders still looks sound.
A button that won clicks and lost the basket
A fashion retailer tested a bold "Buy now" against "Add to basket". Conversions rose. Average order value fell, because shoppers stopped browsing for add-on items. Revenue per visitor was flat, so the team kept the original button.
The lesson is that a higher conversion rate can be commercially empty when the basket shrinks to match.
A shorter form that recruited the wrong people
A software company removed an optional field from its sign-up form. Sign-ups rose. The sales team then found the extra leads were weaker, with fewer of them reaching a qualified conversation. The team added lead quality as a secondary metric and reran the test.
The lesson is that a top-of-funnel goal without a quality guardrail will congratulate you for the wrong win.
The three scenes in the figure are hypothetical too, and they show the same pattern on a headline, an email subject and a checkout detail.
Published programmes, with their own traffic and their own caveats, are collected in these conversion rate optimization case studies. Read them for the decision, not for a lift you can paste onto your store.
Statistical Significance and the Mistakes That Fake Winners
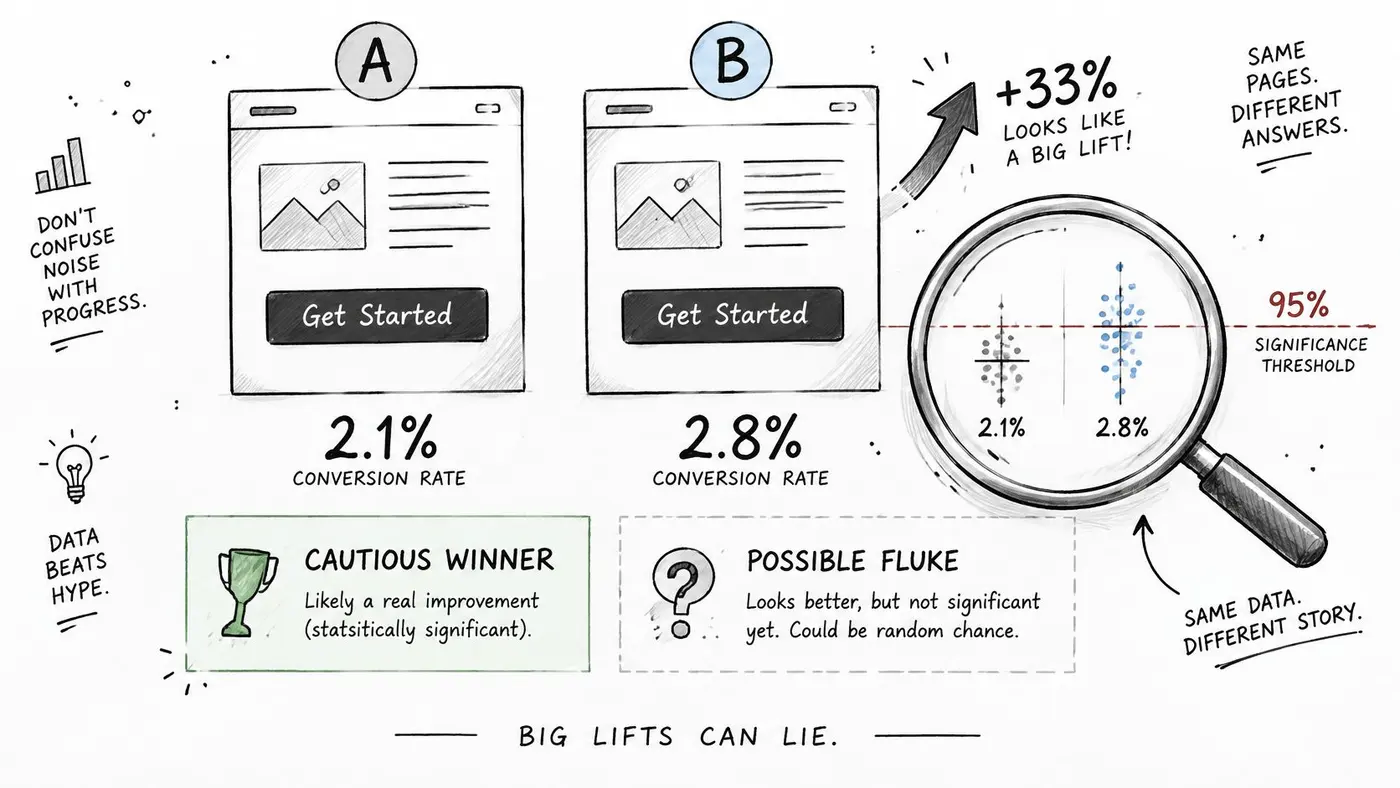
A result is statistically significant when a difference this large would be unlikely if both versions performed the same. A 95% threshold accepts about a 5% chance of calling a false winner on each comparison. Power, usually 80%, is the chance of detecting a real effect of the size you planned to look for. Neither number tells you the result is valuable.
Report a confidence interval, the range of lifts that remain plausible, not only a single headline percentage. A lift that might be 1% or might be 18% is not a brief for a redesign. Testing several variants or several metrics raises the chance that one of them looks lucky. Multi-variant tests need a correction such as Bonferroni, which makes the bar stricter as the number of comparisons grows. For A/B/n tests, that threshold should tighten automatically rather than as an afterthought.
A real difference can still be a bad decision
Significance says nothing about importance. A tiny lift can be genuine and still not worth the design time, the support load or the margin you give away. Judge the interval against the minimum effect you said would pay for itself. If the whole interval sits below that bar, you do not have a commercial win. You have a detectable ripple.
The chart below is the trap in one picture. A conversion rate can look decisive while the uncertainty is still wide enough to include "no difference".
Mistakes that manufacture a winner
Mistake Why it misleads Fix Stopping when the chart first turns green Early swings are noise, so false winners appear Set the sample size and end date before launch Testing several changes at once You cannot tell which change caused the lift Change one defined element per variant Choosing the primary metric after seeing results The winning metric may be cherry-picked Pre-register the primary metric and guardrails Ignoring revenue per visitor Conversions can rise while order value falls Report revenue per visitor beside conversion rate Running for only a few days Weekday and weekend patterns are missed Run at least one full weekly cycle Excluding visitors who refuse cookies Results may not represent all traffic Report eligible, measured and excluded trafficTeams running store tests can use a practical sequence for how to boost Shopify revenue through testing without treating a button-colour win as the whole commercial case.
Who is missing from the sample
UK guidance indicates that some first-party tests comparing aggregate interactions with two website versions may qualify for a statistical-purposes exception, if the sole purpose is improving the service, users get clear information, and they have a simple, free way to object. CookieScript's guide to A/B testing and consent draws the line there. It is narrower than a general exemption. Experiments that involve profiling, advertising or an unrelated marketing purpose may still need consent.
A test measured only among people who accept cookies can misrepresent UK traffic, especially when consent rates differ by device, audience and source. Keep the operational split clear. Assigning a variant so you can compare two versions is not the same job as building a personal analytics profile. In the report, show eligible traffic, measured traffic and exclusions, so a reader can see who never entered the comparison.
If the people who refused consent never appear in the result, you have optimised a subset and called it the site.
Pick one high-traffic page. Write the hypothesis, lock the sample size, and name the primary metric before the test goes live. In Otter A/B you name the test, set the target URL, define the variants, add the DOM changes and set the conversion goals. Every results page then carries an executive summary card that states, in one line, whether to ship the change, keep testing, or stop.
Otter A/B is built for this kind of decision. It measures revenue per visitor and average order value beside conversion rate, so a variant has to pay, not merely get clicked. If you want the next test judged on commercial value rather than a noisy chart, start with Otter A/B.
Stop guessing
Ready to start testing?
Set up your first A/B test in under five minutes. No credit card required.
- 14-day free trial
- No credit card required
- Cancel anytime