A a Testing: What It Proves Before A/B
Learn what A A testing checks, when to run it, how to read a flat or false winner, and the UK sample size you need.
A/A testing runs two identical experiences so any reported winner is a fault in tracking, splitting or statistics, not a real improvement.
The popular advice to keep testing until you find a winner gets this exercise backwards. You're calibrating an instrument, not choosing a better page. A significant result deserves investigation, although it can arise from ordinary statistical chance rather than broken software.
The useful outcome is quieter: trustworthy visitor assignment, working goals and differences small enough to fit your pre-agreed tolerance. A short, flat test isn't automatically a pass, either. You need enough evidence to detect the measurement faults that would matter to your business.
What A A Testing Is For
Put identical weights on opposite sides of a balance. They should balance. If one side consistently tips, you investigate the scales rather than declare that one weight is better.
A/A testing applies that logic to website experiments. You randomly split eligible visitors between identical copies of the same page, with the same offer and the same goal. The expected outcome is no meaningful difference, not perfectly identical totals.
Say a Shopify retailer wants to test its product-page delivery message. Before changing that message, the team creates an unchanged variant and sends visitors through the experiment. Shoppers see the same experience, but their assignments and purchases travel through the measurement system separately.
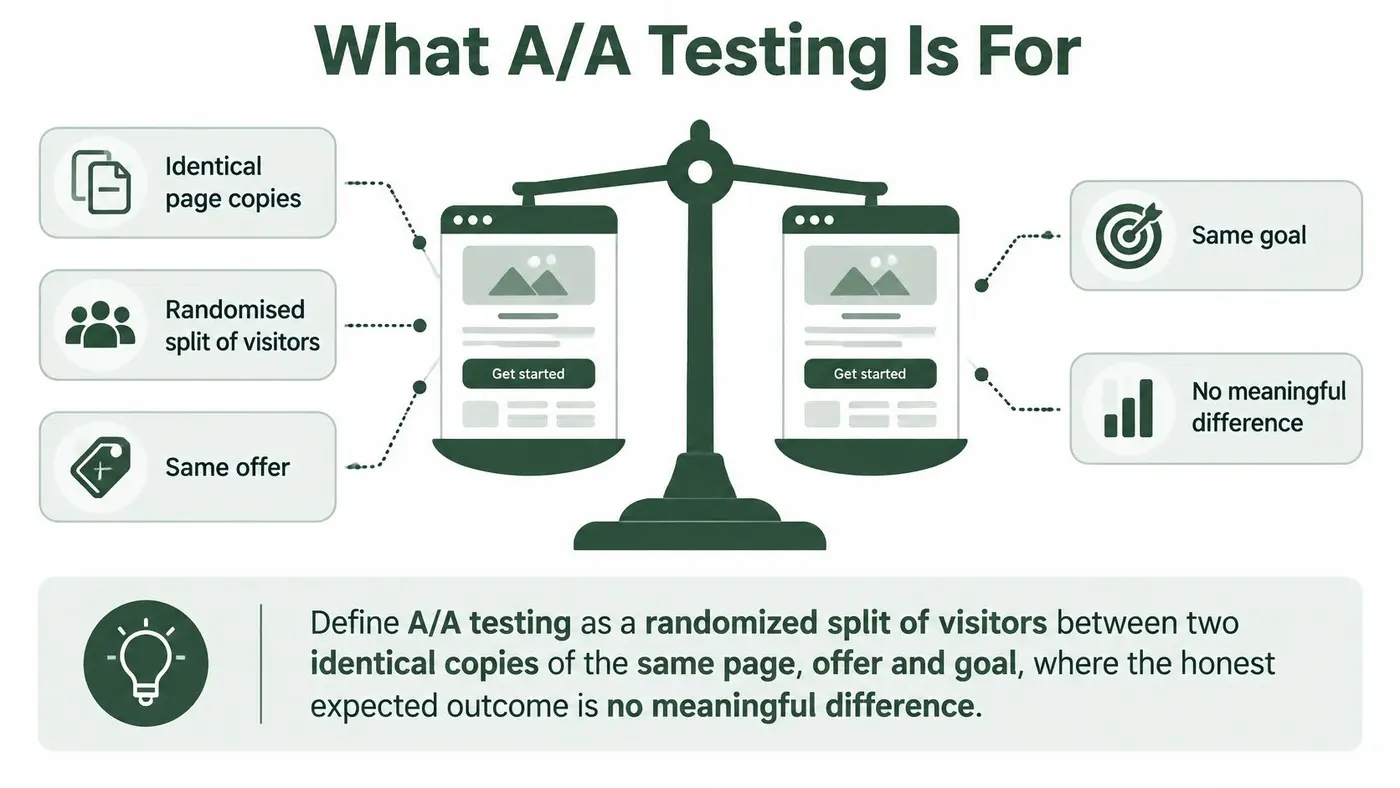
What a clean calibration establishes
The retailer checks distinct parts of the instrument:
- Assignment stays stable. Each eligible person receives an assignment and doesn't switch groups during the journey.
- Allocation follows the plan. The observed traffic split is compatible with the intended split.
- Goals work symmetrically. Conversion and revenue events reach the correct variant on both sides.
- Decisions respect uncertainty. The team doesn't promote an ordinary fluctuation into a commercial winner.
These checks separate calibration from experiments designed to find improvements.
A/A, A/B and A/B/n at a glance
| Test type | What changes | A valid result | Main job |
|---|---|---|---|
| A/A | Nothing; both variants are identical | No significant difference and a split close to the plan | Prove assignment, goals and statistics are trustworthy |
| A/B | One deliberate change against a control | A credible difference larger than the pre-set minimum effect | Choose the better experience |
| A/B/n | Several alternatives against a control | A winner only after a multiple-comparison correction | Pick among several ideas without minting false winners |
An A/A pass doesn't prove the page converts well. A confusing checkout can perform equally badly in both groups. Nor does an unchanged conversion rate prove that purchase values were captured correctly.
Once measurement is trustworthy, practical guidance from ServeApps can help you optimize Shopify cart experiences for conversions. That creative and operational work serves a different purpose: improving the shopping experience rather than validating how you measure it.
A flat A/A result is useful evidence about the instrument, not a verdict on the quality of the page.
When to Run an A A Test
Run an A/A test when a change could affect who enters an experiment, which experience they receive or how their outcomes are recorded. Don't make it a ritual before every headline edit.
A sensible calibration schedule follows changes to the measurement chain. Work through these triggers in order:
- First testing-snippet installation. Confirm that the experiment loads on the intended pages and preserves assignments through navigation.
- A new conversion goal or tag. A button click and a completed purchase need different event checks.
- A purchase or checkout-event change. Payment redirects, confirmation pages and event payloads can change attribution.
- A theme or template update. Revised page structure can break selectors or alter when tracking code runs.
- An ecommerce-platform or checkout-provider migration. Recheck the complete journey, including movement between domains.
- A tag-manager or consent-banner change. New consent rules can alter which visitors and events are observable.
- A long gap since calibration. Investigate whether undocumented releases have changed the original setup.
Inherited setups deserve a fresh check
If your team inherits an experiment implementation it didn't build, treat its status as unverified. A dashboard full of completed tests doesn't establish that the current purchase event fires correctly.
Ask the previous owner for the assignment rules, goal definitions and release history. Then calibrate the journey you intend to test, not an unrelated high-traffic page that happens to be convenient.
Conversely, an unchanged site with a documented clean calibration can move directly into an A/B test, provided its goals still fire. Repeating the same calibration without a relevant change uses traffic without answering a new question.
Keep a calibration record with the completion date, tested templates, goal definitions, consent configuration and relevant release version. Name an owner who can decide whether a subsequent change invalidates that record.
How Much Traffic an A A Test Needs
Detecting a 10% relative lift from a 3% conversion rate, a move to 3.3%, can require approximately 52,000 users per variant, or more than 100,000 total exposures; the UK-focused Grumspot ecommerce testing analysis also reports that 17.4% of 2,408 tests produced a statistically significant winner, while 74.2% were inconclusive or showed no detectable difference.
That commercial dataset isn't a universal benchmark for your shop. It does illustrate why a confidence label can't substitute for enough observations. Small commercial differences can require substantial traffic to distinguish them from chance.
An A/A test has no genuine treatment effect to discover. You therefore shouldn't copy an improvement test's sample requirement without thinking about what you're trying to validate.
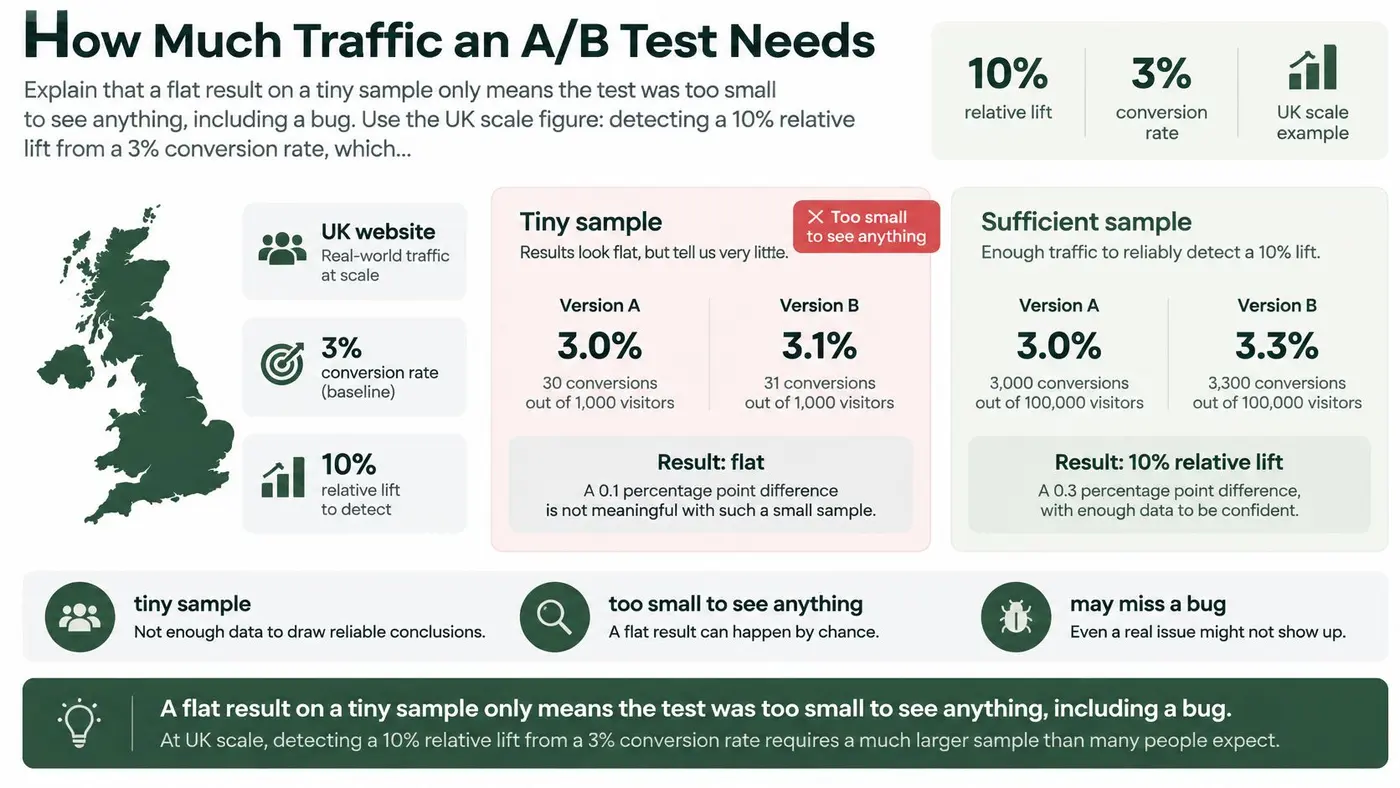
Size the check around a meaningful fault
Ask which measurement discrepancy would make future decisions unsafe. Missing a substantial share of purchases on one side matters differently from a tiny rounding difference in reported revenue.
Use your baseline conversion rate and a practically important discrepancy in the sample-size calculator. Treat the output as a planning aid for the metric and assumptions entered, not a universal certificate for every event in your stack.
The distinction matters:
- An adequately sized flat result supports the conclusion that you haven't detected a meaningful measurement imbalance.
- A tiny flat result may lack the sensitivity to reveal a bug.
- An early significant difference isn't evidence that an identical page is better. Keep the pre-agreed decision rule and investigate implementation errors where appropriate.
Cover weekdays and weekends so the calibration includes the device and acquisition patterns you expect to experiment on. A sample drawn entirely from a concentrated promotional burst may leave ordinary shopping journeys poorly checked.
Decide the stopping rule before launch
Pre-set the required sample and an operational deadline. If you reach the deadline without enough eligible visitors, record the result as inconclusive, rather than treating the deadline as proof of success.
Don't keep extending or shortening the run according to whether the chart looks reassuring. You can monitor event delivery and customer safety without making an early statistical pass decision.
Practical rule: If your site can't reach the agreed exposure within a few weeks, use a smaller diagnostic check to repair measurement, but don't call that check proof that the whole testing system is sound.
Low traffic changes what you can conclude. It doesn't remove the need to verify purchase events, stable assignments and correct denominators.
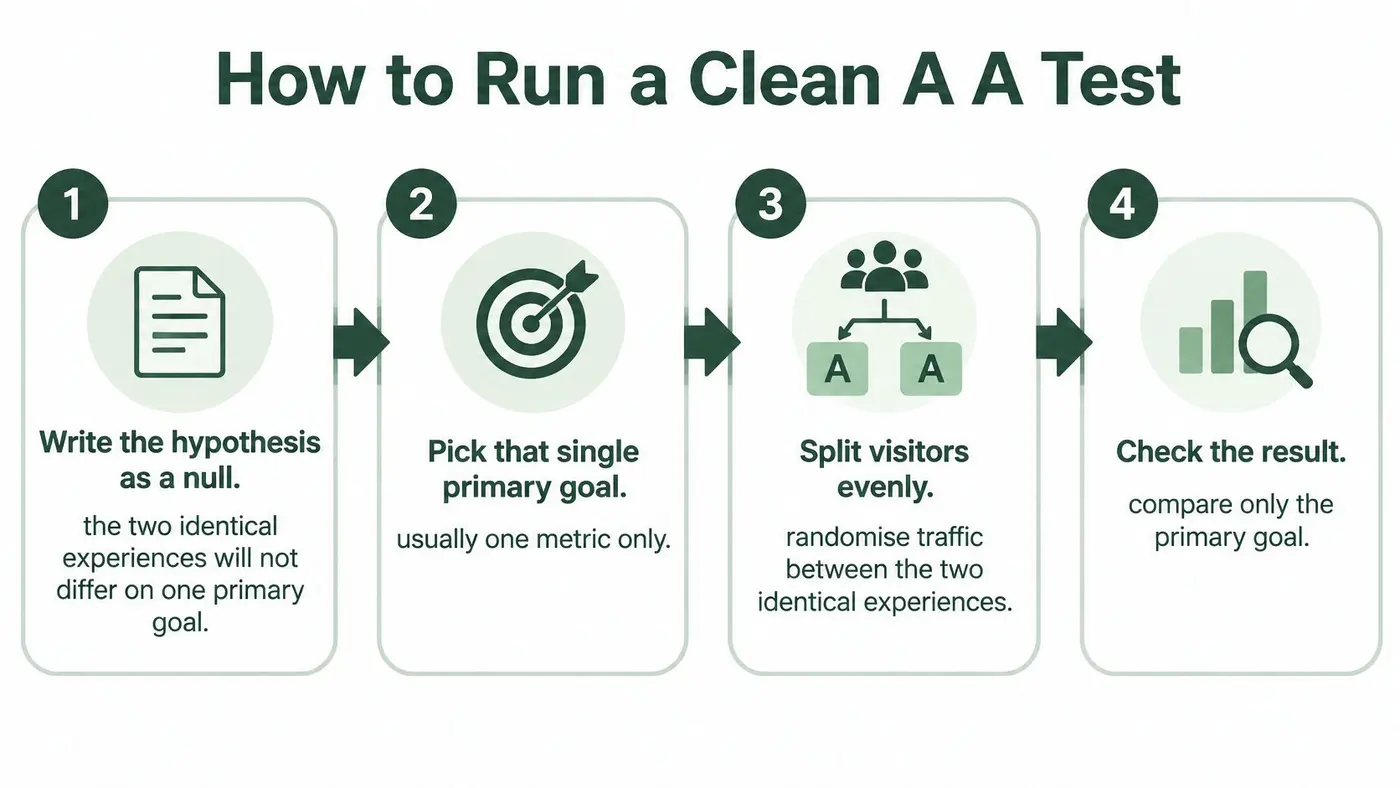
How to Run a Clean A A Test
Build the calibration around a written decision rule, not the dashboard's most exciting number. The UK government's experimental guidance describes the underlying method: randomly allocate web traffic to alternative versions and evaluate outcomes against a defined conversion goal.
For calibration, those versions deliberately remain identical. Follow the sequence below so the setup, exposure and analysis answer the same question.
Set up the instrument
-
Write the null hypothesis. State that the identical experiences won't differ on the primary goal; this prevents the team from inventing a success criterion after seeing results.
-
Choose the primary goal. Use purchase rate or revenue per visitor, with error rate or bounce behaviour as guardrails; secondary metrics should reveal harm, not provide extra chances to announce success.
-
Create identical variants and pre-set allocation. Keep content, URL rules, offer and goal definitions unchanged, use an even split unless there's a documented reason otherwise, and enter the planned sample before launch.
-
Acknowledge intentional identity. Confirm that the unchanged variant is deliberate, not an editing failure; in our process, an A/A identity acknowledgement requires explicit customer intent, and selector, mutation and goal failures cannot be bypassed.
Preserve exposure and inspect the outcome
-
Assign eligible visitors consistently. Allocate them during the same period and keep eligibility rules stable; returning shoppers mustn't receive a fresh group because they browse or revisit.
-
Run to the planned endpoint. Don't turn interim significance into a shipping decision; operational monitoring should catch broken events or customer harm without rewriting the analysis plan.
-
Review allocation, the primary metric and revenue together. Confirm that a reassuring conversion result isn't hiding an assignment fault or incorrect purchase values.
Use browser developer tools to inspect event payloads during setup. Follow a test journey from landing page through checkout confirmation, checking the experiment identifier, assigned variant, transaction identifier, value and currency wherever those fields are required.
Concurrent allocation is essential. Comparing an unchanged page before and after installation also compares different demand, campaigns and customer mixes. Simultaneous random assignment gives both groups exposure to the same trading conditions.
Keep more ambitious experiment design separate from this calibration. ELECTE's guide to testing multiple factors simultaneously provides context for later work involving several deliberate changes, whereas an A/A run needs the opposite discipline: preserve identity and verify measurement.
Read A A Results and Real Cases
A healthy result has conversion and revenue per visitor inside the pre-agreed practical tolerance, allocation compatible with the plan and no winner declared under the configured statistical rule after the required sample arrives. The uncertainty must also be narrow enough to make the check informative.
No significant difference isn't proof of equality. A broad interval that includes a commercially serious discrepancy is inconclusive, even when the dashboard looks flat.
Use the observed pattern to choose an investigation, not to invent a story about why identical copy persuaded shoppers differently.
What an A/A result is telling you
| What you see | Likely cause | What to do |
|---|---|---|
| No significant difference and a split close to plan | Healthy assignment and tracking, provided the sample is adequate | Move on to a real A/B test |
| One identical variant wins at the configured threshold | False positive, peeking or a tracking bug | Don't ship; audit the implementation |
| Split far from the planned allocation | Bots, redirects or reset cookies | Stop and fix bucketing |
| Conversions near zero on both sides | Goal may not be firing | Fix or verify the goal before any A/B test |
| Revenue differs while conversion matches | Double-counted or missing purchases, or natural order-value variation | Audit the purchase event |
A pass and an early false winner
Consider these hypothetical worked cases, not retailer results.
In a clean product-page calibration, both variants receive the intended share of visitors. Purchase rates differ slightly, revenue per visitor is comparable and the completed sample excludes a discrepancy large enough to invalidate future decisions. Event inspection also confirms that completed orders map to the right assignment.
The team records a pass for that page family and purchase goal. It can begin a deliberate delivery-message experiment, but it hasn't established that every other template or event works.
In a different scenario, an identical hero appears significant early in the run. By the planned endpoint, the difference has disappeared. The correct action is to reject the early winner, not to claim that the hero briefly performed better.
A chance fluctuation isn't necessarily evidence of a software defect. The fault would be treating it as an improvement and shipping it, or changing the stopping rule to preserve the flattering result.
Assignment and money faults
Suppose identical checkout copies receive visibly unequal traffic despite an intended even split. Before interpreting purchase rates, inspect where assignment happens and whether redirects, consent handling or cookie resets affect one route differently.
An unexpected allocation can also result from a reporting filter rather than the assignment code itself. Compare eligible visitors, assigned visitors and analysed visitors to locate where the counts diverge. Don't repair the chart by deleting inconvenient users after seeing their outcomes.
In another hypothetical case, conversion rates match but recorded revenue is substantially higher on one side. Inspect transaction identifiers and payloads before assuming a tracking bug: unusually large legitimate orders can also create revenue variation.
Check whether confirmation-page reloads duplicate events, whether payment-provider returns omit purchases and whether currency or value fields differ. Reconcile event records with completed orders, then repeat the calibration after correcting an identified fault.
Never choose between delivery promises or button copy using a revenue metric you haven't verified.
Record the scope of the pass
Write down what passed, what remained uncertain and which implementation was tested. A clean result applies to that configuration, not to every future release.
A theme change, a new tag or a replacement goal can invalidate the calibration. Repeat the relevant check when the measurement path changes rather than carrying an old pass forward indefinitely.
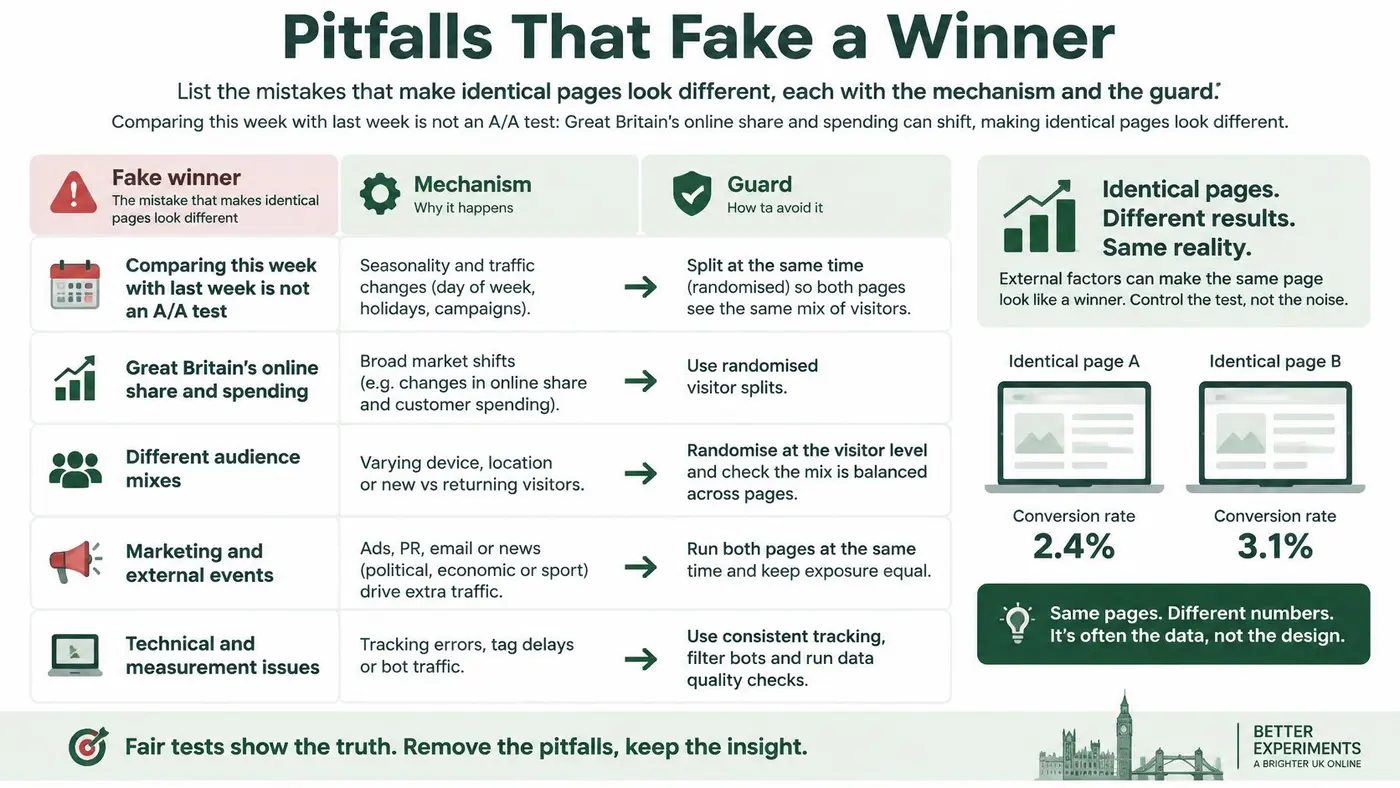
Pitfalls That Fake a Winner
Peeking creates a self-inflicted false winner when a team repeatedly checks a fixed-horizon test and stops at the first favourable result. The guard is a pre-specified stopping rule, not a promise to exercise judgement when the chart looks convincing.
Repeated monitoring needs a statistical method designed for it if those observations will drive decisions. A continuously updated dashboard doesn't, by itself, make continuous stopping valid; understand the false-positive rate before interpreting interim results.
Timing isn't randomisation
Comparing this week with last week isn't an A/A test. The Office for National Statistics April retail bulletin reported Great Britain's online-sales share at 26.8% in April 2025, after 27.1% in March, while online spending value remained 6.1% above April 2024.
Those measures describe different things, but together they show why aggregate trading totals can't isolate a website effect. Split visitors concurrently rather than treating changes in demand as evidence about the experiment.
Protect identity and the denominator
Several implementation shortcuts can produce misleading comparisons:
- Resetting assignments. Clearing cookies or reassigning returning shoppers mixes exposures. Preserve the intended visitor identity throughout the journey.
- Filtering asymmetrically. Removing bots from only one group changes its population. Apply eligibility and exclusion rules consistently.
- Allowing hidden personalisation. Another tool may rewrite one experience after assignment. Check rendered content and competing scripts.
- Shopping across goals. Selecting whichever metric moved creates extra opportunities for a false claim. Name the primary outcome before launch.
- Dropping non-buyers. Revenue among purchasers isn't revenue per visitor. Retain the full randomised population, including visitors who buy nothing.
- Overgeneralising a narrow run. A mobile-only or sale-only calibration doesn't validate desktop journeys or ordinary trading conditions. State the tested scope.
A click-rate pass also leaves purchase-value tracking unverified. Report conversion and revenue per visitor together so a superficially healthy funnel doesn't conceal missing commercial outcomes.
Finally, a calibrated instrument can't rescue a weak experiment idea. The next A/B test still needs a useful hypothesis, adequate sample and defensible stopping rule.
Decide If the Stack Is Ready to Test
Go when allocation matches the plan, the primary outcome and revenue measurement satisfy the agreed tolerance, and the run reaches its planned sample without an opportunistic stop. The result should support a practical decision, not merely fail to produce a significant difference.
No-go means an unexplained allocation mismatch, a dead goal, incorrect revenue attribution or an apparent winner on identical pages. Resolve the fault and repeat the calibration; don't use a broken run as the baseline for creative work.
Make the decision operational
Record the outcome in language stakeholders can act on:
- Proceed. Calibration passed for the named pages and goal; begin the planned A/B experiment.
- Keep testing. The run hasn't reached the required evidence, so no pass decision is available.
- Stop. An implementation fault prevents valid interpretation and needs repair.
At Otter A/B, every results page includes an executive summary card stating whether to ship the change, keep testing or stop. For an A/A run, nobody should interpret a ship recommendation as evidence that unchanged content improved performance.
If the implementation uses tags, the Google Tag Manager testing guide can help with the relevant setup checks. For the next experiment, use the sample-size check as the pre-launch gate, keep the commercial goal stable and introduce a deliberate change.
Figr's A/B testing best practices offer useful context for turning that change into a testable hypothesis. Our setup process is quick enough that many teams have their first split test running inside five minutes, but launch speed isn't calibration evidence.
The pass certifies this instrument, on this site, for this goal. Preserve that scope when you report it.
Otter A/B offers free calculators, generators and planning guides with no account required, alongside website experiments that track purchases and revenue by variant. Visit Otter A/B to plan your calibration, verify your measurement and move to a real A/B test only when the evidence supports it.
Stop guessing
Ready to start testing?
Set up your first A/B test in under five minutes. No credit card required.
- 14-day free trial
- No credit card required
- Cancel anytime