Conversion Optimisation for Ecommerce: How to Lift Revenue
Conversion optimisation for ecommerce explained: a practical testing cycle, product page and checkout fixes, and the metrics that protect revenue.
Half of British shoppers abandon a basket when the delivery option they want isn't on offer. That finding comes from DHL's 2024 UK ecommerce country report, which surveyed 12,000 shoppers across 24 countries, and it reframes the whole discipline: the biggest conversion lever on most UK stores isn't the colour of a button, it's whether a shopper can see a delivery promise they trust before they commit.
The same report found 51% of British shoppers mainly buy from retailers offering free delivery and 42% buy from retailers based in other countries. So the person comparing your store with a competitor overseas is weighing clarity and reassurance as much as price.
That's the frame for this guide. Conversion optimisation for ecommerce works best as a revenue discipline: delivery choice, checkout trust and page speed are the levers that move money, and every test gets judged on revenue per visitor rather than conversion rate alone. Most tests fail, and plenty of the ones that "win" win only for one segment of shoppers. The method below is how you find the ones that don't.
How Conversion Optimisation Works as a Repeating Cycle
A conversion programme isn't a redesign with a launch date. It's a loop one person owns and runs every week, and it only compounds when each turn ends with a written lesson rather than a new homepage. Here's the sequence I'd set up on a store of any size, in this order.
- Baseline every funnel stage across two full weeks. Weekday and weekend traffic behave differently, so a four-day window running Tuesday to Friday will mislead you about mobile intent.
- Find the largest leak in money, not in percentage. A small fall at checkout usually costs more than a large fall on a low-value category page, because the shopper at checkout already has a basket and a card out.
- Tie one change to one shopper behaviour. "Shoppers hesitate because delivery cost appears late, so showing the delivery total on the product page should reduce cart abandonment" is testable. "Improve the product page" is not.
- Score the backlog on expected impact, confidence and effort, so the queue is ordered by money rather than by whoever argued hardest in the meeting.
- Run one controlled test with the sample size and primary goal fixed before launch, and nothing else changed on that template the same week.
- Ship the winner and write down what it taught you. The note matters more than the lift, because it becomes the evidence behind the next hypothesis.
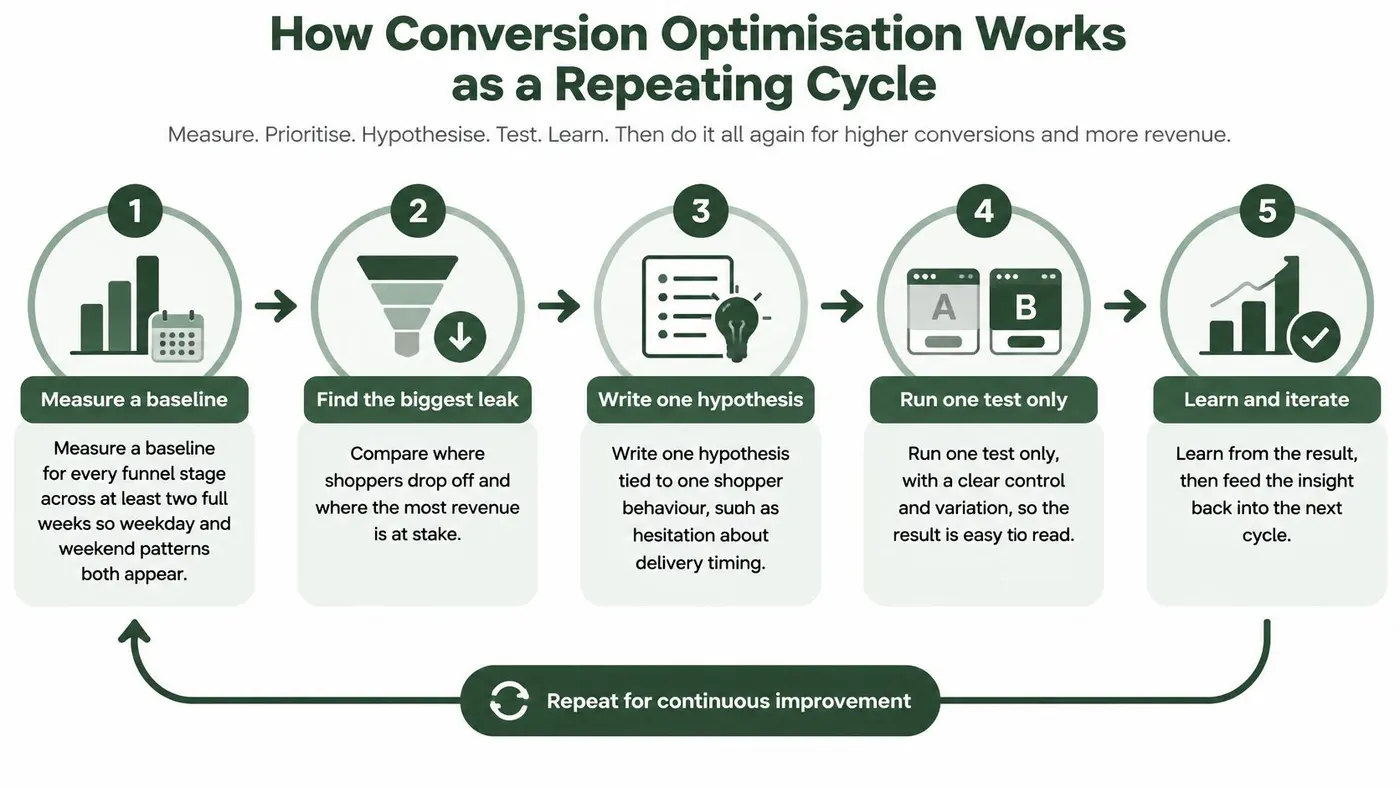
Steps one and six are where programmes fall apart. Teams baseline for three days and then wonder why a result reverses a fortnight later. Or they ship a winner and move straight to the next idea with no record of why the last one worked, so the same test gets run again eleven months later by a different person.
Why the Loop Repeats Instead of Ending
Walk a shop floor with a good manager and you'll see the same method. She doesn't re-merchandise the entire store because one aisle underperforms. She stands near the doorway on a Saturday, watches where people turn back, moves one display, and checks the till receipts the following week.
An online store hides that walk from you, so the loop substitutes for it. Each cycle buys one fact about your own shoppers that no benchmark can supply, and the fact is only worth having if you changed one thing and measured it.
The Cycle on One Page
Copy this into your planning doc. Week 1: baseline five funnel stages by device across 14 days. Week 2: rank leaks by revenue at stake, write three hypotheses, score them. Weeks 3 and 4: run the top test against one primary goal. Week 5: decide, document, choose the next hypothesis from what you learned.
A team that turns that page over five times a quarter will beat a six-month replatform every time, and it will still hold the documentation to prove why. For the commercial context around the loop, Class A Media's ecommerce sales insights cover how merchandising, pricing and post-purchase experience feed the same revenue number.
Finding Where Shoppers Leave Your Funnel
A funnel is five doors, and each one leaks for a different reason. Reading them separately stops you fixing the product page when the main problem sits three steps later, or rewriting headlines when the issue is a payment method you don't accept.
Funnel stage Metric to read Typical symptom First test to run Landing to product view Product views per session Shoppers leave category or home pages Match the landing headline to the ad or search term Product view to add to cart Add-to-cart rate Doubts about fit, delivery or returns Show delivery date and returns policy beside the buy button Cart to checkout started Checkout start rate Unexpected shipping cost or unclear totals Show the full cost, including delivery, in the cart Checkout to purchase Checkout completion rate Forced account creation or payment declines Offer guest checkout and an alternative payment method Repeat purchase within 90 days Repeat purchase rate Weak post-purchase experience Test a post-order follow-up or loyalty offerThe checkout door deserves first attention on most UK stores. A 2025 study from Leeds Beckett's Retail Institute found that approximately 74% of online baskets did not become completed orders, and that abandonment was higher on mobile (76%) than on computers (67%), according to the checkout abandonment study.
That nine-point gap is why I'd segment every stage by device before picking a fix. A treatment that lifts desktop completion and does nothing on mobile looks like a win in an aggregate report while the majority of your traffic sees no benefit at all.
Account friction is the other recurring thief. In a UK survey of 2,108 adults, 30% objected to being forced to create an account, while 40% cited security concerns as a reason to abandon, per Elavon's breakdown of cart abandonment reasons.
Ranking Leaks by Money at Stake
Multiply the sessions reaching a stage by the drop rate, then by average order value. Ten thousand checkout starts, a 25% drop and a £60 average order value put £150,000 a month at stake on that one door. That figure, not the raw percentage, tells you which test runs first.
If you want a second opinion on how page-level fixes map to these stages, Next Point Digital's guide to improving conversion rates is worth reading alongside your own funnel data.
Measuring Revenue Alongside Conversion Rate
Conversion rate is the most reported number in ecommerce and the worst one to decide on alone. It tells you how often visitors buy. It says nothing about what they spend, what the test cost you in margin, or whether the variant slowed the site for the shoppers least able to tolerate it.
Metric How it is calculated What it reveals How to read it Conversion rate Purchases divided by sessions How often visitors buy Read with revenue per visitor Average order value Revenue divided by orders Size of each basket Explains conversion gains that lower revenue Revenue per visitor Revenue divided by sessions Combined effect of conversion and basket size Primary decision metric Incremental revenue Variant revenue minus control revenue Revenue the test added Confirm with a sample large enough for significance LCP and INP by connection class Page timing split by network speed Whether the variant slows usable checkout access Reject variants that fail the guardrailThe table sorts itself into a hierarchy once you've watched a few disagreements. A variant can lift conversion rate and cut revenue per visitor at the same time, usually by pulling in smaller, more cautious baskets or by discounting traffic that would have bought anyway. Decide on revenue per visitor, then use conversion rate to explain why it moved.
Performance Guardrails That Overrule a Win
Network conditions in the UK are not uniform, and median broadband figures hide the shoppers most likely to bounce. Ofcom's 2025 measurements found that 28% of UK 4G connections and 88% of 3G connections had average download speeds below 10 Mbit/s, and 5% of 4G connections sat below 2 Mbit/s, per the Mobile Matters 2025 report.
Set guardrails before launch: LCP under 2.5 seconds and INP under 200 milliseconds, measured separately for 4G and 3G shoppers. Heavy test code, blocking tags and late-rendering CTAs all fail that check, and a variant that improves clicks while degrading usable checkout access is not a winner.
Agree the statistics too. Ninety-five percent confidence with p below 0.05, 80% statistical power, and a sample size calculated from your baseline rate and the smallest lift worth shipping. Run every test for at least two full weeks so weekday and weekend patterns both appear. If you want the metric hierarchy laid out in more detail, Otter A/B's guide to A/B testing metrics covers how each outcome pairs with its own significance test.
Product Pages and Delivery Messaging That Convert
A product page has one job that outranks everything else: answer the doubt that stops the click. Layout taste matters far less than whether the shopper finds a delivery date, a returns promise and a price without scrolling sideways on a phone.
The Order a Shopper Reads the Page In
Above the fold, put the product name, the price, an estimated delivery date and a single add-to-cart button. On mobile that button should stick to the bottom of the viewport rather than disappear once the shopper scrolls past the description.
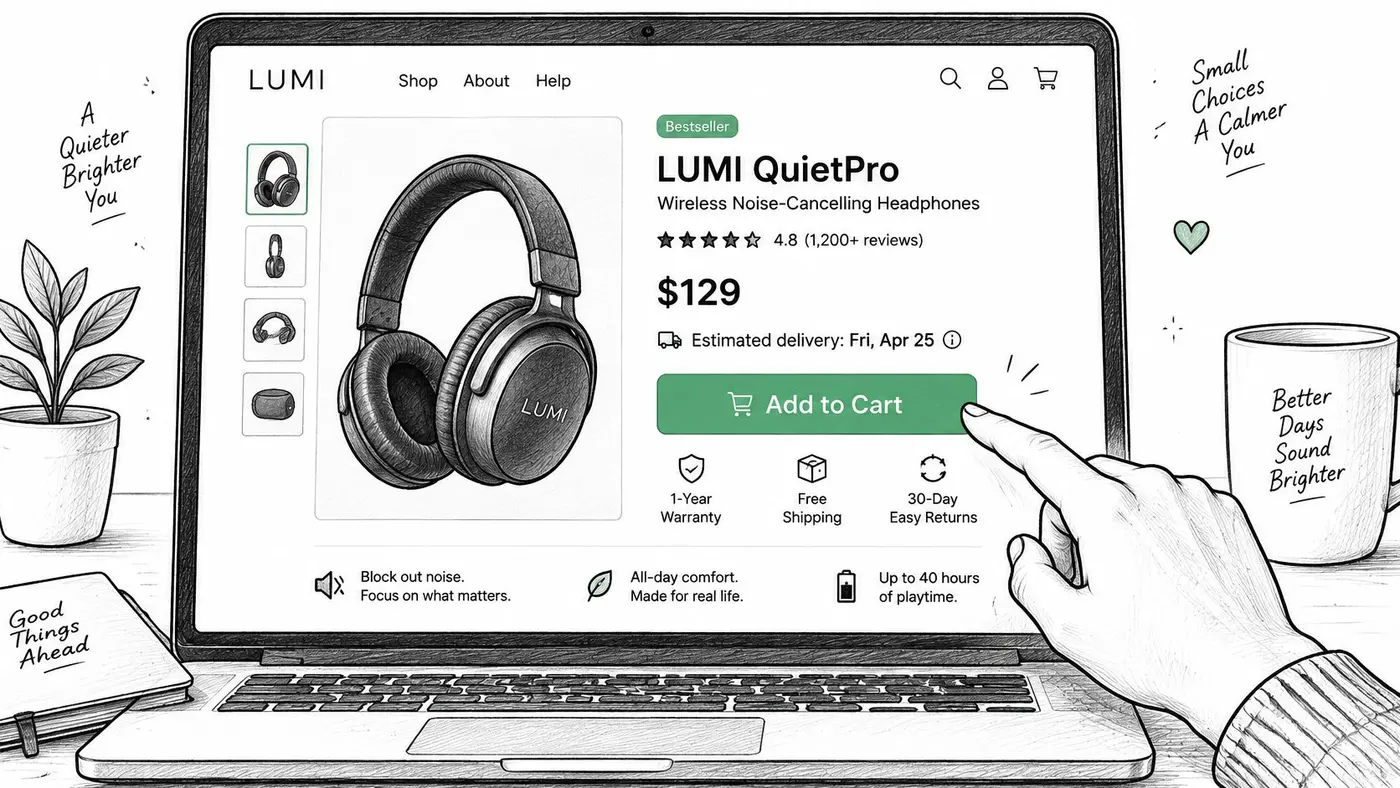
Imagery comes next, and it exists to answer fit and scale: several angles, a reference object or model measurement, and zoom that works with a thumb. Reviews belong beside the buy button rather than at the foot of the page, because the shopper who needs reassurance is the one who hasn't scrolled yet. Delivery and returns get summarised on the page itself with a real arrival date, not the phrase "calculated at checkout".
Delivery Choice Beats a Free-Delivery Banner
Most advice treats delivery as a pricing objection and prescribes a free-shipping threshold. The evidence points somewhere more specific. A 2025 survey of 1,000 UK shoppers found that 40.6% had abandoned an online purchase in the previous year because of delivery issues, with high shipping costs cited by 78.5%, slow delivery by 41.6% and unclear or inconvenient options by 24%, according to Sendcloud's analysis of UK delivery abandonment. DHL research reported alongside it found that 80% of British consumers would abandon a purchase if their preferred delivery option were unavailable.
Read those two together and the test order changes. Before you touch the free-delivery threshold, test a visible collection-point or locker option beside home delivery, with the speed and price of each shown plainly. Then test a specific arrival date line against a generic free-delivery banner.
Watch add-to-cart rate, checkout starts and revenue per visitor, split by category. A delivery promise that converts for a £20 accessory may frighten a £400 purchase. The product page optimisation guide from Otter A/B goes deeper on element-by-element testing, and Wispra's guide to on-page optimization for ecommerce covers how the same elements that answer shopper doubt also earn organic traffic.
Checkout Trust, Guest Access and Account Friction
Shortening checkout is the default advice. It fails as soon as a shopper needs proof the basket is right and the payment is safe. Fewer fields and more reassurance pull in opposite directions.
Strip the order summary to save a screen and you also remove the last check that the basket is correct. Remove the padlock and the card logos to reduce clutter and you remove the cue that settles a nervous buyer. A shorter form that turns first-time browsers into failed payments is not an optimisation. I would keep one extra line of reassurance rather than ship a cleaner layout that loses the order.
The Age Split That Breaks One-Size Checkouts
Two objections dominate UK abandonment: doubt about whether the site is safe, and resentment at being forced to register before paying. They do not land on every shopper the same way. Security concerns weigh more heavily on some groups. Others would rather use a wallet or buy-now-pay-later than type a card. Device and order value shift the choice again. A small reorder and a large first purchase do not need the same friction.
One checkout treatment cannot serve both. Segmentation by confidence, age band, device and order value will beat a single best-practice checklist. Judge the result on revenue per visitor, not on the conversion rate of the payment step alone. Most of these tests only win for some shoppers.
Practical rule: stop asking whether guest checkout lifts conversion. Ask which shopper it lifts it for, and what it costs you in account creation, payment success, fraud and revenue per visitor.
Five Experiments Worth the Traffic
- Guest checkout with registration after purchase: offer the account at the confirmation step, when the shopper has a reason to return.
- Visible security explanation at the payment step: one plain sentence about encryption and what appears on the statement, not a badge farm.
- Accessible error recovery for declined cards: inline messages that keep the entered data and suggest a retry or another method.
- Alternative payment methods: wallets and instalment options placed where the shopper expects them, tested separately so each fee is judged on revenue per visitor.
- Progressive verification: extra checks only when order risk is high, rather than interrogating every buyer.
Run them one at a time. Stack all five and you will not know which change paid.
What to Measure Beyond Checkout Conversion
Track conversion by age band and device, payment success rate, support contacts per 1,000 orders, fraud losses, repeat purchase within 90 days, and revenue per visitor. A treatment that lifts immediate conversion while failed payments or support volume rise has bought nothing. If revenue per visitor falls while conversion rate rises, the test lost.
Check where the steps live before you plan the work. Hosted checkouts, Shopify's included, restrict which fields, buttons and messages a testing tool can change, so several ideas above belong in a development sprint rather than a split test.
Ranking Tests by Revenue Impact and Season
Every backlog grows faster than the team can test it. The framework you use to order it decides whether a year of experiments compounds or wanders.
Framework Scores used Strength Weakness ICE Impact, confidence, ease (1-10 each) Quick to score for a small team Impact guesses can be inflated PIE Potential, importance, ease (1-10 each) Built for prioritising pages Ignores direct revenue value Revenue-weighted score Expected revenue uplift, confidence, effort Links every test to money Needs traffic and basket data firstICE and PIE are fine for triage, but they let a team argue impact without ever naming a figure. The revenue-weighted score fixes that: expected monthly uplift, multiplied by your confidence, divided by the days of effort. You can run the arithmetic in a test prioritisation calculator rather than a spreadsheet.
Seasonality Sets the Schedule
Timing matters as much as score. ONS data show internet sales represented 27.1% of total UK retail sales in 2024, rising from 26.3% in the first quarter to 29.1% in the fourth, while November and December together generated £6,250.4 million in internet retail sales, per the ONS retail sales time series.
Peak shoppers behave differently from January shoppers: urgency is higher, patience is lower, and delivery dates become decisive. Record the period against every result, and re-run your winners during the Christmas quarter rather than assuming they hold.
A Worked Example With Estimates, Not Promises
Take a store with 60,000 monthly sessions, 2% conversion (1,200 orders) and a £65 average order value, so £78,000 a month. Candidate A, a delivery-date line on product pages, is estimated at £3,900 monthly uplift with 60% confidence and 2 days of effort, scoring 1,170. Candidate B, a guest-checkout test, is estimated at £2,600 uplift with 50% confidence and 8 days of effort, scoring 163.
Run A first. Treat every one of those numbers as an estimate until real test data replaces them.
A Conflicting Test Result Decided by Revenue
Here's a composite case, not a client result, to show how to decide when the metrics disagree. A store tests a checkout variant that adds an upfront delivery estimator.
The control runs 40,000 sessions at 2.0% conversion, producing 800 orders at a £70 average order value: £56,000 revenue and £1.40 revenue per visitor. The variant lifts conversion to 2.3%, producing 920 orders, but average order value falls to £58, so revenue lands at £53,360 and revenue per visitor at £1.33.
- Note the cause. Conversion rose 15%, which explains why the variant looked good in the dashboard but doesn't decide the test.
- Calculate revenue per visitor. It fell about 5%, and it is the primary metric.
- Check the guardrails by device and connection class. Here, mobile 3G shoppers saw slower CTA render times.
- Reject the variant and log the lesson. Shoppers who accept the estimator buy smaller baskets, so the next test pairs the estimator with a basket-building offer.
Revenue per visitor decides. Conversion rate explains.
Run Your First Revenue-Led Test This Quarter
Pick the single leak with the most money at stake from your funnel table, and write one hypothesis tied to one behaviour.
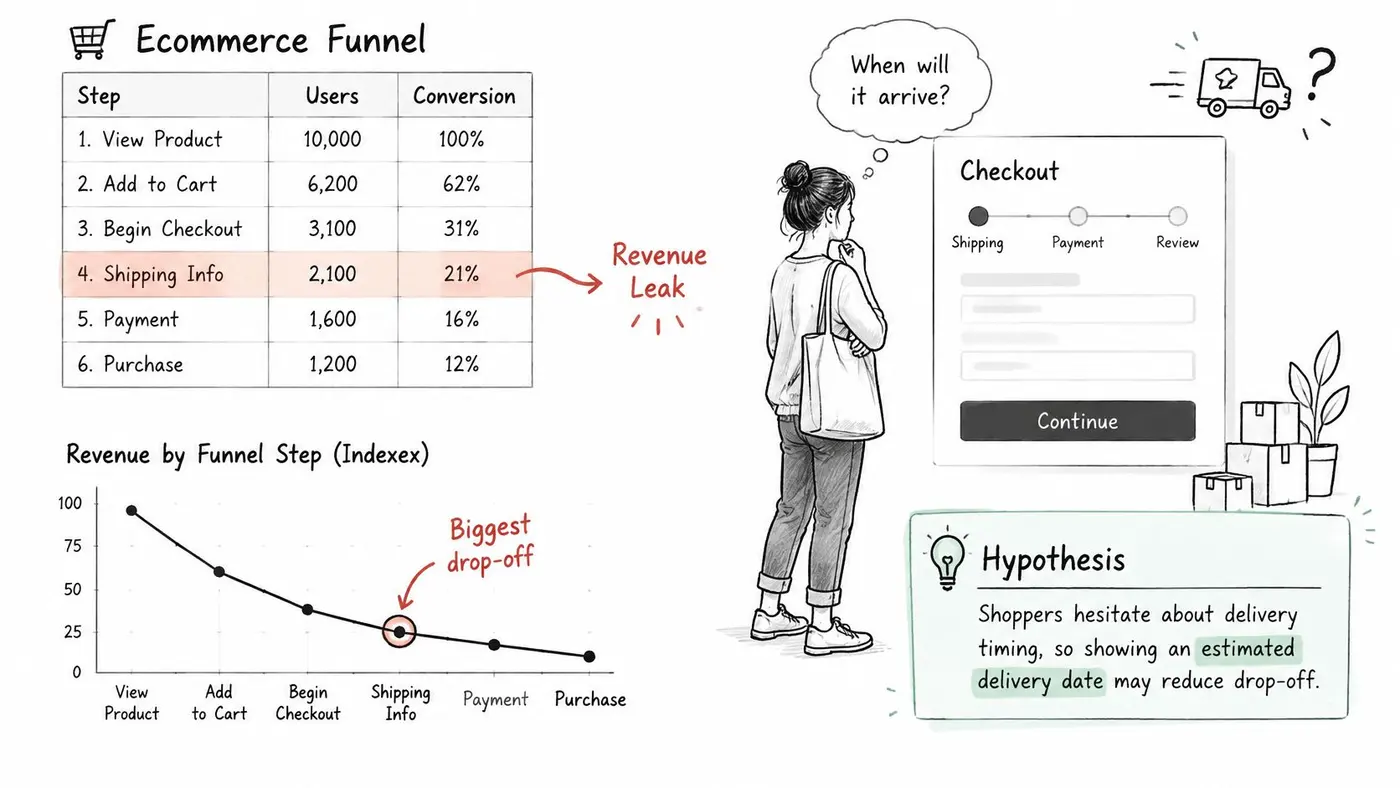
- Name the behaviour. Shoppers hesitate about delivery timing, so an estimated arrival date beside the buy button should raise add-to-cart rate.
- Fix the goal before launch. Revenue per visitor is the primary metric, with conversion rate and average order value as the explanation.
- Set sample size and duration to cover at least one full business cycle, calculated from your baseline.
- Check the guardrails on mobile and slower 3G connections before trusting any result.
- Decide and document. Ship or drop, then record what the test taught you.
Otter A/B reports conversion rate, average order value and revenue per visitor side by side for every variant, and with the pixel connected it gives revenue per visitor its own significance test. When conversion rate and revenue disagree, it says so rather than declaring a winner.
Otter A/B is built for exactly the decision this guide keeps coming back to: it shows conversion rate, average order value and revenue per visitor for each variant, and with the pixel connected it runs a separate significance test on revenue per visitor so a smaller-basket "win" can't slip through. If conversion rate and revenue point in different directions, it tells you instead of picking a winner for you. Start a first test free at Otter A/B and settle the argument with your own store's numbers.
Stop guessing
Ready to start testing?
Set up your first A/B test in under five minutes. No credit card required.
- 14-day free trial
- No credit card required
- Cancel anytime