Why a B Testing
Why A/B testing - Why A/B testing helps UK teams make evidence-based decisions, lift conversions and avoid costly guesswork, with practical website examples
You've sat in this meeting. Someone says the headline is doing too much and should be cut in half. Someone else says it isn't specific enough and needs a number in it. Both have run online stores for a decade. Both are certain. The change ships on Friday because the louder person was in the room, and three weeks later nobody can say whether it helped or whether the first week of the month was busier than usual.
The reason why A/B testing is worth the effort isn't that measurement is more interesting than judgement. It's that judgement arrives before the traffic does and never has to prove itself. An experiment does.
What A/B Testing Shows That Opinions Cannot
A/B testing, also called split testing, shows two versions of the same page to different groups of real visitors at the same time, assigns each visitor at random, and measures which version produces more of the single outcome you care about: purchases, sign-ups, completed checkouts, revenue per visitor.
A high-street shop can test two window displays, but only by running one for a fortnight and then swapping. Sales differ, and so do the conditions. Payday landed in the second fortnight, the weather turned, a competitor ran a promotion. The comparison is muddied by everything that changed besides the window.
A split test removes that problem by running both displays at once. Half your visitors see version A, half see version B, and both groups face the same weather, the same ad campaign, the same bank holiday weekend. The only systematic difference between them is the thing you changed.
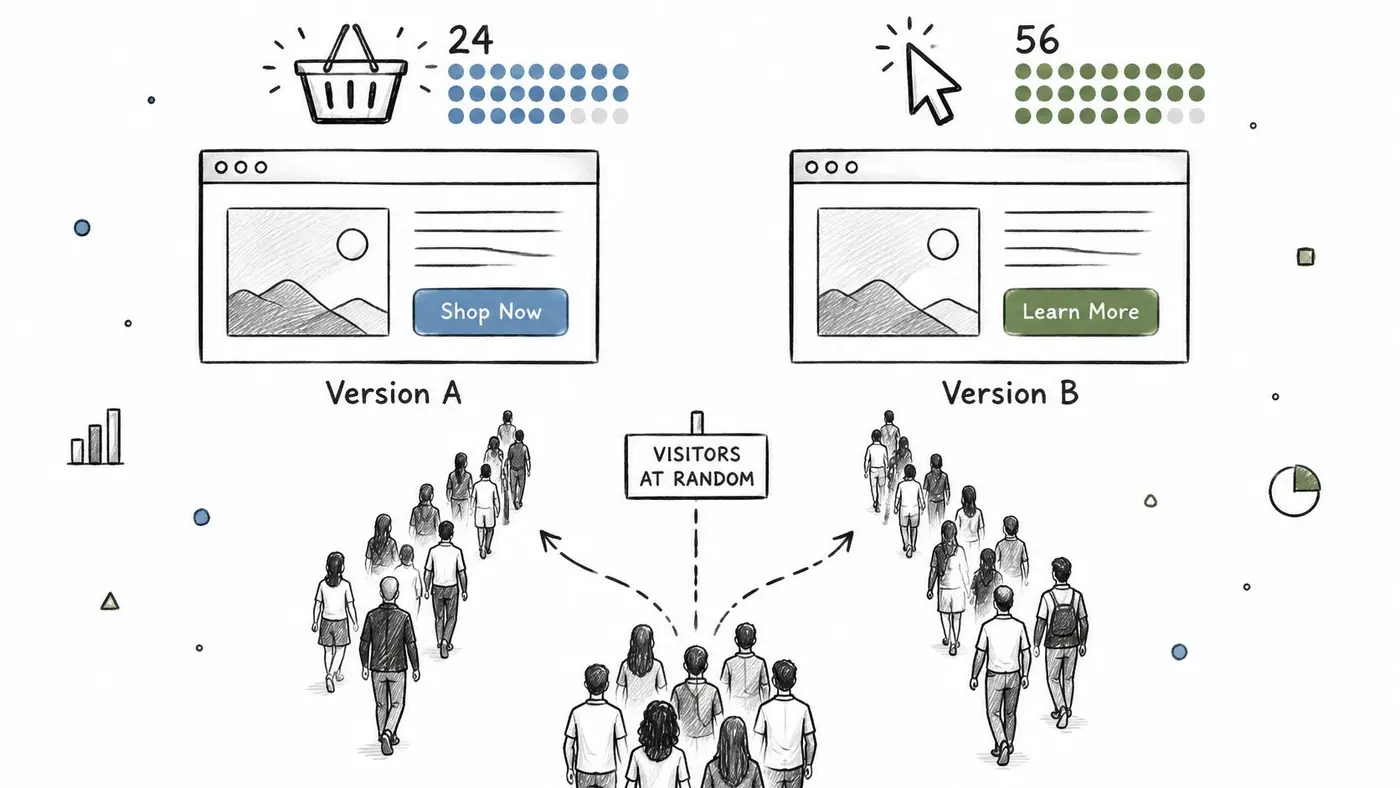
That random assignment is what makes the comparison fair. Opinions, by contrast, are formed in rooms where nobody is buying anything. A test is judged by what visitors did, which is a much less forgiving audience.
Every properly run test gives a team three things:
- A control. Your current page stays in the test, so the comparison is against what you have now, not against a memory of last quarter's dashboard.
- An effect size with a margin of uncertainty. Not "B is better", but "B looks roughly this much better, give or take this much".
- A record. Even when the new version loses, you've learned something durable about your customers that stops the same argument returning next quarter.
There's real money riding on those small decisions. The Office for National Statistics reported that online sales accounted for 27.8% of total retail sales in Great Britain in July 2024, up from 27.4% in June. When more than a quarter of retail spending runs through a screen, the wording of a headline stops being a design preference.
The rule to carry forward: ship a change because your visitors behaved better when they saw it, not because it looked better in the meeting.
Where Guesses Fail and Where Tests Pay Off
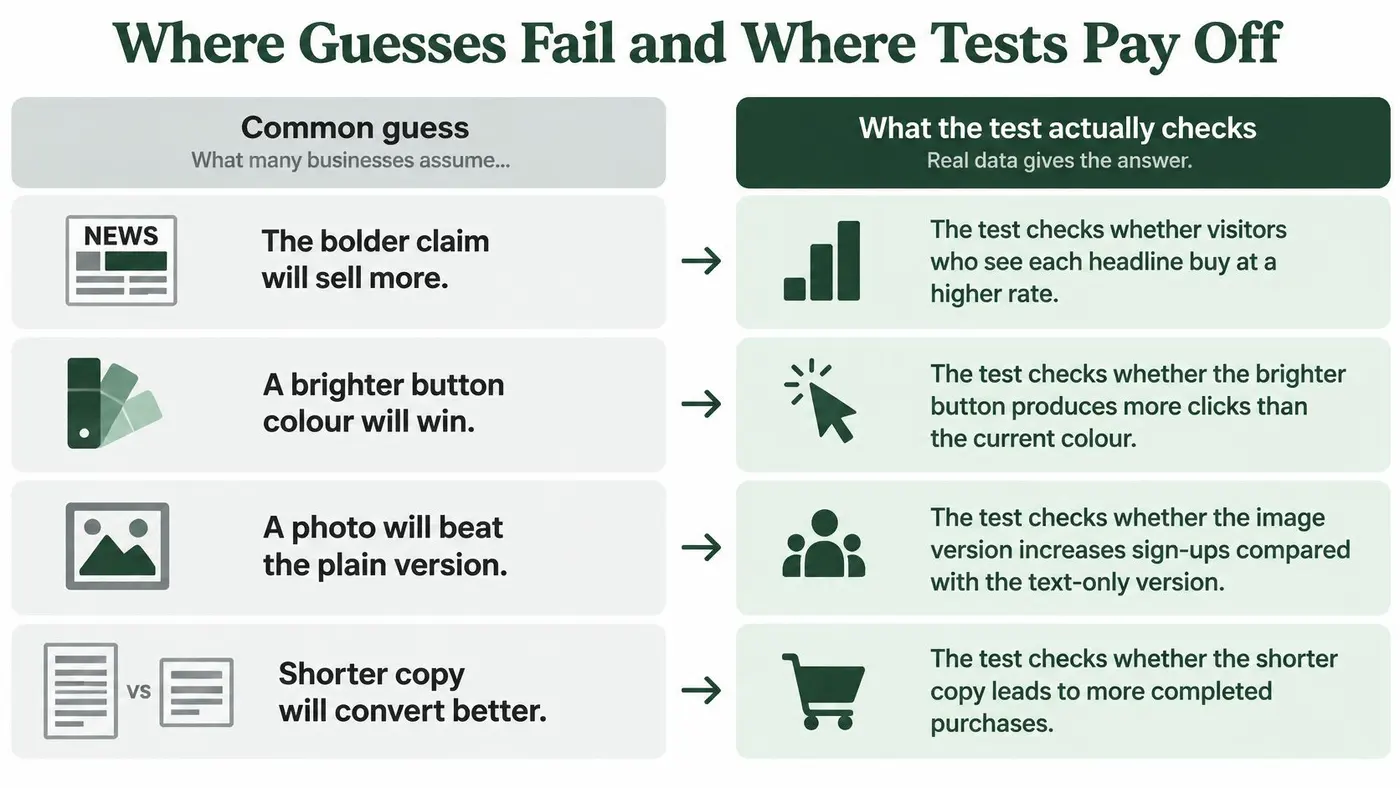
Most website decisions begin as a guess with a confident voice behind it. The useful discipline is to write the guess down next to what an experiment would check, because the gap between the two is usually where the money sits.
Website decision Typical guess What an A/B test checks Headline wording The bolder claim will sell more Whether visitors who see each headline buy at a higher rate Button colour A brighter colour gets more clicks Whether purchases change, not just click-through Checkout steps Fewer fields always converts better Whether removing a step lifts completed orders and revenue per visitor Product page layout The new design looks cleaner Whether purchases and average order value hold upRead those four rows together and a pattern appears. Each guess is a claim about attention, and each test measures money. A bolder headline can pull clicks from people who were never going to buy, so clicks rise while orders stay flat. A brighter button can lift click-through and reduce purchases, because it now reads as an advert rather than a next step. Stripping a field from checkout can raise completed orders while lowering average order value, if the field you removed was the one qualifying the order.
Say a homeware store tests a new hero image for a month. The new one wins every informal review in the office. In the test it produces fewer purchases per visitor than the original, so the original stays, and the team redirects the effort into clearer delivery information above the fold, which was the actual complaint in the support inbox all along. The redesign they didn't ship saved more than the lift they were hoping for.
Where a first test is worth running
- Landing page headline. Benefit-led against feature-led, measured on sign-ups rather than time on page. It's the cheapest variant to build and the one your team argues about most, which makes it a decent first outing.
- The call to action. "Start your free trial" against "Get started", measured through to completed signup. A button can win on clicks and lose on completions, so follow the visitor to the end of the journey before you declare anything.
- Delivery information on the product page. Above the fold against below it, measured on add-to-basket and purchases. For UK stores this is often the largest unknown in the whole funnel.
- Guest checkout. Guest against required account creation, measured on completed orders and revenue per visitor. Forcing an account is a default almost nobody has defended with data.
- Onboarding. A shorter first-run flow measured on feature adoption at day seven. Fewer steps usually look better and sometimes aren't, because the step you deleted was doing the teaching.
A fashion retailer can put a free-returns banner on every product page and watch it get clicked all day. That only tells you the banner is visible. Judging it on purchases tells you whether the promise of free returns moved anyone, and whether the returns cost ate the margin. Start where visitors leave the funnel most, not where the design team is most bored.
Write your own version of that table for the three debates your team has had longest. The exercise usually shows that two of them were never worth arguing about, and one was worth testing a year ago.
How Small Lifts Add Up to Real Revenue
The arithmetic is what makes testing worth defending in a budget meeting. Take a store with 10,000 visitors a month and a 2% conversion rate: that is 200 orders before anyone changes a pixel.
A 5% relative lift moves the rate from 2.00% to 2.10%, which is 210 orders. Ten extra orders a month sounds modest until you price them: at an illustrative £60 average order value, one sentence on a button is worth £600 a month. If the change is harmful, the same sum leaves the till just as easily.
Relative lift Extra orders per 10,000 visitors 5% 10 10% 20 20% 40The 10% and 20% rows reach 220 and 240 orders on the same base. That is why smaller sites should spend limited tests on changes large enough to matter: a rewritten offer, a rebuilt checkout step, delivery terms moved where buyers decide. A shade of green can win a debate and still be too small to pay for the test.
Scale explains the fear as well as the upside. The Office for National Statistics reported that UK businesses generated £459.2 billion in website sales in 2021, up 28.8% from £356.4 billion in 2019. On a base that large, an untested redesign is a revenue opinion with a launch date.
One wording trap catches almost everyone. Moving from 2% to 2.1% is both a 5% relative lift and a 0.1 percentage point gain; one sounds exciting, the other sounds like rounding error. Convert both into orders and pounds and the argument usually ends.
Run your own version with monthly visitors × conversion rate × average order value, then apply the lift you think is realistic. If you want the arithmetic handled for you, use a revenue impact calculator; if the projected gain would not change a decision, the argument is not ready for a test.
Minimum Traffic and Sample Size Before You Test
A store owner is sure the new offer will beat the old one. Three weeks later the chart is flat, so the original page stays up. The test never had enough visitors to notice a real lift. A flat result is often a sample that was too small, and reading it as a tie is how a worse page stays live while revenue follows a confident opinion.
Two terms decide whether a test can answer the question at all.
Statistical power is the chance the test detects a real effect if one exists. Run an underpowered test and you will often conclude "no difference" when a difference was there to find. Minimum detectable effect is the smallest lift the test can reliably catch. Your traffic and baseline conversion rate set it, not how ambitious the idea feels.
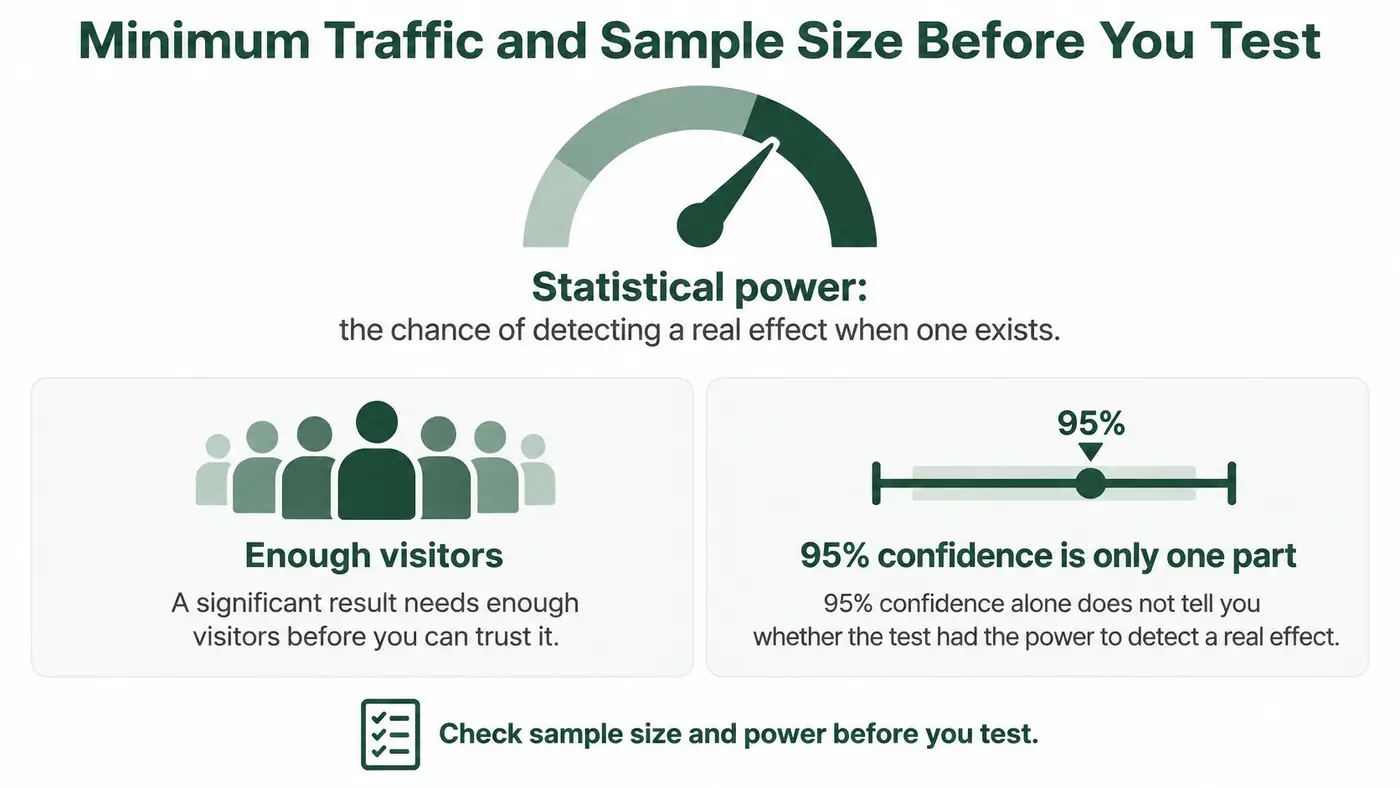
Detecting a small relative lift at a 2% baseline needs hundreds of thousands of visitors per variant. Many smaller sites, in a whole month, gather enough traffic for only one arm of one test. A button colour will not clear that bar. Checkout friction, delivery costs, payment trust and mobile load time might, because those changes can move conversion by an amount a modest sample can see.
Four inputs set the answer: baseline conversion rate, traffic, the minimum detectable effect you would act on, and the power you want. 80% is the usual working standard. Turn them into a required sample size before anyone builds the variants. Otter recommends running a sample size calculator before launching any test. It is a two-minute check that stops a month-long experiment from coming back unreadable.
Then set the duration. Required visitors per variant, divided by daily visitors per variant, gives the days. Fix the stop date at the start and leave it there. Checking every morning and stopping the moment the numbers look good inflates the false positive rate, so a winner found that way is often noise with a tidy chart.
With more than two variants, the significance bar has to rise, or a three-way test produces a false winner more often than a two-way one. For A/B/n tests, Otter adjusts the significance threshold automatically using a Bonferroni correction. The same adjustment can be applied by hand in a spreadsheet.
When the numbers cannot support a reliable test, use session recordings, support tickets and five user interviews, then act on what you find. Ask this before you write a hypothesis: how large must the improvement be for this traffic to make testing worthwhile?
Privacy and Consent Checks Before Launch
The assumption worth challenging is that privacy is an analytics footnote, something settled after the test is built. Under UK GDPR it belongs in the design.
The Information Commissioner's Office guidance on data analytics says large-scale analytics that profiles individuals is likely to require a Data Protection Impact Assessment, and it emphasises privacy by design and by default. An experiment that assigns visitors to variants and joins that assignment to purchases is analytics. Decide what yours collects before it collects it.
Four questions, answered in writing before launch:
- What does this experiment need? Anonymous variant assignment plus an outcome event is usually enough to answer a conversion question.
- Can assignment be randomised without an identifiable profile? Anonymous assignment and personalisation are different jobs with very different data appetites.
- What's the lawful basis, and how long do you keep the data? Write it down once and reuse it.
- What happens when a visitor withdraws consent? If the answer isn't a sentence your team can recite, the implementation isn't finished.
Keep sensitive URL parameters and form field values out of testing tools, and document every vendor with access. Test the consent notice itself, not just the funnel. The ICO notes that user testing can help organisations demonstrate that people understand and control their consent choices.
A conversion gain doesn't cancel a compliance cost. A lift won by collecting more behavioural data than the experiment needed is still a loss once legal, reputational and customer-trust costs land.
Our privacy and consent guidance covers how consent interacts with running tests, and it's worth reading before the first launch rather than after it.
Confirm Your First Test Before Launch
Run a test only when three conditions hold: the goal ties to revenue or a key action, your traffic supports the minimum detectable effect, and the privacy checks are documented. If any one fails, the answer isn't a weaker test, it's qualitative research or one large-impact change.
Five checks before you press launch:
- Write the hypothesis and the primary goal. Purchases or revenue per visitor, not clicks.
- Check the sample size and expected duration. If the test would run longer than the offer stays relevant, stop.
- Set the split and the stop conditions. Even split, fixed end date, no peeking.
- Confirm consent and data scope. Who sees what, and for how long.
- Preview every variant on the live site. On a phone and a laptop, twice. A variant that renders broken tells you nothing about your customers.
Netco Design's A/B testing framework sets out a structured way to shape the hypothesis, prioritise ideas and record the outcome, and it pairs well with the checks above.
Otter A/B is one option for running these tests on your site: visual A/B testing with unlimited variants, precise traffic splits and a one-line install with no developer handoff, and you can have your first split test running inside five minutes.
Pick one checkout or landing page test and run it this month. One readable result beats a year of redesigns nobody measured.
Otter A/B ties every experiment to money rather than clicks, so you can compare conversion rate, average order value and revenue per variant instead of guessing from a click count. Build your variants, set the goal, and read a result you can act on when the numbers reach significance. Visit Otter A/B to put your next argument to a vote.
Stop guessing
Ready to start testing?
Set up your first A/B test in under five minutes. No credit card required.
- 14-day free trial
- No credit card required
- Cancel anytime