What Does 95 Confidence Mean in A/B Testing?
What Does 95 Confidence Mean? Learn what the 95% level really tells you in A/B tests, what it doesn't, and how to read your results.
95% confidence means the testing method would capture the true difference in about 95 of 100 repeated tests, not that the variant has a 95% chance of winning. If that's what the number describes, what can you conclude when your A/B testing dashboard flags a winner?
The useful answer starts with a distinction: confidence describes a method; shipping is a decision. Your experiment estimates an effect, measures its uncertainty and applies a decision rule. You still need to decide whether the result is trustworthy and valuable enough to act on.
What 95% Confidence Actually Tells You
A confidence level describes how an interval-building procedure performs across repeated samples. It doesn't assign a probability to the headline, button or layout you've just tested.
The Office for National Statistics explanation of uncertainty makes this concrete: if researchers drew 20 random samples and calculated a 95% confidence interval for each, approximately 19 intervals would contain the population value, while one would miss it.
Think of each sample as a fresh scoop from the same well-mixed container. Each scoop differs slightly, so each estimate and its interval differ too. The population value stays fixed; the intervals move around it.
The interval moves, not the truth
In an A/B test, the quantity you want to estimate is usually the underlying difference between variant and control. Your visitors are a sample of the audience you want to understand.
Once you've calculated an interval, its boundaries are fixed. It either contains that underlying difference or it doesn't, although you don't know which.
What 95% confidence does and does not mean
Statement Verdict Why The method captures the true difference in about 95 of 100 repeated tests Correct Describes the procedure's long-run reliability There is a 95% chance this headline is the better one Incorrect The label doesn't give the probability that the hypothesis is true This specific interval holds the true effect with 95% probability Incorrect Once calculated, the interval either contains the value or doesn't The result is reliable against sampling error under stated assumptions Correct Nominal reliability requires sound randomisation, measurement and analysis The result is important enough to ship Not implied Significance doesn't establish commercial valueThis isn't just careful wording. Treating confidence as a verdict encourages teams to skip the assumptions that make the calculation meaningful.
For a significant result, a reusable interpretation is: the result is evidence against a no-difference model at a chosen error rate, under stated assumptions about traffic, randomisation and measurement.
How the 95% Threshold Turns Into a Decision Rule
A 95% label is a rule about the testing method, not a grade for the winning variant. The same observed difference can read as significant, as not yet clear, or as short of a stricter bar, depending on the error rate chosen before anyone looks at the data.
The null hypothesis is the starting assumption that the variant and control have no underlying difference. The test then asks a narrow question: how unusual is this sample difference if that no-difference story is true?
The conventional 95% threshold sets alpha at 0.05. Across repeated, properly specified tests, that alpha is a 5% false-positive rate when the null hypothesis holds. It is the rate at which the procedure rejects a true no-difference hypothesis, not the share of declared winners that must be wrong.
From sample to decision
A supermarket checkout is a plain analogy. One lane looks faster after a few shoppers, but ordinary wobble can produce that gap. You compare the gap with the wobble before you call the lane quicker.
An A/B test follows the same chain. Record outcomes for randomly assigned visitors. Calculate the variant-minus-control difference. Estimate the standard error, which is how much that difference would fluctuate from sample to sample. Extend either side of the estimate by the chosen critical value. Then check whether the interval excludes zero.
For a conventional large-sample interval, the structure is estimate ± critical value × standard error. The confidence setting changes the critical value. It does not change the observed conversion rates.
Confidence levels, error rates and z-scores
Alpha is one minus the confidence level. The two-sided z-score is the standard-normal quantile at 1 − alpha/2.
Confidence level Alpha (significance level) Two-sided z-score False positive chance per test 80% 0.20 1.28 1 in 5 90% 0.10 1.64 1 in 10 95% 0.05 1.96 1 in 20 99% 0.01 2.58 1 in 100These rates assume a true null hypothesis and a valid testing procedure. A stricter setting uses a larger z-score, so the interval is wider for the same sample. Detecting a given effect then generally needs more traffic.
Read one result three ways. At 80%, a modest gap may clear the bar because the method accepted a 1-in-5 false-positive chance. At 95%, that same gap has to sit outside a wider interval built with 1.96. At 99%, the estimate can fall back inside the interval even though the conversion rates never moved. The decision rule changed. The data did not.
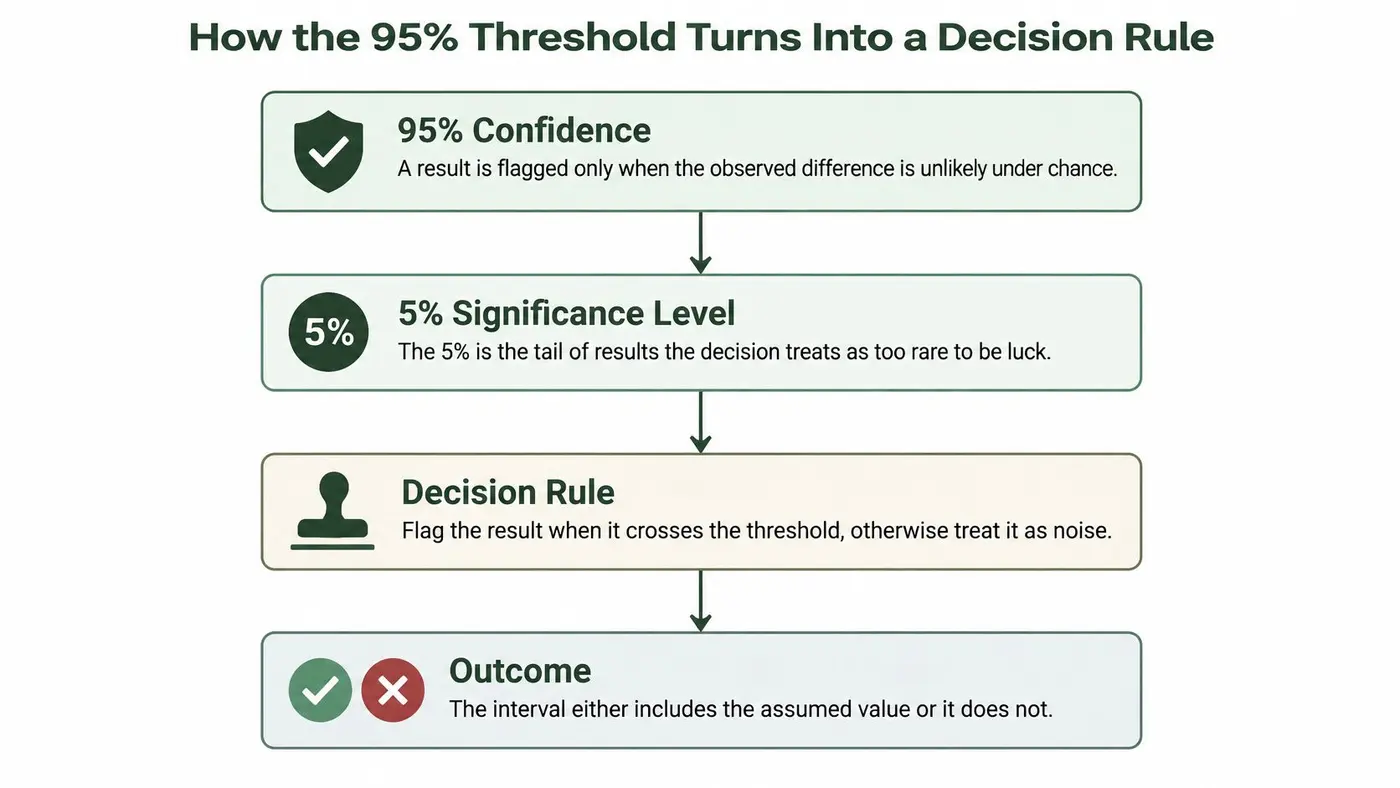
For a matching two-sided test, an interval that excludes zero means the result cleared the chosen threshold. An interval that still contains zero means the evidence has not cleared that threshold. Absence of a significant call is not proof that the effect is zero.
The probability calculation behind this comparison is set out in our p-value explanation. Teams coordinating experiments across channels can also use Sprints & Sneakers' guide to scaling multi-channel marketing tests to place each threshold decision in a wider testing process.
Reading the Interval Width With One Worked Example
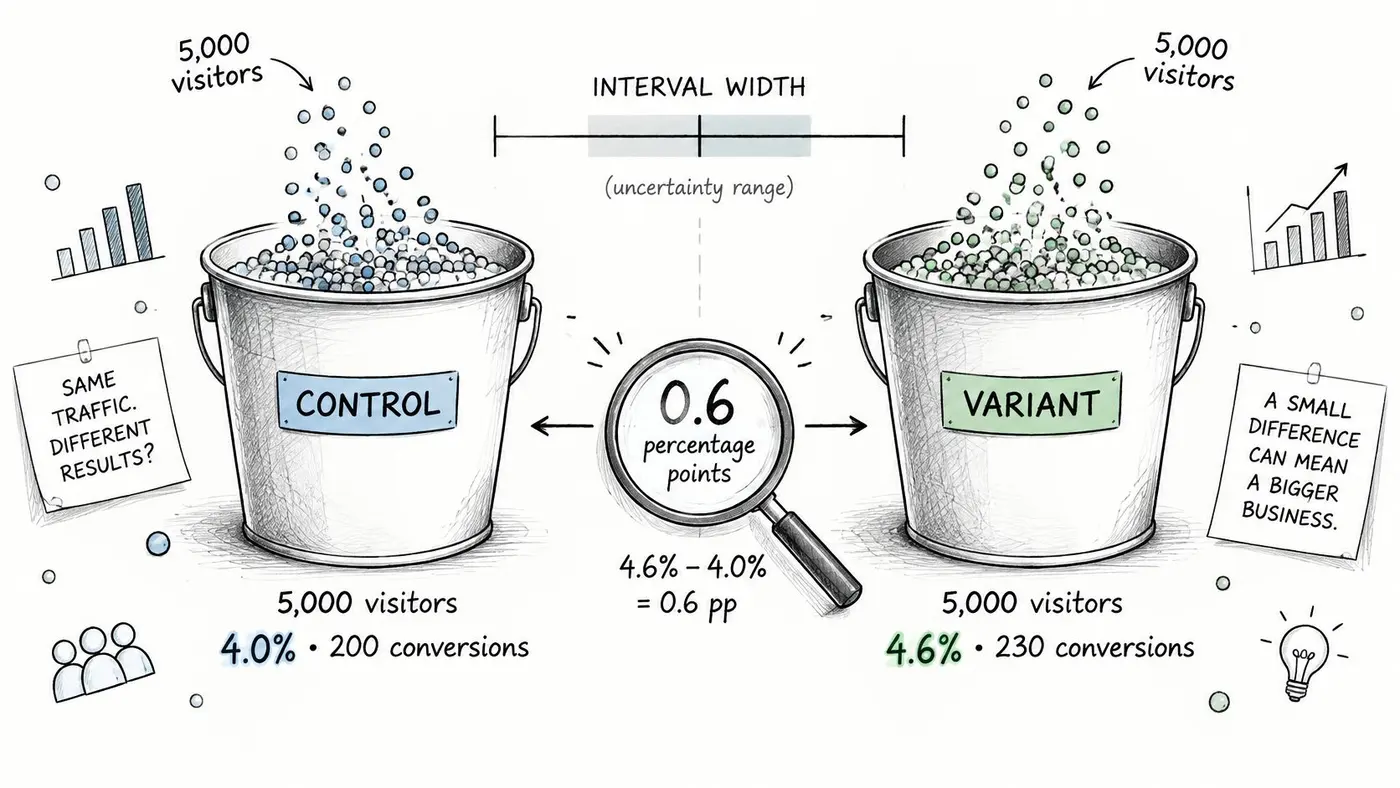
Say you run a hypothetical headline experiment with 5,000 visitors per group. The control produces 200 conversions, giving a 4.0% conversion rate; the variant produces 230 conversions, giving 4.6%.
The observed difference is +0.6 percentage points. That sounds promising, but it's only the estimate, not the complete result.
The illustration highlights the groups and the uncertainty around their results.
Calculate uncertainty around the difference
For this illustrative large-sample calculation, the standard error of a conversion rate is the square root of p × (1 − p) / n, where p is the observed rate and n is the number of visitors.
Using the hypothetical counts:
- Control standard error: √(0.04 × 0.96 / 5,000), approximately 0.28 percentage points.
- Variant standard error: √(0.046 × 0.954 / 5,000), approximately 0.30 percentage points.
- Difference standard error: Combine the independent groups by taking the square root of the sum of their squared standard errors, approximately 0.41 percentage points.
- Margin of error: Multiply by the conventional 1.96 critical value, giving approximately 0.8 percentage points.
The resulting interval is approximately −0.2 to +1.4 percentage points. This is a teaching approximation, assuming independent groups and suitable large-sample conditions; software may use a different interval construction.
Read that same result several ways. The midpoint favours the variant. The lower bound allows a small decline. The upper bound allows a useful improvement. Because the interval includes zero, the experiment hasn't distinguished the apparent gain from no difference at the chosen threshold.
Practical rule: Read both ends of the interval before you react to its midpoint.
Compare the possible decisions
The following intervals are hypothetical examples, expressed in percentage points, not relative percentage changes.
How to read four 95% interval outcomes
Interval (variant minus control) Includes zero? Reading and next step −0.2 to +1.4 points (worked example) Yes Not significant at 95%; continue to the planned endpoint or accept the uncertainty +0.5 to +2.1 points No Significant lift; ship only if the 0.5-point lower bound supports the implementation cost −1.1 to −0.3 points No Significant harm; stop the variant under the planned decision rule −0.9 to +2.3 points Yes Too uncertain to choose confidently; assess whether further sampling is worthwhileOfficial statistics demonstrate why a confidence label doesn't guarantee precision: ONS evidence to a parliamentary inquiry on COVID-19 reported an estimated 51,000 people infected at one point between 8 and 21 June, with a 95% interval from 21,000 to 105,000. The breadth of that range matters alongside the central estimate.
For a visual explanation of interval interpretation, the video offers another way to approach the concept.
When reviewing your experiment, inspect the estimated difference, both bounds, sample size per variant and the outcome being measured. A purchase interval answers a different business question from a click interval.
Our guide to what a confidence interval means in statistics explains the range itself in more detail. Don't infer the difference interval by inspecting whether separate group intervals overlap.
Common Misconceptions About 95% Confidence
The UK Statistics Authority's statistical guidance describes confidence in terms of repeated sampling: about 95 out of 100 intervals would contain the true population value. Everyday language makes it easy to turn that methodological statement into a much stronger promise.
A probability of winning
A confidence score tells me the chance that my variant wins. No: a frequentist confidence level describes the interval procedure, not the probability that your business hypothesis is true.
The consequence is practical. You shouldn't translate a confidence label into odds of success in a stakeholder presentation. If you want a probability statement about which variant beats control, you need an analysis explicitly designed to answer that question, with its assumptions made clear.
Proof and practical importance
A significant result proves the change works. No: it provides evidence against the specified no-difference model, rather than proving the proposed explanation.
A checkout redesign might alter several elements at once. Even a valid result for the complete redesign doesn't establish which element caused the improvement, or whether the effect will transfer unchanged to another audience.
A significant result must be worth implementing. No: the estimated benefit can be too small to justify development, maintenance or operational costs.
Define a minimum worthwhile effect before reviewing the result. Otherwise, it's tempting to call any favourable result valuable after you've seen it.
95% confident describes the method, not the answer.
A shared error allowance
The error allowance covers our entire testing programme. No: a per-test threshold doesn't automatically control errors across all the comparisons your team makes.
Running more experiments, inspecting more metrics and searching more audience cuts creates more opportunities to find an attractive result by chance. Keep a record of what you tested, not just the successful screenshots.
A narrow segment also deserves a narrower conclusion. A result among returning desktop visitors doesn't automatically support a site-wide rollout, and a conversion result doesn't establish a reliable revenue effect when purchases are sparse.
When someone asks, what does 95 confidence mean, ask them to name the estimated effect, the population and the assumptions behind the calculation. Those details determine what the statement can support.
Limits 95% Confidence Cannot Fix
A confidence interval accounts for sampling uncertainty within the statistical model. It doesn't check whether visitors were assigned correctly, whether purchases were recorded accurately or whether the analysis was chosen after seeing the outcome.
An interval can therefore be narrow and still describe the wrong thing. If one variant loses purchase events because of a tracking bug, collecting more visitors won't repair the measurement.
Match the safeguard to the problem
Problems that undermine a 95% result
Problem Why the 95% label fails Fix Checking daily and stopping at first significance Repeated looks undermine the nominal false-positive control of a fixed-horizon test Set sample size and end date before launch, or use a valid sequential method Testing several variants at once More comparisons create more opportunities for a chance winner Use a multiple-comparison correction for A/B/n tests Too little traffic The interval stays wide and a real effect can look inconclusive Run the sample size calculator before launch Biased traffic or broken tracking The interval addresses sampling noise, not systematic distortion Check randomisation and measurement first Segment cuts after the test Searching subgroups can produce chance winners Pre-register segments or treat discoveries as new testsChecking a dashboard isn't itself the problem. Changing the stopping decision because the latest reading looks favourable is what invalidates a fixed-horizon interpretation. Operational monitoring for broken pages or tracking failures should continue throughout the test.
Multiple comparisons need a different safeguard. Decide which comparisons matter, identify the primary outcome and apply an appropriate correction rather than treating every comparison as an isolated experiment.
Plan for enough information
We recommend running the sample size calculator before launching any test to check whether there's enough traffic. Choose the smallest effect that would justify action, then assess whether your audience can support a useful experiment.
Our explanation of statistical power helps distinguish an effect that's absent from one your test wasn't equipped to detect.
Before launch: Write down the primary metric, audience, allocation, stopping rule and planned comparisons.
If the required sample is unrealistic, reconsider the experiment. A more substantial change or a more directly measured outcome may answer a better question than an underpowered test of a minor detail.
Confirm the Result Before You Ship
Use a pre-ship review to separate statistical evidence from permission to release.
- Confirm the planned sample and duration. Reaching the first favourable reading isn't a substitute for completing the design.
- Read the effect and its interval. Check whether the plausible range supports the decision, not just whether a badge appears.
- Inspect business outcomes per variant. Review purchases, average order value and revenue rather than relying only on clicks.
- Check the traffic cycle. Confirm that the experiment included the intended weekday and weekend audience.
- Verify the stopping rule. Make sure it was written down before launch and followed.
Choose an action the evidence supports
Ship when the whole interval supports a worthwhile improvement and the experiment passes its validity checks. Keep testing, within a valid plan, when uncertainty remains material and further sampling is justified. Stop when the range rules out sufficient value, or when harm or measurement problems make continuation inappropriate.
Every Otter A/B results page includes an automatic experiment health checklist showing whether the numbers are safe to trust and what to fix, plus an executive summary card stating whether to ship, keep testing or stop. Our free Sample Size, Significance and Duration calculators support planning and review.
Before launching your next experiment, run the sample size calculator and confirm that your traffic can answer the question you're asking.
Otter A/B helps you test website changes and connect conversion results to purchases and revenue. Visit Otter A/B to plan your next experiment with the free calculators and review the evidence behind your next shipping decision.
Stop guessing
Ready to start testing?
Set up your first A/B test in under five minutes. No credit card required.
- 14-day free trial
- No credit card required
- Cancel anytime