Above the Fold: What It Is and How to Test It
Above the fold explained: what belongs in the first screen, how speed and devices change it, and how to test it with real conversion data.
Visitors spend much of their page-viewing time above the fold, the first screen they see before scrolling. That attention can tempt teams to cram in every message, image and call to action. Yet visitors do scroll, so the opening screen should earn attention and give them a clear reason to continue.
In practice, the first screen shifts with the device, browser controls, orientation, zoom and font settings. A heavy hero image can also delay what visitors see. Treating the fold as a fixed rectangle risks optimising a layout that users may not experience. Instead, judge how speed and visual stability affect the first impression, then test whether each version supports the next step without harming the user experience. Measure revenue alongside clicks: a variant that attracts attention but makes the page slower or less stable may not be the better choice.
What Above the Fold Means and How Devices Move It
The phrase comes from print. Newspapers were folded in half on the newsstand, so only the top half of the front page was visible to anyone walking past, and editors learned to put the story they wanted to sell inside that band. On the web the band became the browser viewport. The Haringey Council research report defines above the fold as the first screen users see before scrolling, which makes it the page's initial decision-making area.
That definition describes a job rather than a measurement. The opening screen has to establish what the page is and what a visitor can do next. Everything else is negotiable, and wording that answers those two questions survives a change of screen size far better than a fixed layout does.

Why the Fold Sits in a Different Place on a Phone
Haringey's researchers warn that notifications, logos, search controls and hamburger menus can occupy much of the first screen on mobile. What's left is often too small for the primary message, the navigation or the call to action, and visitors scroll to confirm they landed on the right page. The same report notes that at least 1 in 5 people in the UK identify as disabled, which makes the first viewport an accessibility question as much as a conversion one. Essential information has to stay understandable without precise visual positioning, small controls or extra scrolling.
Two more things move the boundary that no design tool will show you. Rotating a phone changes the height available, and opening the on-screen keyboard can halve the visible area while someone is filling in a form. A call to action that sits comfortably above the fold in a desktop screenshot can be off screen at the exact moment a visitor reaches for it.
Neither Device Is the Afterthought
Traffic doesn't settle the argument either way. Digital Otter's UK web design statistics report desktop at 53.17% of UK web traffic in June 2026 and mobile at 46.83%, with desktop conversion at 3.4% against 2.0% on mobile. Nearly half your visitors get a version of the page you may never have opened on a real handset.
Practical rule: design the mobile first screen first, then check whether the desktop version uses its extra space for anything a visitor needs. Shrinking a desktop hero onto a phone is how pages end up with a call to action nobody can see.
An Audit You Can Run in Ten Minutes
Open the page on a phone and a laptop side by side, then answer three questions for each.
- Purpose: after a glance, can a visitor say what the page is for?
- Action: is the main action visible without scrolling, or has a cookie banner, a logo and a menu bar pushed it out of view?
- Next step: after one scroll, does the page reward the effort with useful detail, or repeat the headline?
Watch for the false bottom as well, where a section ends in a way that makes the page look finished while more content sits underneath. Record the answers. They hand you the variables worth testing: headline clarity, call to action prominence, navigation density and mobile layout.
What Belongs Above the Fold on Each Page Type
The first screen has three jobs on every page type. It says what the page is, shows the most important action or information, and offers a low-friction next step. What changes is which element carries the weight. Get that wrong and the rest of the page can't recover, because the visitor never travels far enough to read it.
GOV.UK's own record shows the principle being applied rather than guessed. The GOV.UK content principles and research background cites Nielsen Norman Group's F-shaped reading pattern, where people scan across the top of a page, drop down and scan a shorter band, then run down the left side. The homepage, used more than 1 million times each week, was redesigned in 2023 to move search higher because search was the most-used element, and featured content was placed above government activity because user need justified it. Placement followed observed behaviour, not house style.
Page type Lead element Keep in first screen Move below Homepage Clear brand or service statement Primary navigation and main call to action Long feature lists Product page Product name, price and image Add-to-basket button and delivery promise Full specification tables Landing page Headline matching the advert One visible call to action Secondary offers Category page Category title Filters and first products Long category descriptions Checkout Order summary Payment options and total Upsell offersReading the Table
Read each row left to right. The lead element is what a visitor must understand within a couple of seconds. The keep column is what has to survive on a phone without scrolling. The move column is material that still earns its place, just not before the visitor has decided to stay.
Two examples make it concrete. On a product page, the price and delivery promise belong beside the add-to-basket button, because those three pieces together answer the question the visitor is asking: whether to buy here, and when it arrives. Specification tables can wait until they've decided to care. On a landing page, the headline should repeat the wording of the advert that brought the visitor in, with one visible call to action and the secondary offers further down.
Where the Hero Goes Wrong
A visually rich hero image is not automatically the right lead element, and on mobile it's often the wrong one. If the image pushes the headline and the button down the page, the visitor meets your decoration before your offer. How to choose hero images that carry meaning is a better question to ask than how large the image should be.
Speed and Stability Decide What Visitors See First
The first screen has no fixed height. A phone, a desktop monitor and a slow connection can show different amounts of the same page, so speed and layout stability determine which message visitors see. Google's UK mobile site speed playbook reports that 75% of UK users consider page-load speed the factor with the greatest effect on their overall experience, while 50% leave a mobile site when loading takes longer than three seconds. The playbook also cites analysis finding that cutting mobile load time by one second lifted conversions by as much as 27%. Bounce rates averaged 13% below three seconds and approached 60% after nine.
UK-visited sites still show room to improve. Sayu's analysis of Core Web Vitals for UK-visited sites reports that roughly three in ten fail at least one Core Web Vitals threshold. Edmonds Commerce's analysis of Chrome User Experience Report data found that 50.5% of websites passed all three thresholds in 2024, up from 39% in 2022.
The Three Metrics That Govern the First Screen
Metric Good Needs improvement Poor Largest Contentful Paint (loading) 2.5 seconds or less 2.5 to 4.0 seconds More than 4.0 seconds Interaction to Next Paint (responsiveness) 200 milliseconds or less 200 to 500 milliseconds More than 500 milliseconds Cumulative Layout Shift (stability) 0.1 or less 0.1 to 0.25 More than 0.25Largest Contentful Paint (LCP) measures how long the largest visible element, often a hero image or headline block, takes to render. Interaction to Next Paint (INP) measures responsiveness after a tap. Cumulative Layout Shift (CLS) measures how much content moves while someone is reading or trying to click.
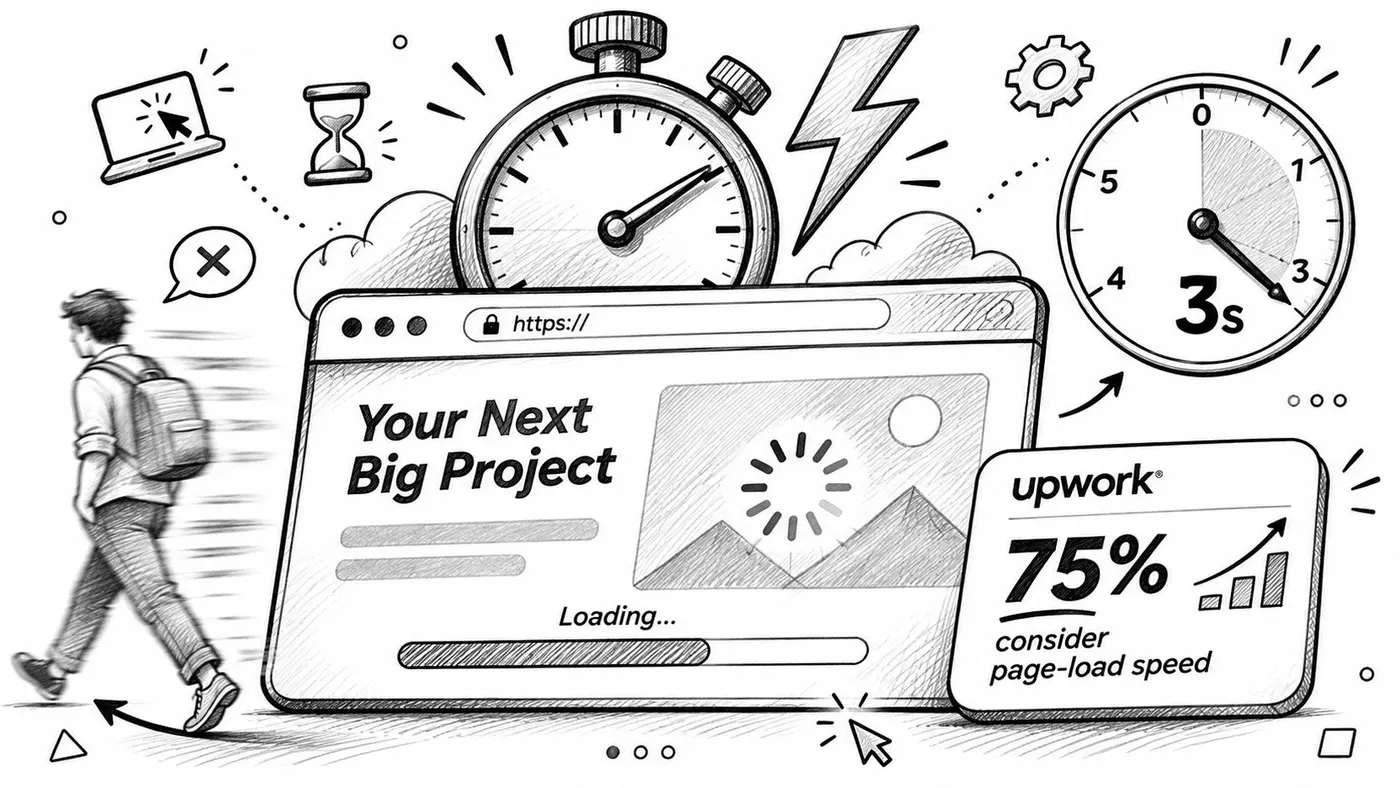
Check these metrics on each variant, not only on the current page. A larger hero image may strengthen the offer, yet take longer to load on a phone. A banner that appears late can shift the call to action just as someone taps, turning an intended click into a mis-tap. The same variant may behave differently on a phone and desktop, so assess both the content visitors see and how quickly it becomes usable.
The trade-off: every persuasive element added to the first screen can cost render time or stability. Judge variants by revenue and user experience, not click-through alone.
Keep the first screen's DOM lean, set fixed dimensions for media, and defer scripts that are not needed for the first paint. The Core Web Vitals optimisation guide explains ways to address loading, responsiveness and layout shifts. An A/B testing script should load asynchronously so it does not block the rest of the page from rendering.
How to Test Above-the-Fold Elements Step by Step
A test on the first screen is easy to run badly. The fix is procedural: decide what you're testing, change nothing else, and agree in advance what result would change your mind.
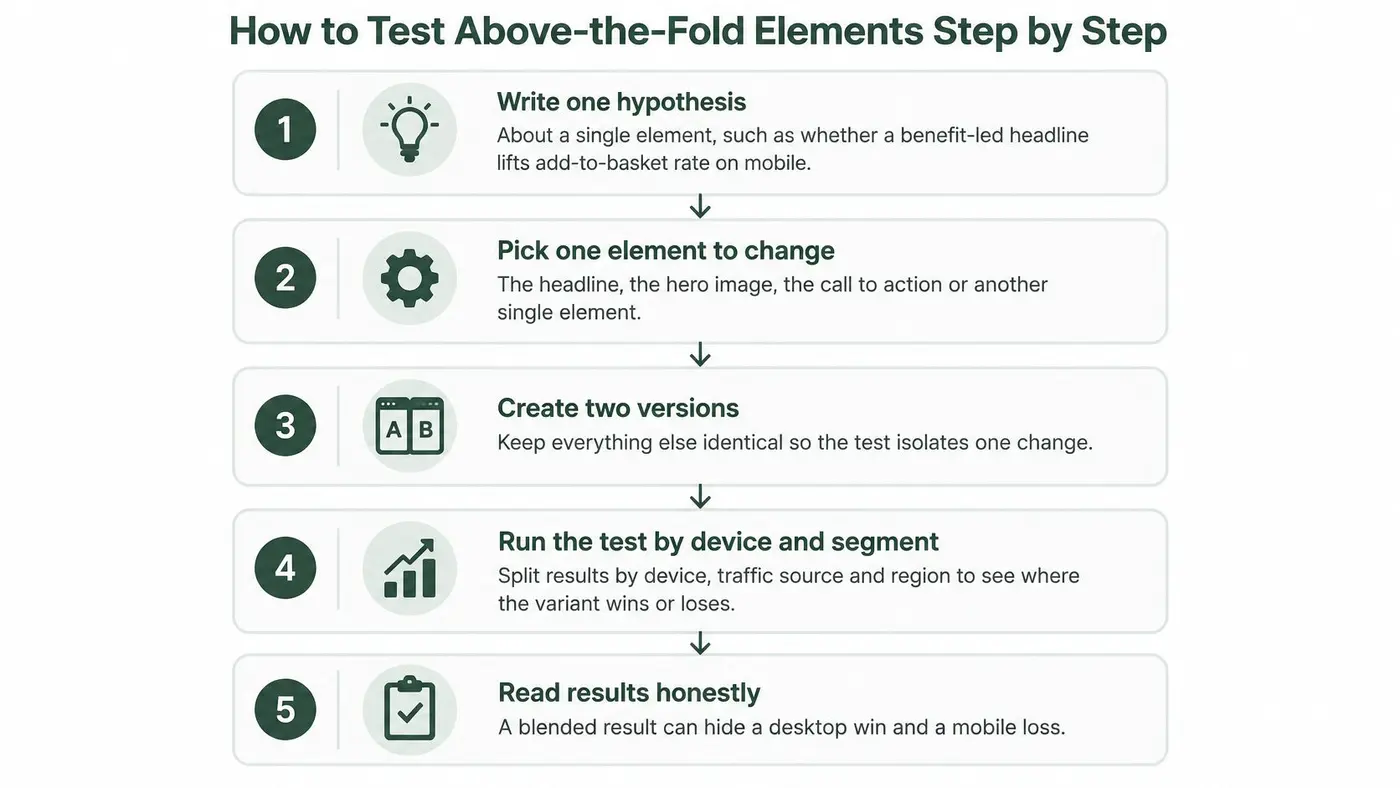
- Write one hypothesis about one element. Something like: a benefit-led headline will lift the add-to-basket rate on mobile, because the current headline names the product without saying what it does for the buyer. One element, one predicted outcome, one metric.
- Pick the element to change. Headline, hero image, call to action, or navigation density. Navigation density is the one teams skip and it's frequently the one costing most on a small screen.
- Build the variant and check it at both sizes. Load it in a phone-sized viewport and a desktop viewport, in a real browser rather than a device emulator, and look for wrapping headlines and pushed buttons.
- Split traffic evenly and set a goal tied to the page's purpose. An add-to-basket event or a purchase, not a click on the button itself.
- Track revenue per visitor and average order value beside clicks. A variant that lifts clicks and lowers purchases should be caught at this stage, not after a quarter of shipping it.
- Run to a stated confidence threshold. 95% is the default unless your team has set another, and it's worth writing down before launch. Stopping at the first promising lead is how noise gets shipped.
- Review by device before declaring a winner. The overall number can hide a win in one context and a loss in another.
The Common Slip
Changing three elements at once makes the result unreadable. You'll know the combination beat the control and nothing about which part did the work, so the next page starts from zero again.
Before you write the hypothesis, look at where the current first screen loses people. Heat maps and scroll maps show how far visitors get and what they press, which turns a guess into a specific claim about one element. Snippet-based testing works with any website, CMS or framework and requires no build step, so the page you already have is the page you can test.
Reading Test Results by Device and Segment
Say a headline test finishes with a clear lift in add-to-basket clicks. The number looks clean until you split it and find a desktop gain covering a mobile loss, because the longer headline wrapped onto three lines on a phone and pushed the button past the fold. Nothing about the aggregate number prepared you for that.

Split results by device, traffic source and region, and look at each segment on its own rather than assuming the average holds. Mobile network conditions vary by nation, so a test that reads as a flat win in blended UK data can be a different story in one part of the country. Segment before you generalise.
Three Checks Before You Call a Winner
- The lift holds on each device. If it only exists on desktop, you've tested a desktop change and learned nothing about the phone.
- Purchases and average order value move in the same direction as clicks. Clicks are a proxy for intent, not proof of it.
- Load time and layout stability haven't worsened. A variant that wins on conversion while adding half a second to the first screen is borrowing from next month's results.
Traffic share and revenue contribution are different numbers, and mixing them up produces confident wrong answers. A segment can supply half the visits and a fraction of the purchases, which means weighting the result by revenue rather than by sessions. Check the revenue dashboard per variant, not just the conversion rate at the top of the report.
When the Result Contradicts Itself
Picture a headline test that raises clicks to add-to-basket on mobile while revenue per visitor falls, because visitors click through and then abandon at checkout when the delivery promise doesn't match what the headline implied. The next test shouldn't be another headline. It should target the expectation the headline created, which is a checkout or delivery message problem wearing a copywriting costume.
A result is a decision about one page and one audience, not a general truth about pages.
Decide Which Fold to Test First
The fold is a device-dependent decision shaped by speed, hierarchy and purchase intent. That's the whole argument in one line, and it has a practical consequence: you can't fix all three at once on every page, so start where the money is.
Choose the page with the highest traffic and the clearest revenue goal. Audit its first mobile screen against the page-type table and find the single element standing between the visitor and the main action. On many stores that's the add-to-basket button sitting below a hero image that fills the viewport.
The Order of Work
- Confirm the page loads inside the good thresholds. Nothing tested above a four-second load means much.
- Test one element on mobile first. Headline or call to action, one hypothesis, one metric.
- Check desktop before scaling anything. A mobile win that costs desktop revenue isn't a win.
- Then extend to other page types. Same element, new template.
Set the test up with a single snippet, track revenue alongside clicks, and review by device. Anti-flicker matters more on the first screen than anywhere else, because that's where a jump is most visible: Otter A/B keeps the original page hidden until the variant is ready, with a three-second failsafe that shows the original if anything goes wrong, and setup is one line of code in the page head.
Pick one page this week, write one hypothesis for its first screen, and record the current mobile load time as your baseline before you change a word.
Above-the-fold testing only pays when you can see what each variant earned, not just which button got clicked. Otter A/B runs headline, image, CTA and layout variants on the page you already have, tracks purchases, average order value and revenue per variant, and reports significance at a 95% confidence threshold so you know when a winner is real. Install one line in your head section, set your goal, and let the first screen start earning its attention.
Stop guessing
Ready to start testing?
Set up your first A/B test in under five minutes. No credit card required.
- 14-day free trial
- No credit card required
- Cancel anytime