Attribution Modeling: Guide to Revenue Tracking 2026
Master attribution modeling to unlock marketing value. Learn common models, choose the right one, and track revenue effectively in 2026.
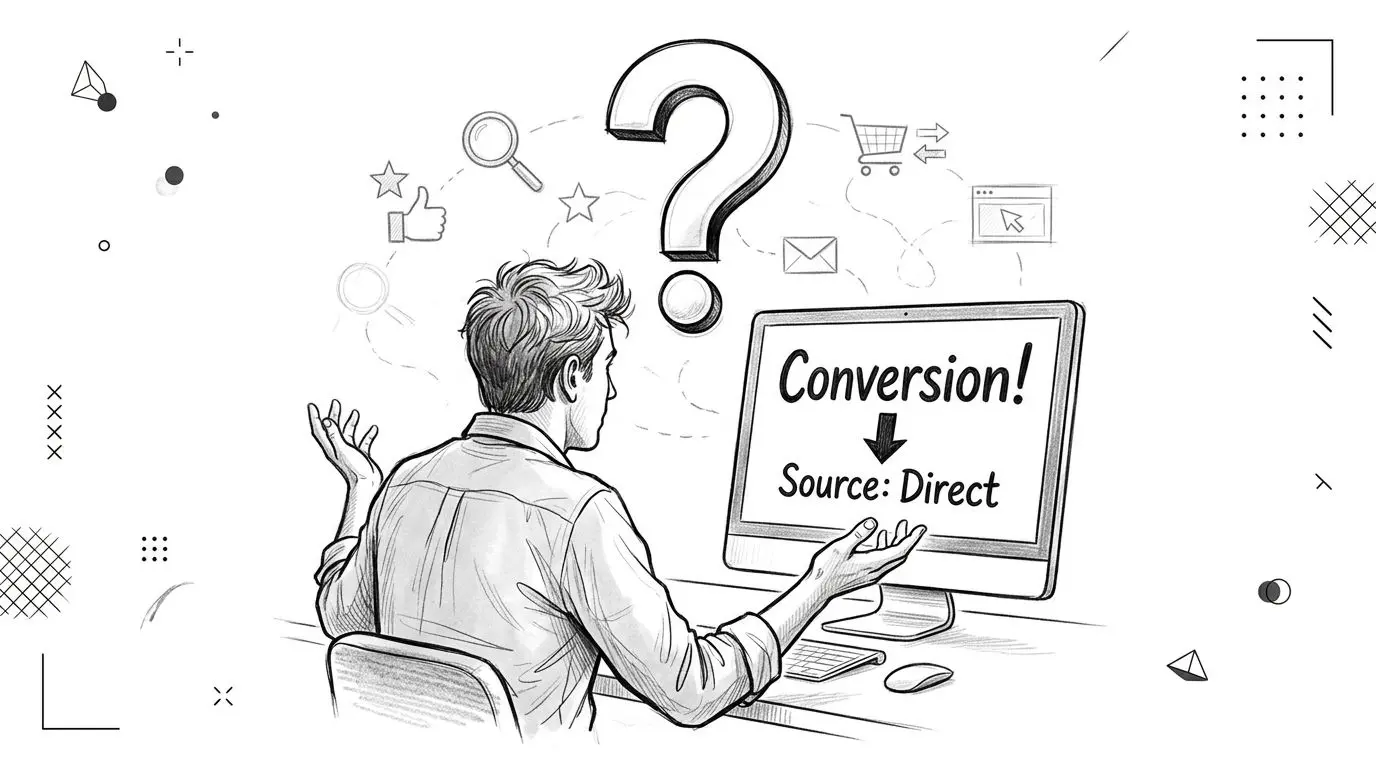
You open your analytics dashboard, see a sale come through, and the source says Direct. No campaign name. No clear path. No real answer to the question your team prioritizes: what caused this customer to buy?
That's the daily frustration behind attribution modeling. You're spending across paid search, social, email, content, affiliates, maybe even marketplaces or retail media. Buyers don't move in straight lines. They browse on mobile, return on desktop, click an email, ignore a retargeting ad, then type your brand into the browser and convert. If you only credit the final step, you aren't measuring marketing. You're measuring the last visible nudge.
Attribution modeling helps you rebuild that customer story. Done well, it helps growth teams decide where to invest, what to cut, and which journeys actually lead to revenue. Done poorly, it creates false certainty. That's why the most useful approach isn't just choosing a model. It's pairing that model with experimentation so you can separate correlation from actual business impact.
Why Your Last Click Is Lying to You
A last-click report is seductive because it looks clean. One conversion. One source. One answer.
The problem is that customers rarely behave that neatly.
Think about a football goal. The striker gets the headline, but the move may have started with a defender winning the ball, a midfielder breaking the press, and a winger delivering the pass. If you gave full credit only to the player who tapped it in, you'd misunderstand how the team creates chances. Last-click attribution does the same thing. It over-rewards the final touch and hides the contribution of earlier interactions.
That matters even more in a digital-heavy market. In the UK, the advertising market reached £38.1 billion, with digital making up 79.5% of total ad spend, according to IAB UK and PwC reporting referenced here. When that much budget flows through search, social, display, and retail media, single-touch reporting stops being a harmless simplification. It becomes a budgeting risk.
What attribution modeling actually does
Attribution modeling is the method you use to assign conversion credit across the touchpoints that happened before a sale or lead.
That sounds technical, but the business question is simple:
- Which channels introduce demand
- Which channels keep prospects engaged
- Which channels help close revenue
- Which channels only appear valuable because they show up late
A buyer might discover your brand through a social ad, read a comparison article a week later, click a remarketing ad, then return via branded search. Last click gives all the credit to search. Attribution modeling asks whether search closed the deal, or merely collected credit after other channels did the hard work.
Practical rule: If “Direct” and branded search keep winning in your reports, there's a good chance your measurement is rewarding the easiest touchpoint to see, not the touchpoint that created intent.
Why growth teams get stuck
The struggle isn't typically because attribution is impossible. Instead, it stems from dashboards often answering the wrong question.
A standard report tells you what happened last. A useful attribution system helps you decide what to do next. That means understanding journeys, not just endpoints. It also means accepting that attribution is a model of reality, not reality itself.
A Practical Guide to Common Attribution Models
Attribution models are just different ways of sharing credit. The right way to think about them is not “Which model is correct?” but “Which model best matches the buying behaviour we're trying to understand?”
Before modern path-based systems, marketers often used marketing mix modeling, or MMM, to estimate how marketing inputs affected sales at an aggregate level. Modern attribution evolved from that earlier measurement mindset. In a multi-channel market, path-level data and statistical modelling now work together to estimate contribution more precisely than a single observed touchpoint can, as described in this history of attribution and MMM.
The football assist analogy
If a customer journey is a goal, each attribution model answers a different question about who deserves applause.
- Last-click says the scorer gets everything.
- First-click says the player who started the move deserves everything.
- Linear says every player involved gets equal praise.
- Time decay says players closer to the final shot matter more.
- Position-based says the start and finish matter most.
- W-shaped gives extra weight to a few decisive moments in the move.
None of these are crazy. Each one reflects a different judgement about influence.
Rule-Based Attribution Model Comparison
| Model | How It Assigns Credit | Pros | Cons | Best For |
|---|---|---|---|---|
| Last-Click | Gives all credit to the final touchpoint before conversion | Simple, easy to explain, useful for close-stage optimisation | Ignores awareness and nurture activity | Short journeys, checkout optimisation, tactical reporting |
| First-Click | Gives all credit to the first known touchpoint | Highlights acquisition sources that create initial demand | Ignores everything that happened after discovery | Brand awareness analysis, top-of-funnel campaigns |
| Linear | Splits credit evenly across all touchpoints | Easy baseline for multi-touch reporting, recognises the full journey | Treats weak and strong touches as equally important | Teams that want a neutral starting point |
| Time Decay | Gives more credit to touches closer to conversion | Better fit for journeys where recent interactions matter | Can undervalue early education and brand discovery | Lead nurture, remarketing-heavy funnels |
| Position-Based or U-Shaped | Gives most credit to the first and last touch, spreads the rest across the middle | Balances discovery and conversion | Middle-funnel influence can get underweighted | Lead generation, balanced funnel analysis |
| W-Shaped | Gives extra credit to three key milestones, usually entry, lead qualification, and conversion | Useful when distinct journey stages matter | Harder to implement cleanly, especially with messy data | B2B funnels, longer buying cycles, marketing-sales handoffs |
How to read these models without getting lost
The mistake is to treat the model itself as insight. It isn't. The model is the lens.
A last-click view is good at answering, “What closed the sale?” A first-click view is better for, “What introduced the customer?” A linear model is often useful when your team needs a simple shared baseline before moving into more advanced analysis.
Use rule-based models when you need clarity fast. They're especially helpful when:
- Your tracking is still immature
- You need stakeholder buy-in before moving to more complex reporting
- You want to compare multiple perspectives on the same journey
- Your team needs a common language for assists versus closers
A healthy attribution setup often shows more than one model side by side. That's not confusion. It's context.
Where teams usually go wrong
They pick one model because the platform defaulted to it, then they organise spend around that view for months.
That's how support channels get overfunded, discovery channels get cut, and brand demand gradually weakens. Rule-based models are useful, but they rely on human assumptions about what “deserves” credit. Those assumptions can help. They can also mislead.
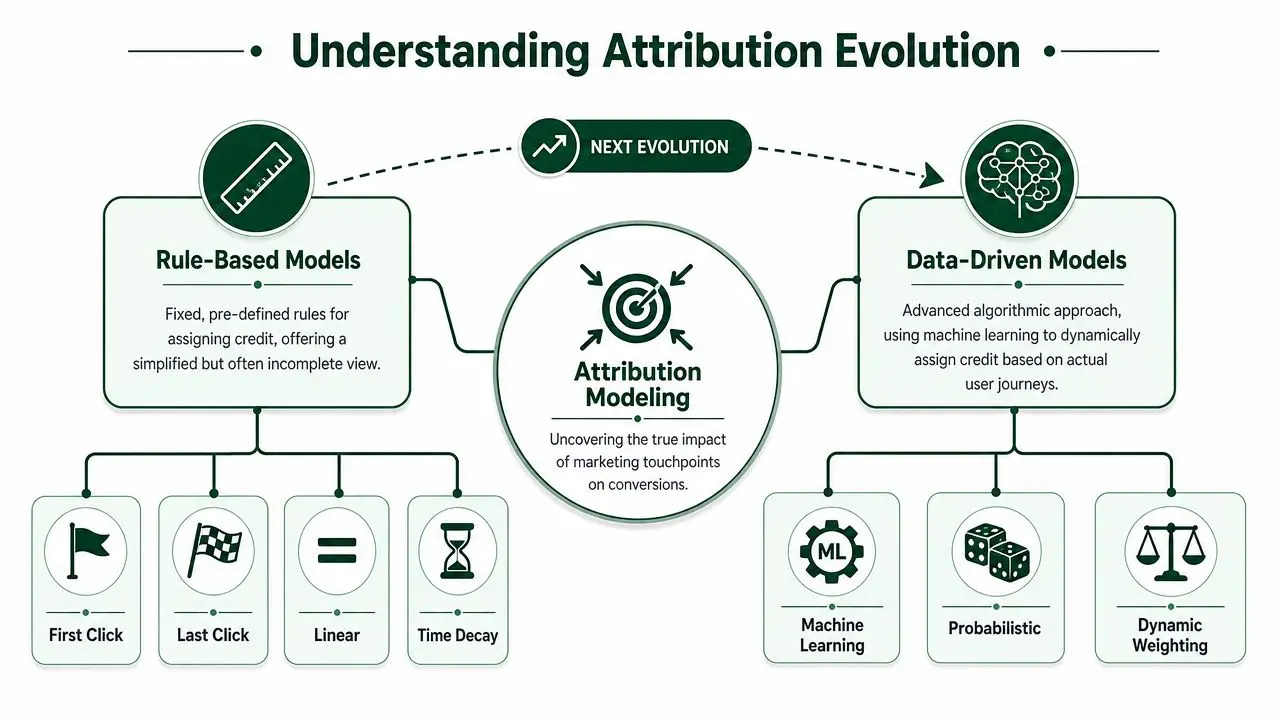
The Shift to Data-Driven Attribution
Rule-based models are a useful start, but they're still manual logic. You decide in advance how credit should be shared, then the model obeys.
Data-driven attribution tries to reverse that process. Instead of forcing the journey into a fixed template, it looks at patterns across many paths and estimates which touchpoints appear to matter more. In plain English, it asks: when this touchpoint is present, how does the conversion path change?
Why this shift matters now
Privacy changes have made clean, deterministic tracking harder. UK marketers are dealing with weaker signals, less complete user-level data, and more partially observed journeys. That's one reason simpler first-click and last-click models break down so easily.
According to Amplitude's discussion of attribution model frameworks, 61% of UK consumers are less likely to share personal data with brands than they were five years ago, and 55% would stop using a brand if they no longer trusted it to handle data responsibly. When fewer identifiers are available, brittle single-source models become less reliable. Modelled approaches that can reweight credit across observed touchpoints are more resilient.
What data-driven really means in practice
It doesn't mean magic. It means the system uses observed journey patterns rather than a fixed human rule like “give half the credit to the first click”.
That can lead to more realistic answers in journeys such as:
- Paid social creates discovery, but rarely gets the final click
- Email consistently revives high-intent users
- Brand search closes demand that other channels generated
- Content assists conversions even when it rarely appears last
If you're trying to connect ad platforms, site analytics, and downstream sales, Clickstera Solutions' attribution expertise offers a useful example of how full-funnel systems can be stitched together across otherwise disconnected channels.
Good data-driven attribution also depends on disciplined inputs. Consistent campaign naming, clean landing-page tags, and shared tracking standards matter more than is commonly understood. If your UTM structure is messy, start by standardising it with a UTM template generator from Otter A/B.
The important caveat
Data-driven attribution is usually better at estimating contribution. It still doesn't prove causality.
A touchpoint can appear frequently in converting paths without being the reason conversions happened. That's where testing comes in. If attribution modeling tells you where to look, experimentation tells you whether the effect is real.
Choosing the Right Attribution Model for Your Business
The right model depends less on industry labels and more on how your customers buy. A skincare brand, a SaaS platform, and a B2B consultancy can all use the same channels and still need very different attribution logic.
Start with three practical questions
How long is your buying cycle?
If people buy quickly, a simpler model can still be useful. If they compare, revisit, and involve multiple stakeholders, you'll need a multi-touch view.
How many meaningful touchpoints do you have?
A business running branded search and one email flow doesn't need the same setup as a team managing paid social, content, affiliates, webinars, outbound, and retargeting.
How much operational complexity can your team support? An elegant model with poor tagging and inconsistent CRM handoffs is worse than a simple model your team trusts.
A straightforward matching framework
| Business situation | Usually a sensible starting point | Why it fits |
|---|---|---|
| Fast-moving ecommerce with short journeys | Last-click plus a comparison view such as linear | You need speed and a quick read on closing channels, but a second model prevents over-crediting the final step |
| Content-led lead generation | First-click plus position-based | You want to see what creates interest and what eventually turns it into action |
| Multi-channel DTC brand | Linear, time decay, or data-driven | Journeys often include discovery, consideration, and return visits |
| B2B with long sales cycles | W-shaped or data-driven | Distinct milestones matter, especially when marketing and sales both influence the outcome |
What to choose when you're unsure
If your team is early in its measurement maturity, don't jump straight to the most complex model available. Start with one simple model and one comparison model. For many teams, that means using last-click for operational reporting and linear or position-based for strategic review.
Use that pairing to find disagreements. If branded search looks dominant in one view but much less important in another, that's not a reporting problem. It's a sign that the journey is more layered than your default dashboard suggests.
A second trap is choosing a model before fixing conversion bottlenecks. If your forms, landing pages, or lead capture process are weak, attribution reports won't save you. They'll just tell you which channels delivered users into a leaky funnel. For ideas on that side of the equation, this guide on how to improve lead capture with Orbit AI is a useful complement to attribution work.
Decision shortcut: Choose the simplest model that reflects your real buying journey, then challenge it with another model that sees the journey differently.
Signs you've outgrown your current model
- Your team keeps arguing about channel value
- Branded search and direct traffic absorb too much credit
- Upper-funnel campaigns look weak despite clear business relevance
- Stakeholders can't connect reports to actual budget decisions
When those symptoms appear, the answer usually isn't a prettier dashboard. It's a better attribution framework.
Validating Models with A/B Testing and Revenue Tracking
Attribution modeling can tell you that a channel or touchpoint appears valuable. It can't, by itself, prove that removing or changing that touchpoint would change revenue.
That distinction matters. Correlation is not causation. A channel may show up before conversions because it's persuasive, or because high-intent users naturally pass through it on the way to purchase.
That's why advanced measurement pairs attribution with incrementality testing. Independent guidance on marketing attribution models and incrementality explicitly recommends validating modelled credit with controlled tests, especially as privacy-related signal loss makes measurement less complete.
Attribution gives you the hypothesis
Suppose your model shows that blog content appears often in converting journeys, even though it rarely gets the last click.
That insight is useful, but it's still a hypothesis: “Content assists revenue.” To validate it, you need an experiment that changes something meaningful and measures the commercial outcome.
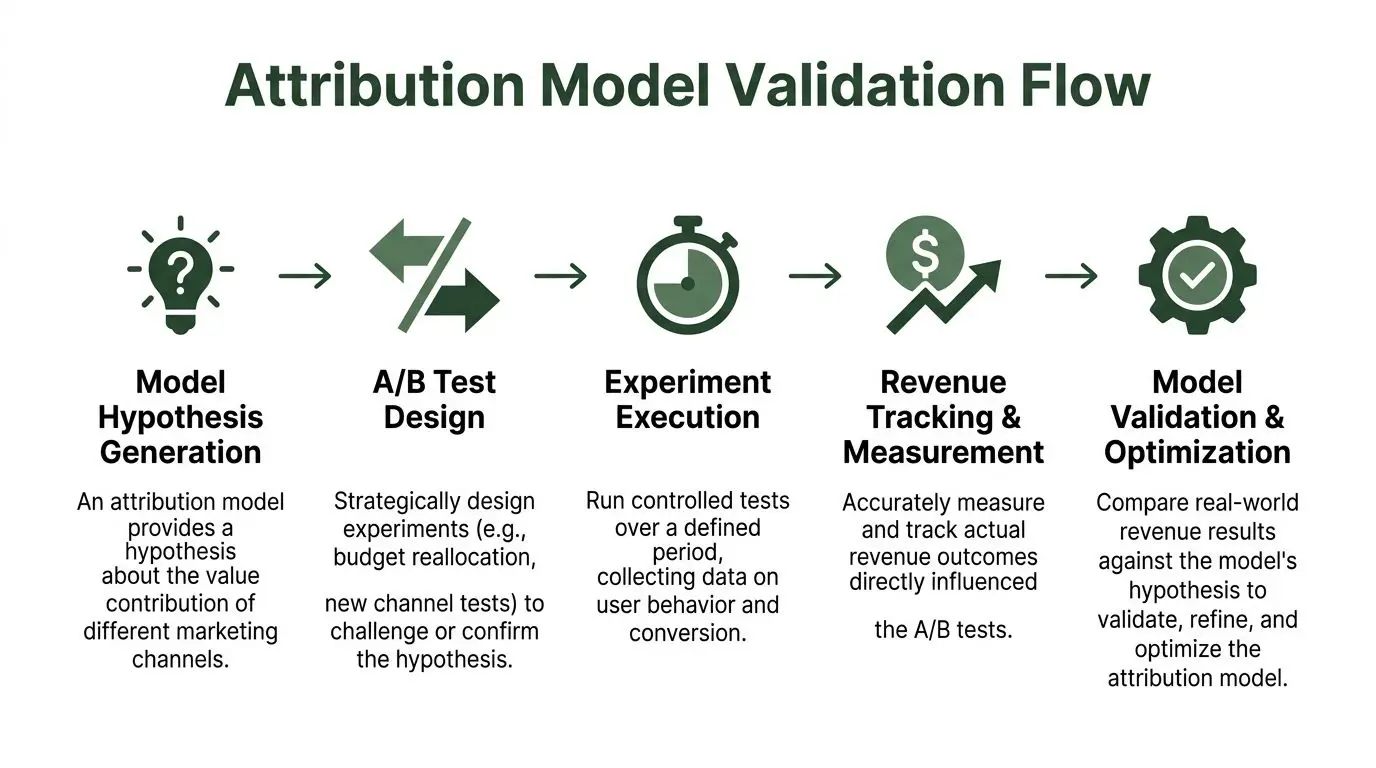
A simple validation workflow
-
Pick an attribution insight
Example: product comparison articles often appear mid-journey before purchase. -
Turn it into a testable hypothesis
“If we add a stronger product CTA and a clearer next step on high-intent blog pages, more visitors will move into revenue-generating paths.” -
Define the commercial metric before launch
Don't stop at click-through rate. Use revenue-linked outcomes where possible. -
Run a controlled experiment
Split traffic between the current page and the revised version. Keep the change focused so the result is interpretable. -
Compare the test result to the attribution story
If the variant lifts downstream revenue, your model likely surfaced a genuine assist channel. If not, the model may have mistaken correlation for influence.
What incrementality testing looks like in practice
You don't always need a giant geo test or a platform-level budget holdout. For many web teams, a well-designed page or funnel experiment is enough to validate whether a credited touchpoint moves buyers forward.
Useful test designs include:
- Content holdouts where some visitors see a stronger commercial path and others see the existing experience
- Channel message tests that change the offer or landing page for traffic from a credited source
- Audience holdouts where one comparable group doesn't receive a campaign and you compare downstream behaviour
If you need cleaner measurement setup before running those experiments, this guide to conversion tracking with Google Analytics helps tighten the link between on-site behaviour and business outcomes.
Don't ask attribution to do testing's job. Use attribution to decide what deserves a test.
How to interpret conflicts
Sometimes the model says a channel matters, but the test says the change had little effect. Don't ignore that tension. It's often where true insight sits.
Possible explanations include:
- The channel is present, but not persuasive
- The model is picking up intent, not influence
- The experiment changed the wrong element
- The channel matters only in combination with another touchpoint
When attribution and experimentation disagree, trust the controlled test more for causal decisions. Then refine the model, the tagging, or the hypothesis.
Building a Modern Attribution Reporting Dashboard
A good attribution dashboard doesn't just distribute credit. It helps your team make decisions about spend, messaging, and customer acquisition.
The quickest way to ruin one is to turn it into a dense wall of channel metrics that only analysts can interpret. Stakeholders need a dashboard that answers practical questions: which channels introduce customers, which channels close them, where journeys get longer, and where revenue concentration creates risk.
What belongs on the dashboard
A useful attribution dashboard usually includes these views:
- Model comparison by channel so teams can see how last-click, linear, or data-driven views value the same traffic differently
- Top conversion paths to reveal common journeys rather than isolated events
- Path length trends to show whether buyers are converting quickly or needing more touches
- Attributed CPA or efficiency views so channel credit connects back to acquisition economics
- New customer versus returning customer splits because the same channel can play very different roles across those groups
What the dashboard should help you decide
It should support choices such as:
| Question | Dashboard view that helps answer it |
|---|---|
| Should we cut or protect upper-funnel spend? | Compare last-click with a multi-touch model and review assisted paths |
| Are we overvaluing branded search? | Review paths where search appears late versus paths where it initiates demand |
| Which channels shorten time to purchase? | Look at path length and sequence patterns |
| Where should we test next? | Find pages or channels with high assist value but weak direct credit |
This short walkthrough is worth watching if your team wants a more visual sense of how attribution reporting can be interpreted in practice:
Keep the dashboard tied to money
A dashboard becomes strategically useful when it links attribution to revenue, not just conversions. If a channel creates lots of low-value actions but little commercial return, the report should make that visible.
For planning conversations, a revenue impact calculator from Otter A/B can help teams estimate how conversion changes affect revenue before they commit to design or budget changes.
The best attribution dashboard doesn't end arguments because it looks sophisticated. It ends arguments because everyone can see the trade-offs.
Attribution Best Practices and Common Pitfalls
Attribution modeling works best when teams treat it as a decision system, not a trophy dashboard. The point isn't to produce a perfect answer. It's to improve how you allocate budget, prioritise experiments, and explain revenue movement.
Best practices worth keeping
- Start simple: A clean last-click or linear baseline is often more useful than a complex model built on messy tags and inconsistent goals.
- Compare perspectives: Keep at least one alternative model in view so your team can spot where channel value changes dramatically.
- Use a shared source of truth: Marketing, product, ecommerce, and finance need aligned conversion definitions, or the same customer journey will produce conflicting stories.
- Audit tracking hygiene: Broken UTMs, duplicate conversions, and missing campaign names create bad attribution long before the model enters the picture.
- Validate with experiments: Use incrementality tests, page tests, and holdouts to check whether modelled credit matches real commercial effect.
Common mistakes that distort reporting
Some mistakes are technical. Others are psychological.
- Confirmation bias: Teams often favour the model that flatters their preferred channel.
- Ignoring untracked influence: Offline conversations, word of mouth, marketplaces, and dark social can still shape demand even when the clickstream can't see them.
- Treating assisted channels as weak channels: A touchpoint can matter a lot even if it rarely closes.
- Overreacting to one report: Attribution should guide patterns and decisions over time, not trigger constant budget swings from a single dashboard snapshot.
A practical checklist
Before trusting any attribution output, ask:
- Are conversions defined consistently across tools?
- Can we explain our model in plain language to non-analysts?
- Have we compared at least two models on the same journey data?
- Do we know which channels are being over-credited by proximity to the sale?
- Have we run a test to validate a major attribution insight?
If the answer to the last question is no, you're still looking at a smart estimate, not a proven growth lever.
Attribution modeling becomes much more valuable when it earns its place in your process. Model the journey. Form a hypothesis. Run the test. Measure revenue. Then update the model with what you learned.
If you want to turn attribution insights into measurable experiments, Otter A/B gives teams a lightweight way to test headlines, CTAs, layouts, and funnel changes against real business metrics like purchases, average order value, and revenue per variant. It's a practical fit for marketers and CRO teams who don't just want to assign credit, but want to prove which changes grow revenue.
Ready to start testing?
Set up your first A/B test in under 5 minutes. No credit card required.