E-commerce Conversion Rate Optimization Playbook
Boost sales with this e-commerce conversion rate optimization playbook. Learn to set goals, run A/B tests, measure revenue, & scale your 2026 CRO strategy.

You’re probably looking at a familiar dashboard right now. Traffic is holding. Paid campaigns are still delivering visits. Your best-selling product gets plenty of attention, gets added to baskets, and still doesn’t produce the sales curve you expected.
That gap is where e-commerce conversion rate optimization earns its keep.
This isn’t about random button colour tests or a last-minute checkout redesign because someone senior had a gut feeling. Good CRO is disciplined. You study where intent weakens, where friction appears, and which changes improve business outcomes, not just surface metrics.
Why Your Best-Selling Product Isn't Selling More
A store can have a product everyone seems to want and still underperform commercially. The pattern is common. Shoppers click through from ads or search, browse product imagery, maybe even add to basket, then stall. Teams often respond by pushing harder on acquisition, when the actual problem sits inside the experience.
In the UK, that matters even more because the benchmark isn’t abstract. UK e-commerce businesses achieved an average conversion rate of 2.8% in 2025, trailing the Americas’ 3.14% benchmark, according to Smart Insights. That doesn’t mean every store should chase one magic number. It means many teams have room to improve the value they get from existing traffic.
The mistake is treating conversion as one moment. It’s a sequence. Product discovery, trust, clarity, mobile usability, basket friction, checkout confidence. If one link in that chain breaks, the product doesn’t need to be weak for sales to flatten.
What teams usually miss
The best-selling item often hides the problem because demand creates false confidence. Teams assume, “The product is proven, so the page must be fine.” Usually it isn’t.
Common issues show up in places like these:
- Message mismatch: The ad or email promises one thing, but the landing page opens with generic copy.
- Mobile friction: The product page looks acceptable on desktop but feels cramped or awkward on a phone.
- Decision anxiety: Delivery details, returns, sizing, or payment options appear too late.
- Checkout leakage: A strong add-to-basket rate masks what happens after intent is already there.
If your store has that pattern, it helps to map the journey before changing the interface. A practical starting point is reviewing real customer journey map examples so your team can see where motivation drops between first click and completed order.
Most stores don’t have a traffic problem first. They have a friction problem first.
That’s also why basket abandonment deserves direct attention instead of being treated as background noise. If you need a practical checklist, this resource on how to reduce shopping cart abandonment is useful because it focuses on the experience gaps that block purchase intent after shoppers are already interested.
CRO works when you stop asking, “How do we get more visitors?” and start asking, “Why aren’t more of our existing visitors buying?”
Laying the Groundwork for Meaningful Optimisation
Before running a single test, get your measurement model right. Many e-commerce teams say they care about conversion rate, but they need a clearer answer to a different question. Which changes improve revenue quality, not just order count?
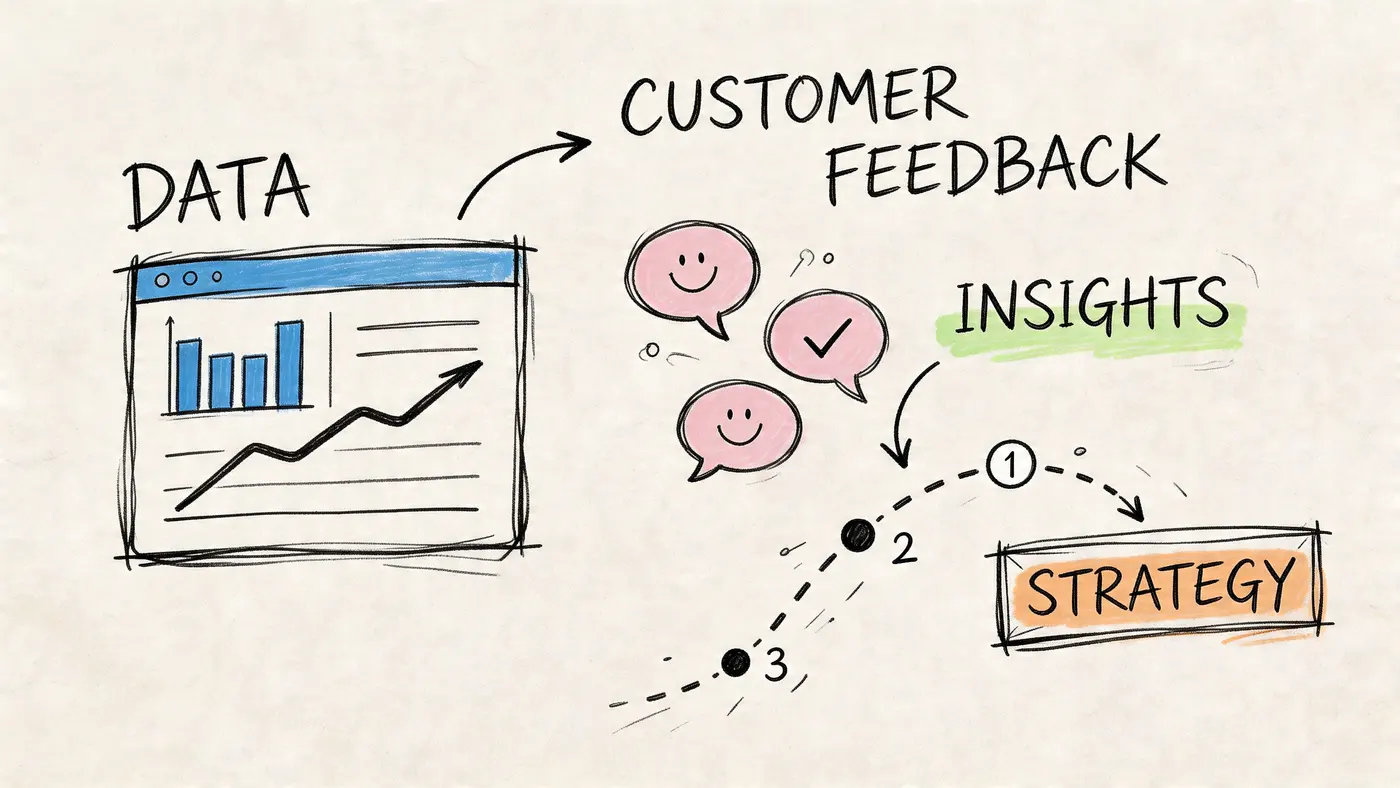
A store can raise conversion and still hurt the business if orders get smaller, margins shrink, or high-intent shoppers are distracted by a weak offer. That’s why the groundwork matters more than many teams expect.
Choose KPIs that reflect commercial reality
Start with the numbers your finance lead would care about, not just the metrics your analytics tool highlights by default.
A sensible starting set usually includes:
- Conversion rate: Useful, but never enough on its own.
- Average order value: Essential when testing bundles, thresholds, upsells, and pricing presentation.
- Revenue per visitor: Better than conversion rate for comparing variants with different order economics.
- Revenue by device type: Especially important when your mobile experience behaves differently from desktop.
- Checkout step completion: Helpful for diagnosing where purchase intent breaks down.
If your team needs a tighter framework for measurement, this guide on how KPIs are measured is worth using as a planning reference before you build a test backlog.
Use behaviour data before opinion
Analytics platforms show you where people leave. They rarely explain why.
That’s why the pre-test workflow should combine several inputs:
- Funnel reports to identify the biggest drop-off points.
- Heatmaps to see where attention clusters or misses the intended action.
- Session recordings to review hesitation, repeated clicks, and backtracking.
- Customer support logs to surface recurring objections.
- On-site survey responses where appropriate, especially around checkout or policy questions.
You don’t need a massive research sprint. You need enough evidence to separate real friction from internal guesswork.
Practical rule: If three different signals point to the same issue, it’s ready for a hypothesis.
For example, if analytics show a drop at shipping selection, recordings show users pausing there, and support receives repeated delivery-cost questions, that’s not anecdotal noise. That’s a test candidate.
Build privacy into the process
UK teams can’t treat compliance as a legal note tucked away in the footer. It affects how you run experiments, collect consent, and personalise experiences.
According to Fermat, 68% of consumers abandon carts due to privacy concerns, yet only 12% of CRO guides mention GDPR-compliant testing methods such as anonymised traffic splitting and consent-based personalisation. That gap is bigger than most experimentation programmes admit.
In practice, that means:
- Don’t personalise by default: Use consent-aware rules.
- Minimise identifiable data: If a test doesn’t need personal data, don’t route it through personal data.
- Coordinate with legal and engineering early: Fixing compliance after launch slows testing velocity.
- Document what a test changes and what data it uses: This becomes important the moment questions arise internally.
Privacy-first testing often improves trust because it reduces the sense that the store is overreaching. In the UK market, that’s not a side benefit. It’s conversion work.
Audit basket abandonment before redesigning pages
Many teams over-invest in homepage or product page tweaks while ignoring the moments closest to revenue. That’s backwards. If shoppers are leaving late in the funnel, the fastest gains often come from checkout trust, clarity, and convenience.
A practical companion resource is this guide to reduce shopping cart abandonment, which helps teams audit the basket and checkout stages before they start redesigning upstream pages that may not be the actual issue.
A strong optimisation programme starts with discipline. Define the right outcomes, inspect real behaviour, and make sure the way you test fits the market you sell into.
Generating and Prioritising High-Impact Test Hypotheses
Bad test ideas waste more time than bad test execution. Most failed experimentation programmes don’t collapse because the tooling is weak. They collapse because the team keeps testing whatever is easiest to change instead of what’s most likely to move the business.
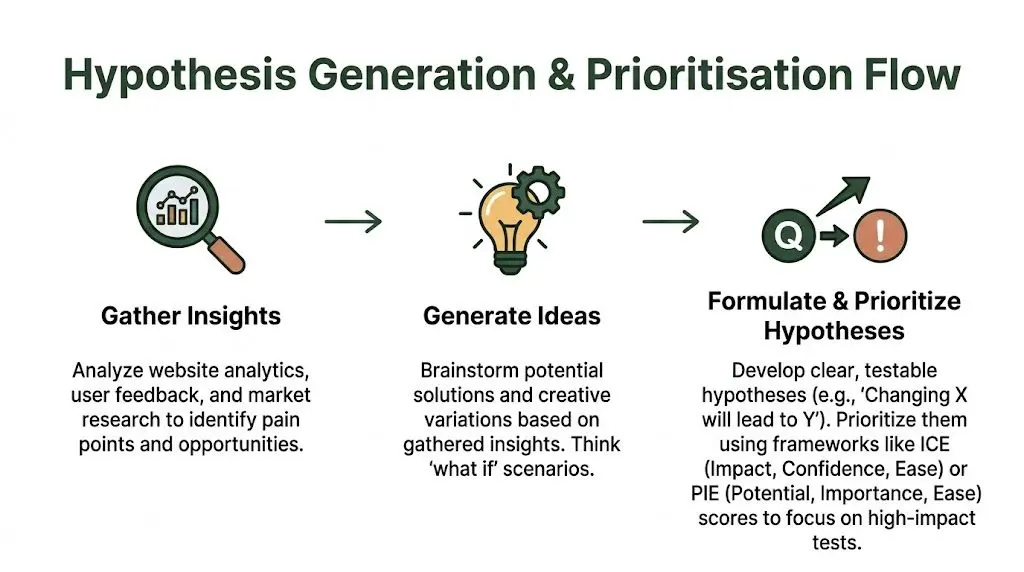
The difference between random testing and useful testing is the quality of the hypothesis.
Write hypotheses that can survive scrutiny
A workable hypothesis has three parts:
- The change
- The expected effect
- The reason
That structure sounds simple because it is. It forces the team to be explicit.
Examples:
- If we show delivery costs earlier on the product page, more shoppers will continue to checkout because price uncertainty drops before basket review.
- If we reduce the number of required checkout fields, more shoppers will complete purchase because the process feels faster and less intrusive.
- If we move bundle options closer to the primary purchase decision, average order value will improve because the add-on appears at the point of highest intent.
Notice what’s missing. No vague language about “improving engagement”. No detached design preferences. No “modernising the page”.
Use checkout as your first proving ground
Checkout is a strong place to start because it sits close to revenue and often contains obvious friction. According to Invesp, complex checkout processes could result in losing approximately 68% of potential customers. Their guidance points directly at practical fixes such as reducing form fields, enabling guest checkout, and showing costs upfront.
That one fact should reshape how teams prioritise ideas. A homepage banner test might be easy to launch, but a checkout simplification test is often more valuable.
Here’s how a team can turn one problem into multiple hypotheses.
| Friction observed | Hypothesis | Likely primary metric |
|---|---|---|
| Shoppers stop when account creation appears | Enabling guest checkout will increase completed purchases because it removes commitment before trust is established | Purchase completion |
| Users pause when shipping appears late | Surfacing shipping costs earlier will improve checkout completion because total cost becomes clearer sooner | Checkout completion |
| Mobile users struggle with long forms | Reducing required fields on mobile will improve purchase completion because form effort drops | Mobile purchase completion |
| Basket review page creates uncertainty | Adding clearer payment and delivery reassurance will improve progression because trust signals appear before final payment | Step progression |
Prioritise by commercial impact, not internal excitement
Once ideas start flowing, the list gets long fast. That’s where a framework helps. PIE works well because it forces trade-offs:
- Potential: If this wins, how much upside is there?
- Importance: How much traffic or revenue flows through this area?
- Ease: How hard is it to design, build, approve, and measure?
A product image tweak may score high on ease but low on importance. A checkout field reduction may require more operational work but score much higher on potential and importance.
Teams get better results when they treat prioritisation as a revenue decision, not a design queue.
A simple way to score your backlog
Use a working table like this during planning:
| Test idea | Potential | Importance | Ease | Priority decision |
|---|---|---|---|---|
| Add size guide near CTA | Medium | Medium | High | Useful, but not first |
| Show delivery costs before basket | High | High | Medium | Test early |
| Simplify account creation prompt | High | High | Medium | Test early |
| Change homepage hero image | Low | Medium | High | Lower priority |
| Reorder bundle offers on PDP | High | Medium | Medium | Strong candidate |
The exact labels matter less than the discipline behind them. The scoring conversation exposes hidden assumptions. It also stops the loudest voice in the room from dictating the roadmap.
Pull ideas from multiple sources
The strongest hypotheses usually come from overlap, not from a single dataset.
Good sources include:
- Analytics: Funnel exits, low progression points, weak mobile performance
- Qualitative review: Recordings, support tickets, survey comments
- Commercial context: Margin sensitivity, stock availability, category behaviour
- Acquisition data: Message mismatch between ads, email, and landing pages
When all four point in the same direction, the odds of a meaningful test improve.
A strong hypothesis backlog feels less creative than many teams expect. That’s a good sign. CRO isn’t advertising brainstorming. It’s operational problem-solving with evidence attached.
Designing and Running Your A/B Tests with Otter A/B
Once a hypothesis is solid, execution needs to be boring in the best possible way. Clean setup, clear goals, reliable traffic allocation, and enough patience to let the data settle. Most test programmes go wrong because teams rush one of those four.
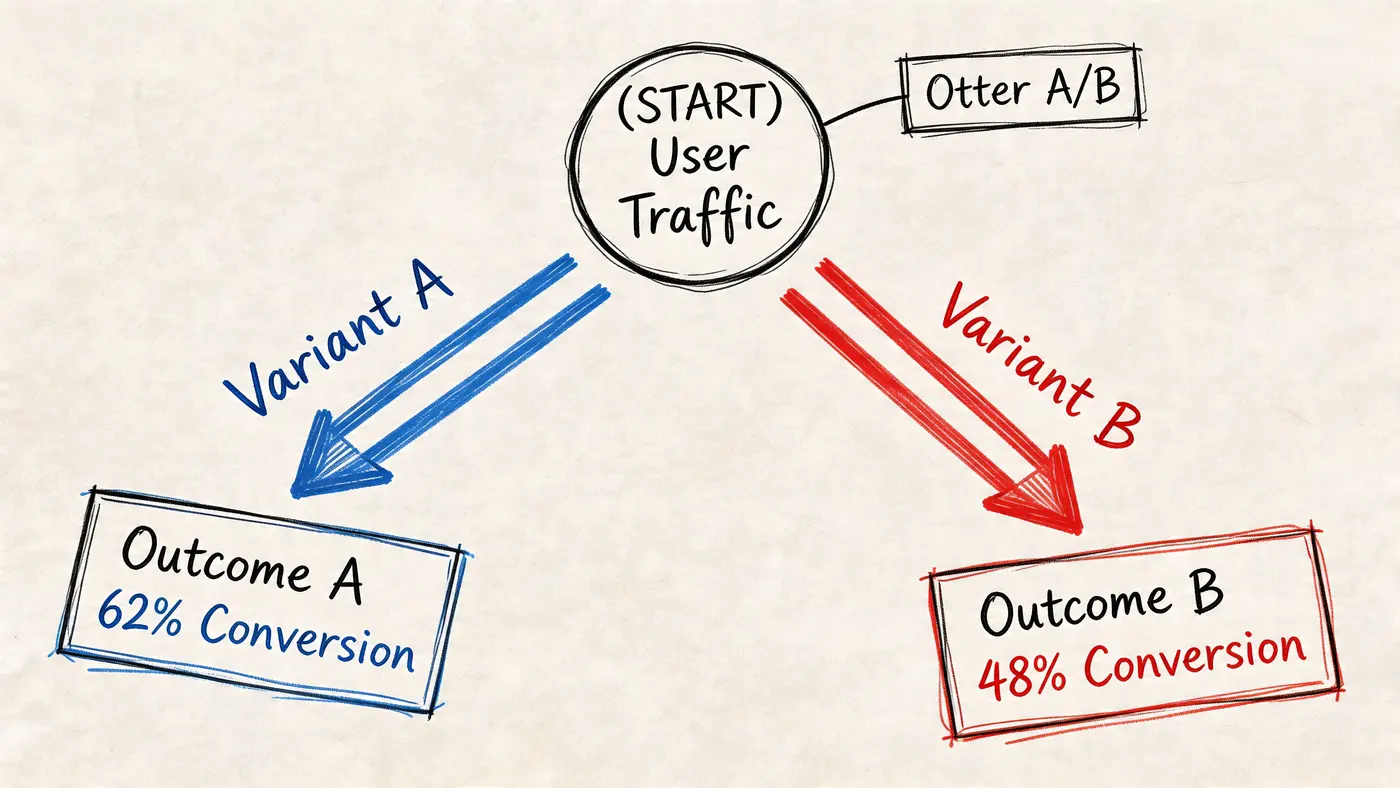
If you’re running your first serious experimentation cycle, keep the build simple. Don’t start with five-page funnel changes, overlapping audience rules, or multiple competing goals. Start with one high-value hypothesis and one clear success metric.
Set up the test environment properly
For a lightweight platform, implementation is usually straightforward. The first decision is where the script should be deployed. A common approach is to choose a direct site snippet or route it through Google Tag Manager, depending on how their site is managed.
The setup checklist is short, but each step matters:
-
Install the platform correctly Add the snippet once and verify that it loads on the intended pages only.
-
Confirm the test page scope Restrict the experiment to the exact template, route, or URL pattern you want to influence.
-
Check mobile and desktop rendering A variant that looks clean on desktop can still break spacing, hierarchy, or tap behaviour on mobile.
-
Review analytics alignment Make sure purchase and revenue events are already recorded correctly before traffic enters the test.
If your team wants the technical overview first, review how Otter A/B works before building your first experiment.
Define one primary goal and a few guardrails
A strong test has one primary metric. Everything else is context.
For an e-commerce test, the primary goal is often one of these:
- completed purchases
- checkout completion
- add-to-basket rate
- revenue per visitor
- average order value
Secondary metrics matter too, but use them as guardrails. For example, if a variant improves conversion but lowers order quality, that should show up in the supporting metrics rather than muddying the primary read.
A clean setup might look like this:
| Test type | Primary goal | Secondary checks |
|---|---|---|
| Product page CTA test | Add to basket | Revenue per visitor, mobile engagement |
| Basket reassurance test | Checkout progression | Purchase completion |
| Checkout simplification test | Completed purchase | Device split, order quality |
| Bundle placement test | Average order value | Purchase completion, revenue trend |
Build variants that isolate the change
A common mistake is changing too much at once. If the hypothesis is about delivery cost transparency, don’t also redesign the layout, swap product imagery, and rewrite trust copy in the same variant. You’ll lose interpretability.
Keep the difference narrow enough that you can answer a simple question after launch: did this specific change help?
That usually means:
- one message change
- one layout adjustment
- one friction reduction
- one offer presentation change
When the variant wins, you’ll know why. When it loses, you’ll know what to rule out.
Field note: The fastest way to confuse a test result is to pack several strategic ideas into one variant and call it a single experiment.
Split traffic deliberately
Traffic allocation isn’t just a technical setting. It affects speed, risk, and business exposure.
For a first test, an even split is usually sensible because it gives you a cleaner comparison. If the page is mission-critical and the change is risky, teams sometimes prefer a lower initial allocation while they verify the experience is stable. What matters is that the split is intentional and documented.
Before launch, run a pre-flight review:
- Does the control still represent the current baseline?
- Does the variant render consistently across devices and browsers?
- Are event triggers firing in both experiences?
- Are consent and privacy rules respected in both paths?
Don’t call a winner too early
This is one of the most expensive mistakes in e-commerce conversion rate optimization. Early numbers are seductive. A variant can look strong for a short period because of normal traffic variation, campaign mix, weekday behaviour, or a temporary spike in one audience segment.
Shopify’s guidance is clear on this point. A/B testing requires sufficiently large sample sizes to ensure results are generalisable. They also note that inadequate sample sizes are one of the most common CRO mistakes because they lead to false positives and wasted effort.
That means you need two things:
- Enough users in the test
- Enough time for behaviour patterns to normalise
You’re not trying to get an exciting result. You’re trying to get a trustworthy one.
Watch a walkthrough before your first launch
If your team is new to execution, a short visual walkthrough often prevents avoidable setup mistakes better than another checklist does.
Launch with a monitoring routine
The day a test goes live isn’t the day to disappear. Someone should monitor:
- rendering issues
- broken UI states
- event tracking
- unusual shifts in conversion or basket behaviour
- support complaints tied to the changed experience
This isn’t about peeking at significance every hour. It’s about making sure the experiment is functioning as designed.
Keep the first cycle operationally simple
For your first major cycle, pick one of these categories:
- Checkout simplification
- Shipping cost visibility
- Guest checkout access
- Bundle or quantity offer placement
- Mobile-specific CTA clarity
Those tests teach the team something commercially meaningful even when they lose. That matters. A failed test on a revenue-relevant page is still useful. A successful test on a trivial element often isn’t.
Execution quality gives the result credibility. Without that, the experiment is just a dressed-up opinion.
Measuring Business Impact Beyond Conversion Rate
A variant can “win” in the interface and still lose in the business. That’s why post-test analysis has to move beyond the top-line conversion number.
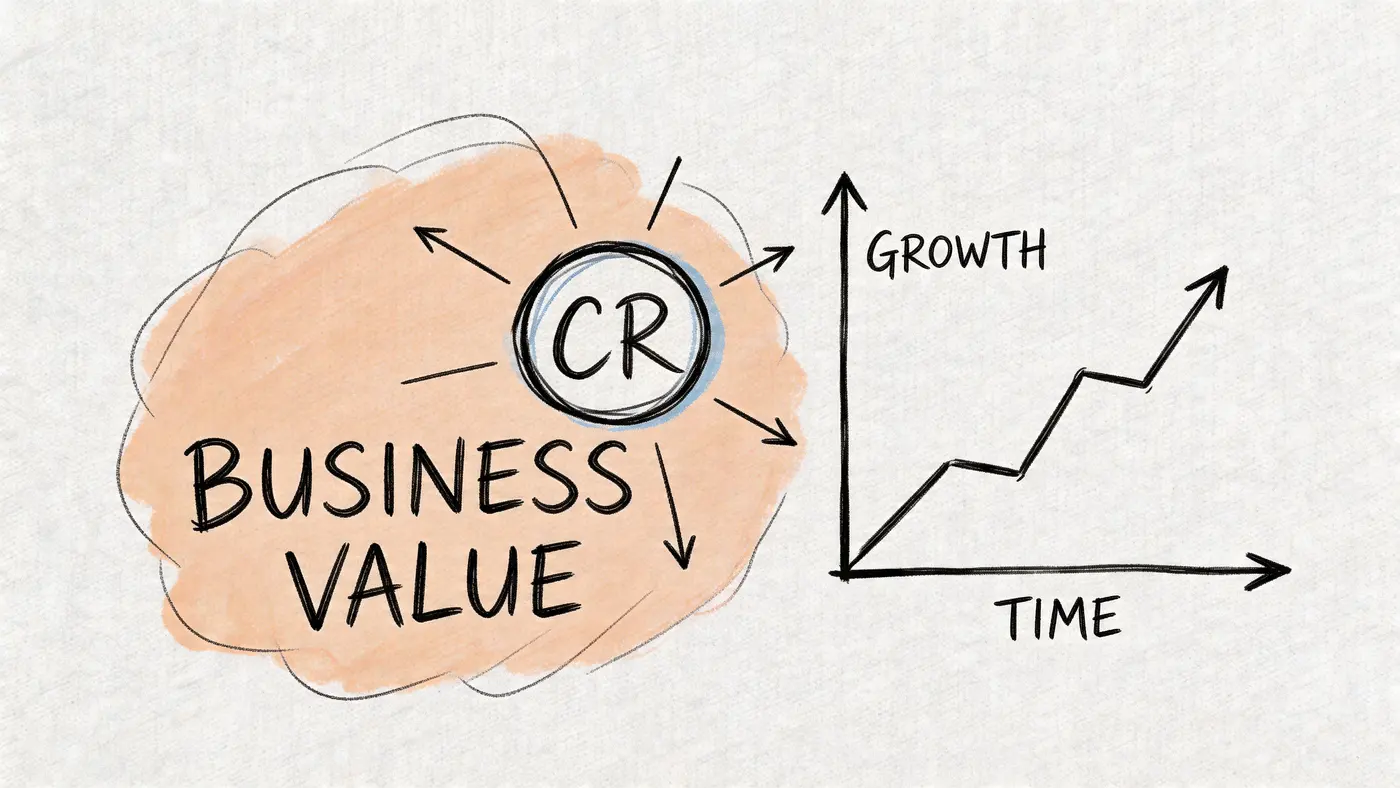
Many teams stop too early. They see more clicks, more checkouts, or a lift in orders and push the variant live. Then later they realise the average basket got smaller, a higher-value segment performed worse, or the result never improved revenue the way they assumed it would.
Read the result like an operator, not a spectator
Statistical significance matters because it tells you whether the observed difference is likely to reflect a real effect rather than noise. In many testing environments, the working threshold is 95% confidence, and that’s useful because it gives the team a consistent standard for decision-making.
But significance alone isn’t the finish line.
Ask these questions after every test:
- Did the variant improve completed purchases?
- Did order value hold, improve, or decline?
- Did revenue per variant improve?
- Was the result consistent across mobile and desktop?
- Did one customer segment drive the gain while another weakened?
A good result answers the first question. A deployable result answers all of them.
Revenue per variant is the metric that changes behaviour
When teams only track conversion rate, they start favouring tests that create shallow wins. Softer offers, heavier discount visibility, and lower-friction purchases can all increase order count while reducing commercial quality.
Revenue per variant forces better discipline. It shows whether the users exposed to one experience generated more business value than users exposed to another. That’s a much harder metric to game.
Consider bundle testing. According to SamCart, UK Shopify stores lose 28% of potential revenue from untested bundling. The same source says micro-A/B tests focused on quantity discounts or product bundles can lift Average Order Value by 18% without eroding margins.
That’s a useful reminder that the best optimisation opportunity isn’t always “make more people convert”. Sometimes it’s “help buyers build a better basket”.
The mature CRO question isn’t “Which variant got more orders?” It’s “Which variant produced healthier revenue?”
Look at tests through three commercial lenses
Conversion quality
A variant that drives weaker orders may still look healthy in a simple dashboard. Review what kind of transaction it created, not just whether a transaction happened.
Average order value
AOV matters most when the test touches:
- bundles
- quantity incentives
- free shipping thresholds
- upsells
- cross-sells
- pricing presentation
When a test changes the shape of the basket, AOV belongs in the main decision discussion, not buried in a supporting tab.
Revenue trend over time
Short-term wins sometimes flatten after rollout. Review the trend after implementation, especially if traffic mix shifts by channel or device. You want to know whether the variant stays commercially useful once novelty disappears and campaign patterns change.
A simple post-test review format
Use a summary table like this after every experiment:
| Question | What to review | Decision risk if ignored |
|---|---|---|
| Did conversion improve? | Completed purchase or target action | You may deploy a non-winner |
| Did AOV change? | Basket value by variant | You may trade orders for smaller baskets |
| Did revenue per visitor improve? | Revenue divided by exposed traffic | You may overstate business impact |
| Did mobile behave differently? | Device-segmented performance | You may hurt your dominant traffic experience |
| Should this roll out fully? | Combined commercial read | You may scale a partial win |
Distinguish learning from rollout
Not every test needs immediate deployment. Some should trigger a follow-up experiment instead.
Examples:
- A bundle test lifts AOV but weakens conversion. You may need a softer presentation test next.
- A checkout variant helps mobile users but does little for desktop. That may justify device-specific treatment.
- A product page test improves add-to-basket but has no meaningful revenue impact. Useful learning, but not necessarily a full rollout.
That distinction matters because e-commerce conversion rate optimization is not a scoreboard for isolated wins. It’s a system for improving how the store earns revenue from the traffic it already pays for.
Scaling Learnings and Avoiding Common CRO Pitfalls
One successful experiment is useful. A repeatable testing habit is what changes a store’s economics over time.
Teams that scale well do two things consistently. They document what they learn, and they protect the quality of their experiments. Without those two habits, a CRO programme becomes a pile of disconnected tests and recycled opinions.
Build a learning system, not just a test log
Every test should leave behind something reusable:
- The hypothesis
- What changed
- What happened
- What the team believes it means
- What to test next
This matters for more than the CRO team. Paid media, lifecycle marketing, UX, merchandising, and product teams all benefit when experimentation insights are captured in plain language.
A useful backlog usually includes a mix of page types and business goals. Keep some ideas close to checkout for revenue impact, and others higher in the funnel for message clarity and buyer confidence.
Protect performance while you test
Speed is not separate from optimisation work. It is part of optimisation work.
According to Shopify, the 2021 rollout of Google’s Core Web Vitals correlated a 1-second faster page load with a 7% conversion increase. The same source notes that ignoring site speed is especially risky on mobile, where over 70% of UK e-commerce sales occur.
That creates a practical rule for experimentation. If your testing setup adds visible flicker, heavy scripts, or unstable rendering, you may be damaging the experience while trying to improve it.
A test that harms page performance can hide the benefit of the idea you’re trying to validate.
Common mistakes that keep repeating
Some pitfalls show up in nearly every early-stage programme:
- Calling tests too early: The first few days rarely tell the full story.
- Testing weak ideas first: Easy changes feel productive but often don’t matter commercially.
- Ignoring segment differences: Mobile, desktop, new customers, and returning buyers rarely behave the same way.
- Letting opinions override evidence: Senior preference is not a measurement framework.
- Failing to document losses: Losing tests often contain the most useful strategic signal.
Sample e-commerce A/B test ideas for 2026
| Area | Test Idea | Primary Metric |
|---|---|---|
| Product page | Rewrite the primary value proposition near the CTA to match acquisition message | Add to basket |
| Product page | Move delivery and returns reassurance higher on the page | Product page progression |
| Basket | Surface shipping cost information earlier | Checkout start |
| Checkout | Enable or emphasise guest checkout | Completed purchase |
| Checkout | Reduce non-essential form inputs on mobile | Mobile purchase completion |
| Offer design | Test bundle placement above versus below the main CTA | Average order value |
| Offer design | Compare quantity discount wording styles | Revenue per visitor |
| Trust | Add clearer payment and returns reassurance near final payment action | Checkout completion |
Keep momentum without creating chaos
The easiest way to lose momentum is to run too many tests without a calendar or an owner. Assign someone to manage the queue, record decisions, and close the loop after results come in.
Treat each experiment as part of a compounding system. The point isn’t to prove that one variation beat another on one page. The point is to build a store that gets better at turning demand into revenue every month.
If you want to run that kind of programme without slowing your site down, Otter A/B is built for exactly this job. It gives e-commerce teams a lightweight way to test headlines, CTAs, layouts, and revenue-focused variants while keeping performance intact. You can track purchases, AOV, revenue per variant, and significance in one place, then share results with stakeholders without turning every test into an analytics project.
Stop guessing
Ready to start testing?
Set up your first A/B test in under five minutes. No credit card required.
- 14-day free trial
- No credit card required
- Cancel anytime