CTA Test Results: When to Ship the Winner
Read CTA test results properly: judge 95% confidence, orders and revenue, then ship, keep testing or stop.
The most repeated advice on call-to-action tests is to ship the button that collects more clicks. That advice is how a louder label becomes the live control while completed orders stay flat, or fall.
A click is a knock on the door. The commercial question is who comes in and pays. CTA test results can look decisive on the button and still fail on purchases, revenue per visitor, or the people the new wording shuts out. Read the test the way you'd read a till report, not a vanity chart, and only then decide whether to ship.
How Confidence and Sample Size Change the Call
Confidence is a false-alarm check, not a guarantee that the new button is better. Picture two coins that are fair and identical. If you call a gap "real" only when a gap that large would show up about one time in twenty under pure chance, you are using a 95% threshold. You are not saying there is a 95% chance the lift is genuine. You are saying a gap this big would be rare if control and variant were equal.
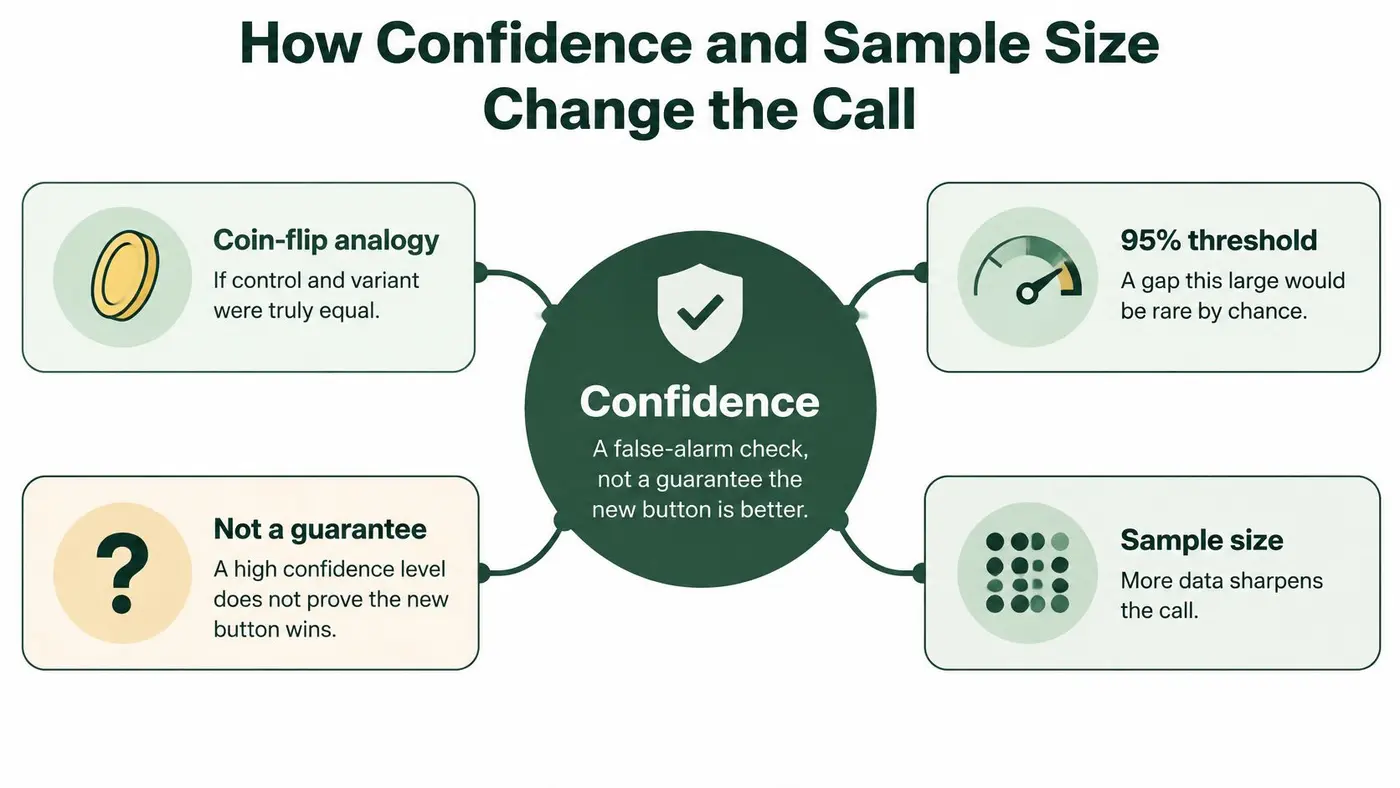
Lock one primary goal before the first visitor arrives. Completed purchase, or a qualified lead, is the right kind of goal. Keep click rate as a secondary read so a busy button can't crown itself.
Two ways a green result gets invented
Peeking is the quiet inflator. If you stop on the first green day, you harvest noise that later disappears. The planned sample exists so the call isn't made on a lucky morning.
Several CTAs against one control raise the same problem in another form. Each extra comparison is another chance of a lucky win, so the bar should tighten. A Bonferroni correction is the plain version of that idea: split the false-alarm budget across the comparisons instead of spending the full budget on every pair. On an A/B/n test, our significance threshold adjusts automatically using a Bonferroni correction. A manual frequentist split still shows significance and lift against a threshold you configure, so 95% is a choice, not a magic property of buttons.
The opposite trap sits on a huge site. Enough traffic can mark a lift of a few hundredths of a percentage point as significant while the change is too small to justify design work or inclusion risk. Sample size sharpens the call. It doesn't decide whether the call is worth shipping.
Practical rule: Read significance only after the test has the visitors or conversions you planned, and only on the goal you named first.
Work through the result in this order.
- Confirm the plan: The test reached its planned visitors or conversions, and the primary goal is still tracking.
- Read the primary goal: Significance on clicks doesn't count as the verdict.
- Check the interval: It still has to exclude "no difference". A wide band that covers zero is unfinished, even if the point estimate looks nice.
- Only then look at lift size: A reliable crumb can still be too small to ship.
If you don't yet know how many sessions that plan needs, size it with a sample size calculator before you argue about winners.
What Your CTA Test Result Is Telling You
Start with the verdict, not the chart legend. A CTA test result answers one question: did this variation beat the control on the goal you named before launch, with enough evidence to act?
Walk the rows in order. Ship when the variant is significant on the primary goal, typically at 95% confidence, and completed orders or revenue per visitor move with it rather than against it. Treat a significant click lift with flat or worse purchases as a failed commercial test. It is useful only as a diagnostic of curiosity. Keep testing when the gap favours a variant but hasn't crossed the threshold or the planned sample. Stop and retain the control when the variant is significantly worse. Leave a fractional-point lift on a short or thin-traffic test as inconclusive, even if a tool paints it green.
Result pattern Confidence Orders and revenue Decision Primary goal up and revenue holds Significant on the primary goal, typically 95% Completed orders and revenue per visitor up, average order value not cut Ship the variation Clicks up, purchases flat or down Significant on clicks, not on orders Button clicks rise, completed orders do not Do not ship; keep control Gap favours a variant but is unfinished Below the pre-set threshold Directional only Keep testing to the planned sample Variant worse on the primary goal Significant and worse on the primary goal Orders or revenue per visitor down Stop and keep the control Tiny lift on a short or low-volume test Unstable or barely green Fraction of a percentage point Do not generalise or ship yetWhy the stakes are commercial, not decorative
Internet sales represented 7.3% of all retail sales in Great Britain in 2010 and 27.5% by 2025, almost a fourfold rise over 15 years, in figures compiled by Anthony McGrath from official retail series. Other reported Office for National Statistics readings put online sales at about 28.6% of UK retail in November 2025 and 28.3% in December 2025. Roughly one in four retail pounds can now pass an online journey where a headline, a checkout prompt, or button wording can change what people do.
Those shares are market context. They are not an expected uplift from rewriting a button. A UK test still needs a named primary outcome, such as completed purchase, qualified lead, or revenue per visitor, plus a look at device, traffic source, and new versus returning visitors.
Three checks decide the row you are in: whether the false-alarm bar was cleared, whether the full path to an order moved, and whether revenue held. The table is the action. The rest of the reading is how you stop a green click from impersonating that action.
Why Clicks Lose and What Each Result Decides
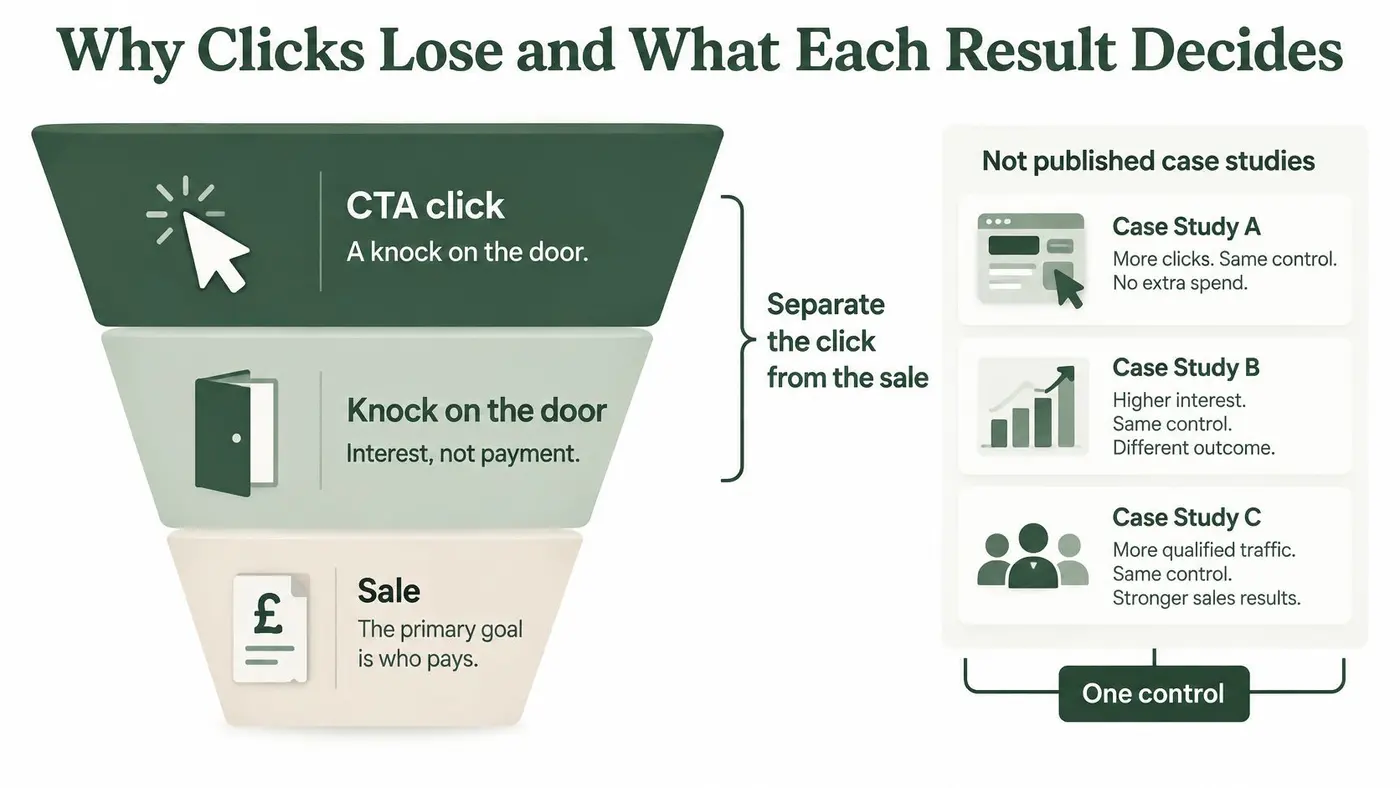
A button can win the click test and still lose the sale. A CTA click signals interest; the primary goal shows whether that interest becomes a purchase.
A 2025 Baymard Institute meta-analysis of 50 published studies, summarised in Sunny Patel's UK ecommerce statistics, put average documented online shopping-cart abandonment at 70.22%. That is about seven in ten documented journeys, though the figure is not an official UK-only rate. The same write-up reports an average ecommerce conversion rate of 1.68% in UK and Irish merchant data for September 2025, fewer than two sessions in 100.
Checkout conversion measures a different step from site conversion. In IMRG and Ecommpay's 2024 study of 45 retailers, average checkout conversion was 58%. Single-page checkouts averaged 61%, compared with 56% for multi-page checkouts. Guest shoppers converted at 52%, compared with 64% for registered customers, and 59% of orders were placed by guests. A CTA that sends more shoppers into a longer or less trusted checkout can raise clicks while lowering completed orders.
The short walk-through below follows the whole path from click to revenue.
Three illustrations, one control
These sketches share the same control, Buy now. They are illustrative examples, not published case studies. In each, the control converts 2.0% of sessions.
Example A, the click trap. Check delivery raises clicks from 8% to 11%, with a significant result on clicks. Purchases fall to 1.7%, and revenue per visitor drops. Do not ship. More people tapped the button, but fewer completed the commercial outcome.
Example B, the commercial win. Pay securely raises purchases from 2.0% to 2.35%, with 95% confidence on the primary goal. Average order value stays flat, and revenue per visitor rises. Ship, then check the first full trading week to see whether the result holds beyond a weekend traffic mix.
Example C, the magnitude trap. Checkout completion shifts by 0.2 percentage points across a few thousand sessions, but the interval still includes no difference. The point estimate leans positive; the evidence does not yet settle the call. The 5-point gap between single-page and multi-page checkout in the retailer study is context, not a result a button label should be expected to reproduce.
Read the outcome measures together: CTA engagement, checkout starts, completed orders, average order value, and revenue per visitor. Choose in advance which primary goal decides whether to ship.
When a Significant Winner Still Fails Users
A higher conversion can still be the wrong ship if the button excludes people. Most write-ups treat a green click-through as an automatic win. UK evidence says button wording, contrast, and link context can shut users out while the chart improves.
A 2026 UK accessibility index, the AudioEye Digital Accessibility Index, found vague link text on 71.1% of tested sites and low-contrast interactive elements on 70.6%. A generic label such as "Learn more" can beat a control that said where the link goes, then fail a screen reader because the destination is no longer in the name. The UK Government's 2026 inclusion monitoring, covered in that same index, found that 11% of surveyed organisations didn't know whether their services met accessibility guidelines, despite 75% reporting WCAG 2.0 AA or higher.
Reject the green result when access gets worse
Don't build a second scoreboard. Use a short reject list.
- Descriptive text loses to a vague label. If the control named the destination and the variant doesn't, the click lift isn't a cleaner experience.
- Contrast or focus gets worse. Low-vision users and keyboard users need to see and reach the control. A desktop hover state doesn't fix that.
- The target is too small on mobile. A thumb miss looks like "no interest" in the data and feels like a broken page to the shopper.
- Only the control explains the error. If the variant's failure message doesn't say what to fix, you've added a dead end.
Success here is incremental conversion without an accessibility regression. When you reject a green result, record three things: the metric it won, the access failure, and the decision to keep the control. Pair that note with user experience testing so the variant is checked with a keyboard and a screen reader, not only with a significance badge.
A statistically significant winner should be turned down when it makes the journey harder for screen-reader or low-vision users.
Category and Season That Distort a Winner
Don't score your button against a single "good" conversion rate. The published UK picture moves by month and by what you sell.
Benchmark Rate How to read it January 2026 average 1.51% Down from 1.75% a year earlier May benchmark 1.93% Up from 1.76% year on year Food and drink 1.20% Low end of that reported range Arts and crafts 5.01% High end of that reported rangeOne 2026 benchmark, set out in Whito's UK conversion-rate research, reports average UK ecommerce conversion of 1.51% in January, down from 1.75% a year earlier. Another reading in that research is 1.93% in May, up from 1.76% year on year, with the same picture running from 1.20% in food and drink to 5.01% in arts and crafts.
What those gaps mean for your button
A crafts store at 3% isn't failing a grocery standard. A grocery CTA that moves 1.20% to 1.35% can be a large relative gain inside a low-rate category. Judging either shop against one national average turns a context problem into a false loss, or a false win.
Other mix effects can swamp the wording. Device mix, paid versus organic traffic, new versus returning visitors, and peak trading weeks all change the base rate. A winner on mobile paid traffic in January isn't a site-wide law for December desktop. Purchase intent in those segments can dwarf a two-word label change.
Check the effect in the two or three segments that hold most of the revenue before you paste the CTA onto every template. If the lift flips sign in a major segment, don't generalise. Limit the change to the segment that earned it, or run a follow-up with that segment named in advance.
These rates describe markets. They aren't the lift your variation earned. A test is allowed to win inside January grocery traffic and still be the wrong default for a crafts template in May.
What a Payment CTA Result Can and Cannot Claim
Payment-option wording belongs in the CTA result, not in a side project that nobody ties back to the button. Where merchants offered one express-checkout option, average conversion was 54%, compared with 67% among retailers offering four, a 13-point gap in the IMRG and Ecommpay checkout findings reported by CMOTech. That gap is observational. Retailer scale, technology, customer mix, or category may sit behind it. Treat it as a hypothesis for a controlled test, not as proof that adding buttons caused the lift. The same industry reporting recommends that payment pages meet WCAG 2.2 AA, because a desktop click lift that strands keyboard and low-vision users isn't a win.
Five checks before you ship a payment label
- Say what is available. Write the variant so express payment is clear on the action, such as "Pay with express checkout" beside a "Pay now" control. Hold price, delivery promise, layout, and traffic split constant.
- Name the commercial goal. Completed orders or revenue is primary. The payment-button click stays diagnostic.
- Split guest and registered shoppers. Guests already complete checkout at a lower rate than registered customers, and they may use express options differently. A blended rate can hide a loss on the larger guest share.
- Put money next to the start of the express path. Compare revenue per visitor and average order value, not only who taps the express label.
- Ship on a tight rule. Completed orders rise, average order value doesn't fall materially, and the interval excludes no difference.
If clicks jump and orders don't, the louder payment label failed as a commercial test. Record whether you changed the message only, or the number of payment methods offered. Otherwise a later result will confuse copy with choice architecture. For the baseline those orders sit on, see how to read a checkout conversion rate before you credit the button for a structural change you didn't make.
Ship Keep Testing or Stop the CTA
The test already running needs one next action, not another dashboard tour.
- Confirm the experiment is intact. It reached its planned visitors or conversions, and tracking for the primary goal still fires. An automatic health checklist on the results page shows whether the numbers are safe to trust and what to fix if they aren't.
- Read one line on that goal. Up, unfinished, or down. Ignore the click row until that line is clear.
- Place money beside the rate. Revenue per visitor and average order value sit next to conversion. Reject a click win that doesn't move orders.
- Apply the access check and the segment check before anyone edits the live button. A major segment that flips sign, or a label that fails keyboard and low-vision use, vetoes the ship.
Then choose one action. Ship when the primary goal is significant, revenue holds, and no major segment or accessibility guardrail flips the result. Keep testing when the direction is favourable but the sample or the interval is unfinished. Stop and keep the control when the variant is worse on orders or revenue, or when a green click result fails users.
Name the test, set the URL, define the CTA variants, and lock the conversion goal before the first visitor arrives. A results view that states ship, keep testing, or stop in one line, with revenue per visitor beside conversion, stops a stakeholder and a spreadsheet from telling two stories. That same resolved decision shows on the results page, in the API, and in the CSV export. Otter A/B can hold that one-line call on an executive summary card. The decision rule is what the result means either way.
Otter A/B is a lightweight testing platform for headlines, CTAs, and layouts, with purchases, average order value, and revenue per visitor reported beside conversion so a click lift can't pose as a win. You can define the goal, split traffic, and read a one-line ship, keep-testing, or stop call without a heavy setup. Start with your next button test at Otter A/B.
Stop guessing
Ready to start testing?
Set up your first A/B test in under five minutes. No credit card required.
- 14-day free trial
- No credit card required
- Cancel anytime