Statistical vs Practical Significance: How to Decide
Statistical vs practical significance explained for A/B testing: how to read p-values, confidence intervals and revenue, and decide when to ship.
Your test dashboard shows a conversion winner, and the team wants to ship it. Then someone asks whether the extra orders will cover the development work, whether customers are spending less, and whether the result holds outside your strongest acquisition channel. The significance badge doesn't answer those questions.
That's the distinction between statistical vs practical significance. You need evidence that the variants differ, but you also need a commercial reason to prefer the winner. Treat those as separate decisions, and you'll avoid rolling out changes that improve a dashboard without improving the business.
Statistical vs Practical Significance at a Glance
Statistical significance asks whether the observed difference is inconsistent with a no-effect model. Practical significance asks whether that difference is large enough to justify acting on it. Neither replaces the other.
The House of Commons Library's statistical guidance describes the conventional p below 0.05 threshold and the corresponding 95% confidence interval approach, while distinguishing uncertainty about an estimate from its importance.
Statistical and practical significance compared
Criterion Statistical significance Practical significance Question answered Is there evidence that the variants differ? Is the difference large enough to act on? Typical threshold p below 0.05, or a corresponding 95% confidence interval excluding no effect Pre-agreed minimum lift in business units Main measures p-value and confidence interval Absolute lift, incremental revenue, margin What it depends on Sample size and variance Price, margin, implementation and rollout cost How it fails Traffic too low to detect a real effect No threshold set, or threshold set after seeing results Usual owner Analyst or testing platform Product, finance or growth leadThe ownership row is a useful division of responsibility, not a restriction. An analyst should help translate uncertainty into financial consequences, while the commercial lead should understand what the statistical result can support.
A test can pass either assessment and fail the other. A small improvement may be measured precisely but contribute too little profit to justify maintenance. An apparently substantial improvement may deserve further investigation without providing enough evidence for rollout.
Evidence and value require separate approval
The statistical assessment protects you from mistaking sampling variation for a dependable improvement. The practical assessment protects you from investing in a dependable improvement that isn't worth having.
For a checkout experiment, the commercial decision should include more than the implementation ticket. Consider ongoing support, payment failures, fulfilment costs and the opportunity cost of delaying another project. A change that looks attractive before those costs may look unremarkable afterwards.
Decision rule: Significance is the first gate. Value is the second. Ship only when the experiment clears both and the operational guardrails hold.
This is a deliberately conservative rule for ordinary rollout decisions. It doesn't prohibit a strategic bet under uncertainty, but it does require the team to describe that bet accurately rather than presenting it as a proven business win.
When Significance and Value Disagree
A significant result means that an outcome at least as extreme as the observed one would be unusual under the null hypothesis. UK parliamentary guidance on data analysis gives the conventional threshold as p < 0.05, meaning such an outcome would occur in fewer than 5% of comparable samples under that model, and illustrates the distinction from importance with a statistically significant average difference of only 0.1 kg.
That definition doesn't give you the probability that the winning variant is better. It also doesn't measure how much money the change could make. It describes the compatibility of the observations with a specified statistical model.
Sample size matters because more observations can make an estimate more precise. Consequently, a modest effect can become distinguishable from no effect without becoming any more commercially attractive.
The four possible outcomes
Statistical verdict Commercial verdict Example scenario Action Significant Valuable A checkout simplification improves completed purchases and clears the contribution target Ship after checking guardrails Significant Trivial A button change produces a detectable improvement, but its contribution won't justify implementation Reject or defer Inconclusive Potentially valuable A redesigned offer appears profitable, but uncertainty still includes disappointing outcomes Complete the planned test or design a follow-up Inconclusive Unattractive A layout change offers little estimated benefit and no persuasive evidence of improvement Stop and record the learningSignificant and valuable is the straightforward case, but it still requires an operational check. A purchase increase isn't sufficient if the treatment causes payment errors or attracts orders the business can't fulfil economically.
Significant but trivial is where teams most often confuse measurement with prioritisation. Say a developer must replace a checkout component to preserve a small conversion gain. If the expected contribution barely offsets maintenance, the result can be statistically convincing and still belong at the bottom of the backlog.
Promising doesn't mean proven
A valuable-looking but inconclusive result deserves a different response from a trivial one. If the experiment hasn't reached its planned sample, continue according to the original stopping rule. If it has, consider a better-powered follow-up rather than extending the test indefinitely until the dashboard turns favourable.
When neither assessment supports the variant, stopping is a useful outcome. Record the hypothesis, the estimated effect and the uncertainty so the next team doesn't repeat the same idea under a different name.
A p-value assesses evidence against a no-difference model. It doesn't tell the team whether the difference matters.
Setting the Minimum Worthwhile Effect First
Set the commercial threshold before anyone can see which variant leads. Otherwise, the team can unintentionally redefine success around the result it happens to get.
NICE's evidence-methods guidance uses explicit thresholds for meaningful effects, including risk ratios of 0.75 and 1.25 as boundaries for appreciable benefit or harm. Those clinical boundaries aren't ecommerce targets, but the underlying discipline transfers: define importance separately from statistical significance.
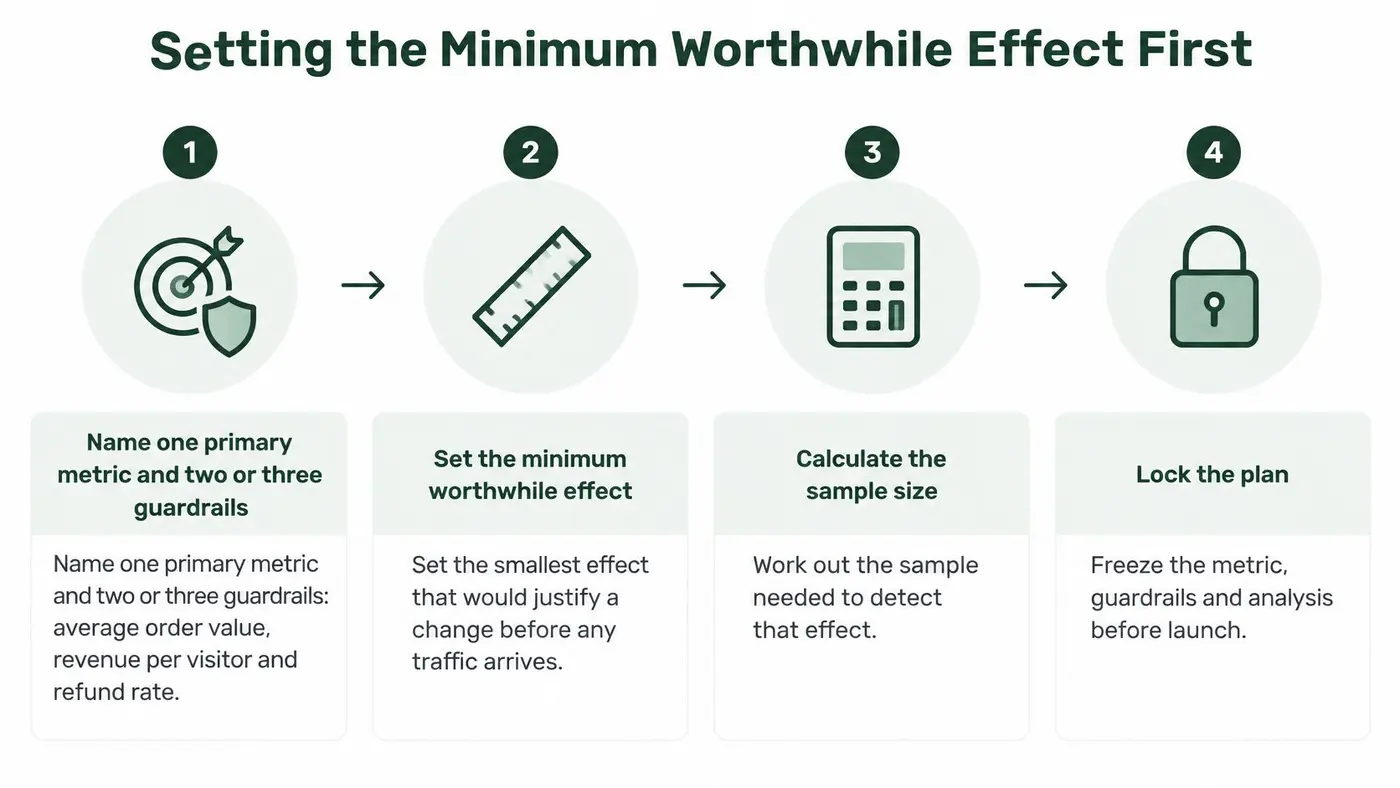
Write the commercial contract before launch
-
Choose the primary metric. Name the outcome that decides success. For a purchase experiment, revenue per visitor may be more appropriate than clicks or checkout starts. Add guardrails such as average order value, refund rate and payment completion.
-
Define the minimum worthwhile effect. Express it in units the business can evaluate, such as additional contribution per visitor or incremental contribution over the rollout period. Include build costs, ongoing costs and the payback window the finance owner accepts.
-
Check whether the experiment is feasible. Run a sample-size calculation using the baseline, target effect and planned analysis. At Otter A/B, we recommend doing this before every launch to check that there's enough traffic, and we provide free Sample Size, Significance and Duration calculators.
-
Specify the statistical approach. Record whether the analysis is one-sided or two-sided, how comparisons will be handled and which visitors are eligible. Don't choose a favourable analysis after seeing the result.
-
Commit to a stopping rule. Write down when the team will evaluate the final result. For a fixed-horizon test, an attractive interim reading isn't a substitute for completing the plan.
Don't confuse detectability with value
The minimum worthwhile effect is an economic judgement. The minimum detectable effect is a design parameter used to plan how much evidence the experiment needs. Our guide to minimum detectable effect helps connect that planning parameter to the available traffic.
Ideally, the experiment can detect an improvement small enough to matter commercially. If it can only detect much larger changes, an inconclusive result won't establish that the idea lacks value. You may need a longer experiment, a more substantial intervention or a different priority.
Test-brief wording: We'll judge success on the primary metric against a pre-agreed contribution threshold, complete the planned analysis, and reject rollout if the revenue or customer-quality guardrails fail.
Have the analyst and commercial owner approve that wording together. Agreement before launch is more useful than negotiating the meaning of success after the results arrive.
Turning a Lift Into Business Units
Significance is the first gate; contribution is the second. A conversion lift becomes decision-ready when you translate it into payback, starting from a clearly defined population: eligible visitors exposed to the change, not total website traffic.
For a hypothetical UK shop, assume the proposed checkout change increases completed purchases while average order value and margin remain unchanged. Make those assumptions explicit rather than treating them as guaranteed.
Build the calculation from the visitor upwards
Calculation Formula Additional orders Eligible visitors × baseline conversion rate × relative lift Additional revenue Additional orders × average order value Additional contribution Additional revenue × contribution-margin rate, less incremental operating costs Payback period Build and rollout cost ÷ additional contribution per period Conservative payback Repeat the calculation using the confidence interval's lower lift boundBuild the payback calculation in a spreadsheet or a revenue impact calculator, then reconcile its assumptions with your finance model.
Be precise about gross margin versus contribution. A gross-margin figure can still omit costs that move with the experiment, such as additional fulfilment work, payment fees, customer support or promotional subsidies. Finance should decide which costs belong in the rollout case, and the per-period contribution should match the period finance reports on.
A small gain doesn't fail because it would never repay implementation. It fails when it won't repay the cost within the business's accepted window, or when the same resource earns more elsewhere.
Commercial check: Calculate payback at the estimated lift and at the lower confidence bound. If only the optimistic calculation works, the rollout case remains exposed to uncertainty.
If order values or product mix change, conversion lift alone won't estimate revenue; evaluate the observed revenue-per-visitor difference directly. With the Otter pixel connected, each variant shows revenue per visitor and average order value beside conversion rate, and revenue per visitor carries its own significance test using Welch's t-test for unequal variance. When conversion rate and revenue disagree, Otter says so instead of declaring a winner, so a variant can clear the first gate and still fail the second.
Reading Confidence Intervals Against the Threshold
A significant result only says the observed difference is unlikely under the null model. It does not say the effect is large enough. The confidence interval is the second read: a range of lifts that remain compatible with the observations, the design and the analysis assumptions.
UK regulatory statistical guidance recommends reporting estimates with confidence intervals where possible and defining whether the test is one-sided or two-sided. That discipline matters commercially because the same significant result can clear the first gate and still fail the minimum worthwhile effect.
For the hypothetical comparison below, treat every percentage as relative lift, not percentage-point change. The rows are decision examples, not measured store results.
Reading intervals against a +0.8% threshold
95% interval (relative lift) Significant at 5%? Lower bound clears +0.8%? Decision +0.2% to +1.4% Yes No, lower bound is +0.2% Gather more data or accept the risk knowingly +0.5% to +2.5% Yes No, lower bound is +0.5% Keep testing, as the true lift could be small +0.7% to +0.95% Yes No, lower bound is +0.7% Close to threshold; gather more data before shippingStart with the rollout case
A clean rollout case has its entire interval above the minimum worthwhile effect, with commercial guardrails intact. None of these illustrative rows meets that requirement, even though all exclude zero.
The first row supports a positive effect, but its lower bound cannot fund a rollout built on +0.8%. The team has established direction, not value. The second row pairs attractive upside with a lower end still too weak; continue only within the planned testing approach, or specify a follow-up experiment rather than checking repeatedly until the answer changes.
Precision doesn't automatically make a result worthwhile
The final row is narrower and close to the threshold, but its lower bound still falls short. More observations might improve precision, yet they won't necessarily move the estimate in a favourable direction.
If an interval spans zero, the analysis also remains compatible with no improvement. Our explanation of confidence intervals in statistics provides the interpretation behind that distinction.
For revenue metrics, inspect their own intervals rather than assuming the conversion interval applies. A conversion interval can clear the threshold while the revenue-per-visitor interval does not, if order value or product mix moves the other way. Treat that as a separate gate before shipping.
Use the lower bound as the conservative rollout criterion, not as a literal worst-case guarantee. Ship when it clears the minimum worthwhile effect, provided the experiment is valid and the revenue checks also support the decision.
Why a Conversion Winner Needs a Revenue Check
A conversion improvement can look much larger than the associated commercial improvement. The IRP Commerce ecommerce benchmark reports conversion rising from 1.63% to 1.83% while average order value fell from £134.03 to £122.94, alongside reported revenue per session increasing from £1.52 to £1.67.
Those measures moved in different directions. The benchmark doesn't demonstrate that an A/B variant caused any of the changes, and it doesn't establish statistical significance. It does demonstrate why a conversion movement alone is an incomplete description of trading performance.
Don't reconstruct the benchmark's reported revenue per session by multiplying headline aggregates unless their definitions, denominators and weighting align. Use directly measured revenue per visitor within your experiment, with consistent assignment and revenue attribution.
More orders can still mean a weaker variant
Consider a discount-led treatment. Visitors may buy more readily but choose cheaper baskets, use a deeper promotion or purchase products with lower contribution margins. The team can improve conversion while reducing the value generated by each eligible visitor.
The same problem arises after purchase. A treatment that encourages poorly matched orders could create refunds or support costs that aren't visible in an immediate purchase metric. Treat those as risks to measure, not automatic consequences of increasing conversion.
A conversion winner should be downgraded when its revenue or contribution case fails. Depending on the evidence, that means rejecting the change, narrowing its audience or redesigning the offer rather than discarding the whole hypothesis.
The revenue checks before shipping
- Revenue per visitor and its interval. Compare the revenue generated across all assigned visitors, not just the average spend of customers who converted.
- Contribution after variable costs. Include discounts, returns, fulfilment and other costs affected by the treatment. A revenue increase isn't equivalent to a profit increase.
- Customer quality after purchase. Compare refund behaviour and repeat purchase using an appropriate observation window. If those outcomes haven't matured, record that uncertainty in the decision.
With our pixel connected, each variant shows total revenue, revenue per visitor and average order value alongside conversion rate. Revenue per visitor has its own significance test, and when conversion and revenue disagree, we flag the disagreement rather than declaring a winner.
That distinction matters operationally. A positive conversion result is a reason to investigate the business outcome, not permission to skip it. If revenue is inconclusive, report an inconclusive revenue result, even when the purchase-count comparison is persuasive.
How the Verdict Changes by Situation
The practical threshold belongs to the decision, not to the website. A low-maintenance headline change and a checkout rebuild can require different commercial returns because their costs, reversibility and failure risks differ.
Keep the evidence standard explicit while adapting the business case to the actual rollout. Don't lower either standard because a test has become inconvenient to run.
Verdicts by situation
Situation What to check Verdict Low traffic, promising lift Whether the interval is too wide to distinguish the effect from the threshold Keep testing, or accept a longer duration Very high traffic, tiny lift Whether the lower bound clears the minimum worthwhile effect Usually reject, despite significance A/B/n test with several variants Corrected threshold for each variant Each variant must clear a stricter statistical bar Costly rollout, such as a checkout redesign Payback period after build and rollout cost Ship only if payback falls inside the planned window Effect confined to one traffic source Lift by source and whether it holds across segments Ship as a channel-specific opportunity, not a business-wide changeTraffic changes what you can establish
For low-traffic stores, distinguish a test that needs more observations from a design that can't answer the question within a useful period. Repeating small, underpowered tests doesn't make the programme more informative. Prioritise interventions that could produce commercially meaningful changes you can realistically measure.
High-traffic teams face the opposite problem. They can identify small differences precisely, but still need to choose which improvements deserve engineering capacity. A tiny change may be worthwhile if it is cheap and broadly applicable, so reject it on economics rather than size alone.
In multi-variant experiments, account for the additional comparisons. Our frequentist A/B/n tests automatically adjust the significance threshold using a Bonferroni correction. That tightens the evidence requirement; it doesn't automatically raise the minimum commercially worthwhile effect.
A channel-specific effect isn't a universal result
Adobe's UK digital insights report highlights differences between AI-referred shoppers and other acquisition traffic. Such differences make source-level interpretation relevant, but a channel's higher baseline conversion doesn't establish that it responds better to your treatment.
Examine treatment-versus-control lift within major sources, with uncertainty attached. Don't infer an interaction merely because a result is significant in one subgroup and inconclusive in another.
A concentrated gain can still be valuable. The defensible conclusion is a targeted opportunity that needs suitable validation, not a claim that every visitor will benefit. Model rollout using the traffic mix you expect to receive, rather than assuming the test-period mix will persist.
The Final Ship, Keep Testing or Stop Check
Use a decision checklist before approving deployment. Our results pages include an executive summary card stating whether to ship, keep testing or stop, but the team still needs to validate the commercial assumptions behind its action.
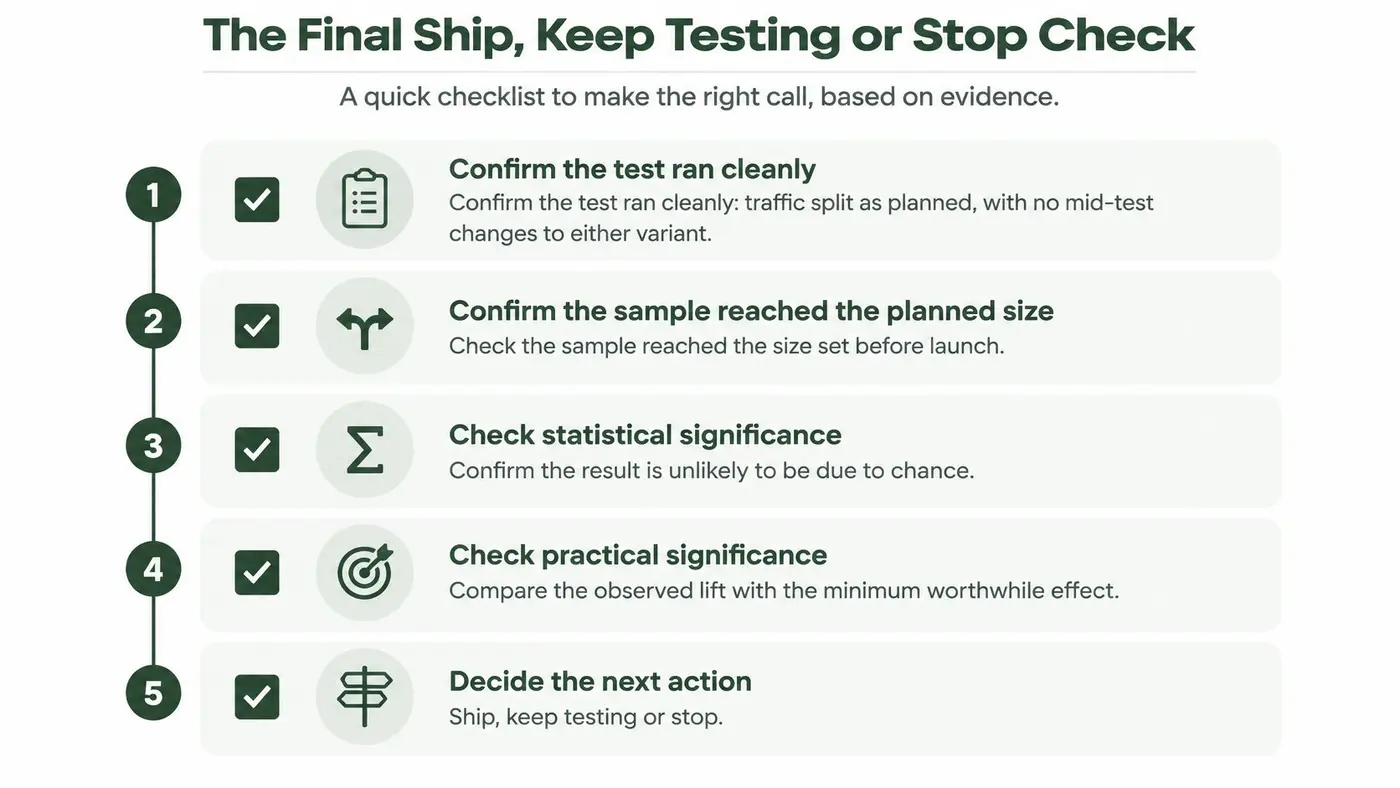
- Confirm experiment integrity. Check the planned traffic split, eligibility and tracking, with no unplanned mid-test changes.
- Confirm the planned sample. Don't substitute an encouraging interim result for the agreed stopping rule.
- Compare the lower bound with the commercial threshold.
- Check revenue and contribution. Investigate falling average order value rather than treating it as an automatic veto if overall contribution improves.
- Validate the rollout audience. Separate broad improvements from channel-specific opportunities.
- Log the decision. Include expected contribution, remaining uncertainty and the person responsible for follow-up.
Ship when the evidence, economics and guardrails support rollout. Keep testing when the planned sample is incomplete or a properly designed follow-up can resolve consequential uncertainty. Stop when the effect is commercially inadequate or the treatment damages business outcomes.
Add this to your test log: Ship only if the lower bound clears the pre-agreed worthwhile effect and revenue per visitor and contribution support rollout.
Otter A/B combines experiment analysis with variant-level purchase and revenue reporting so you can separate statistical evidence from commercial value. Visit Otter A/B to plan your sample size, compare conversion with revenue per visitor, and make your next ship, keep testing or stop decision with both gates in view.
Stop guessing
Ready to start testing?
Set up your first A/B test in under five minutes. No credit card required.
- 14-day free trial
- No credit card required
- Cancel anytime