Minimum Detectable Effect: Your 2026 CRO Strategy Guide
Master minimum detectable effect (MDE) for smarter A/B tests. Calculate it, balance tradeoffs, & see its key role in your 2026 CRO strategy.

You launch a test on a product page. The new headline is sharper, the CTA is cleaner, and everyone in the team has an opinion about which version will win. Two weeks later, the result lands in Slack: no statistically significant difference.
That outcome stings, not because the idea was bad, but because the effort was real. Design time. Dev time. QA. Stakeholder attention. Valuable traffic that could've gone to another experiment. And now the team is left asking the wrong question: “Did the variant work?” The better question is: “Was this test capable of detecting a worthwhile change in the first place?”
That's where minimum detectable effect comes in. It sounds technical, but it's really a planning decision. It tells you the smallest uplift your test is built to spot reliably. If you skip that step, you can run a perfectly tidy A/B test that was never equipped to find a winner.
The Inconclusive Test That Cost You Two Weeks
A lot of inconclusive tests aren't failed ideas. They're failed setups.
A marketer changes a pricing page. Another team member updates the form layout. Someone else wants to test a shorter hero section. The test goes live because the change feels meaningful. Traffic flows in. People check the dashboard every day. Then the test ends without a clear result, and the room splits in two directions.
One camp says the variation didn't work.
The other says the test needed more time.
Both might be wrong.
What usually went wrong
Teams often decide the hypothesis first and the mechanics second. They ask, “What do we want to test?” before asking, “What size of improvement would matter enough for us to detect?” If that second question never gets answered, the test can drift into a dead zone where the expected uplift is too small for the available traffic.
That's why minimum detectable effect matters so much in CRO work. It reframes test planning from hope to feasibility.
Practical rule: If you can't say what minimum uplift would justify shipping the change, you're not ready to launch the experiment.
Minimum detectable effect gives you a pre-test reality check. It answers questions like:
- Can this page support a sensitive test? Some pages don't have enough traffic.
- Is the expected uplift large enough to be visible? Small gains often need much bigger samples.
- Are we spending traffic wisely? Every underpowered test delays the next one.
The hidden cost of “just run it”
When teams ignore MDE, they often treat testing tools like scoreboards instead of planning tools. The platform tells them whether a winner appeared, but it can't rescue a weak design after the fact.
That's the expensive part. You haven't just lost two weeks. You've also lost confidence in experimentation. People start saying things like “testing doesn't work on our site” when the underlying issue is that the team never set the experiment up to see the effect they cared about.
What Is the Minimum Detectable Effect
Minimum detectable effect is the smallest true effect your experiment is designed to detect at a chosen significance level and power. In standard power analysis, teams often use 5% significance and 80% power, and the common formula uses the z-values 1.96 and 0.84 for those thresholds, as shown in the J-PAL mechanics of power lecture slides.
That definition matters, but it helps to make it visual.
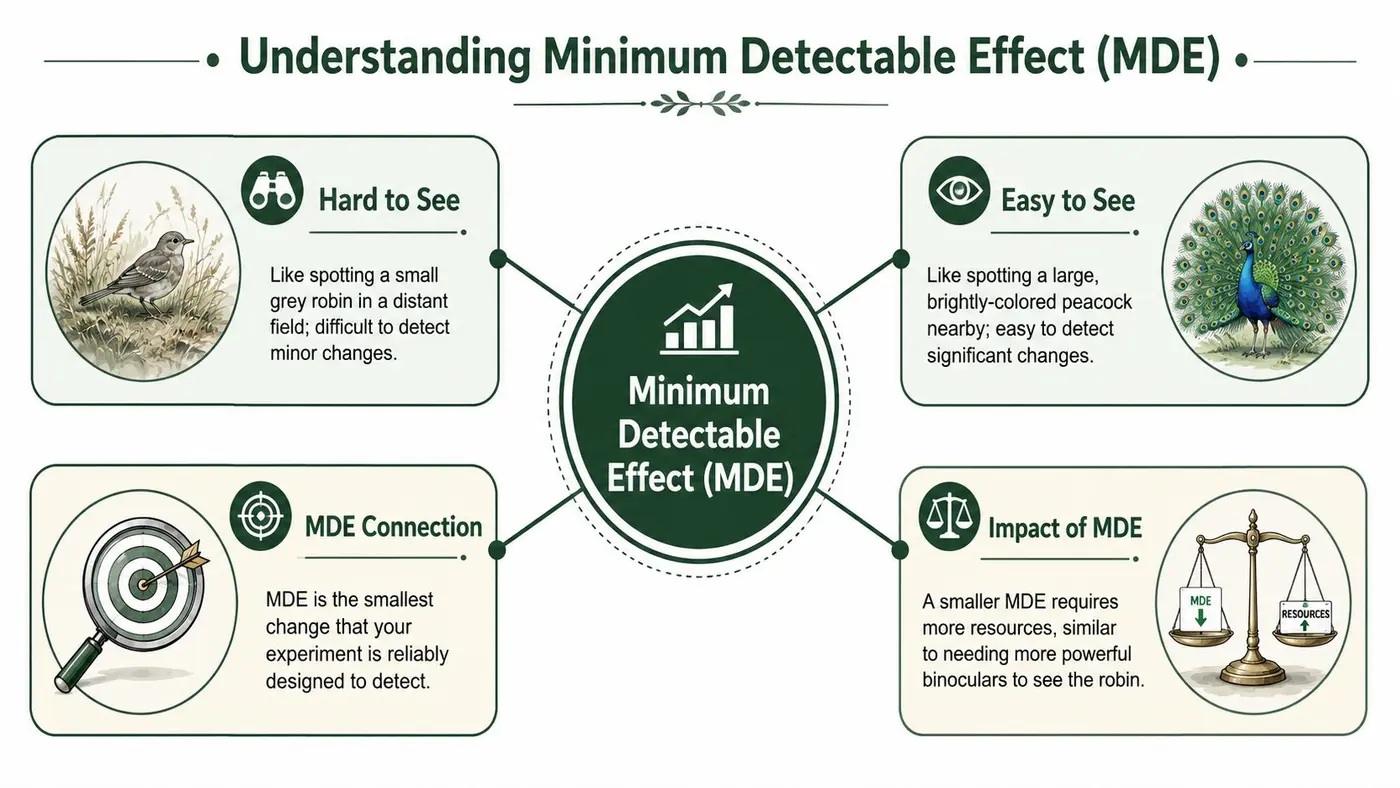
Think of MDE like spotting wildlife
If you're standing at the edge of a large field, spotting a peacock nearby is easy. Spotting a small grey robin at a distance is much harder. The robin might be there, but your eyes and distance limit what you can detect reliably.
An A/B test works the same way.
- Large effects are easier to spot. A bold checkout redesign that changes behaviour a lot is like the peacock.
- Small effects are harder to spot. A tiny wording tweak is the robin.
- Your MDE is the threshold you choose in advance. You're saying, “We're setting up this test to reliably detect something at least this noticeable.”
That's why I often describe MDE as the resolution setting for an experiment. Higher sensitivity is possible, but it costs more traffic and more time.
The two ideas people confuse most
Teams usually trip over significance and power, so keep them simple.
Statistical significance is your false-alarm filter. It's the threshold you use to reduce the chance of calling a winner when nothing meaningful is happening.
Statistical power is your detection strength. It tells you how likely the test is to catch a real effect of the size you planned for.
If your team is still getting comfortable with conversion fundamentals, this guide to turning visitors into customers is a useful companion because MDE only makes sense when everyone agrees on what conversion improvement means in the first place.
You don't discover your MDE at the end of a test. You choose it before launch, because it defines what your test can realistically see.
The Three Levers That Control Your MDE
MDE isn't a mysterious number hidden inside your testing platform. It's the result of three choices you make before the test starts.
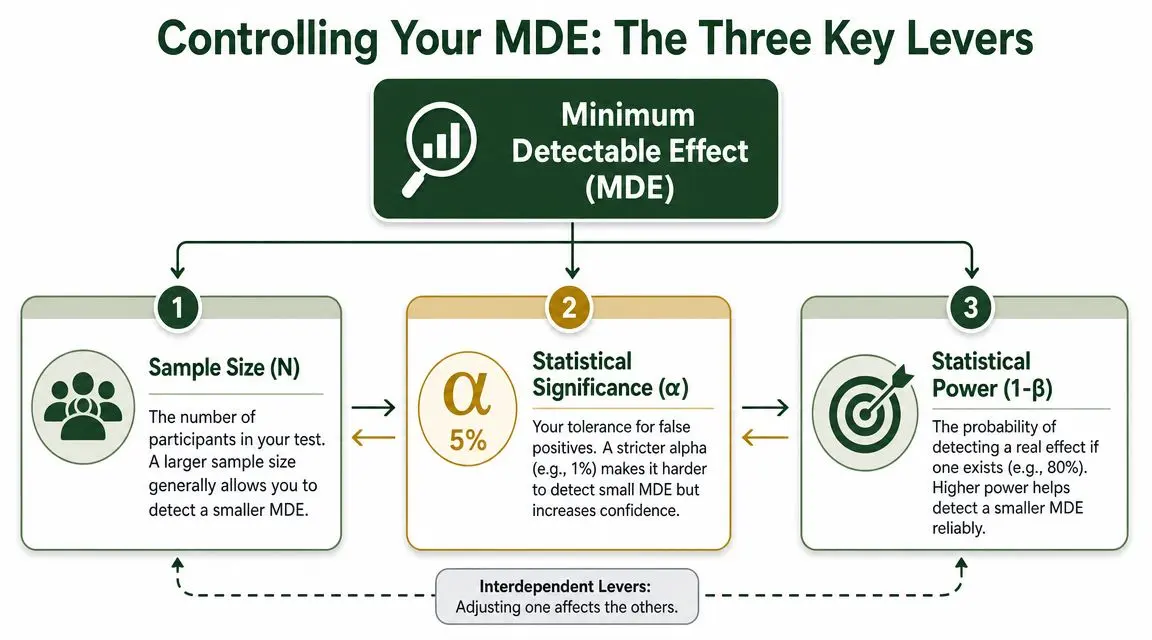
According to the Analytics-Toolkit glossary on minimum detectable effect, MDE is a design constraint, not a post-test metric. It's fully determined by your sample size, significance choice, and power choice. It also notes that stricter significance thresholds require a larger effect to be detectable for a given sample size.
Lever one: sample size
This is the most practical lever because it usually translates into one thing: time.
If you want to detect a smaller effect, you need more observations. On a busy product listing page, that may be manageable. On a low-traffic B2B demo page, it can turn a straightforward test into a very long one.
For marketers, sample size is where statistical ambition meets traffic reality.
Lever two: significance threshold
If you make your significance threshold stricter, you're asking the test to be more cautious before declaring a winner. That caution has a cost. With the same traffic, your test becomes less able to detect smaller lifts.
This is why teams can't say, “We want very high confidence and a tiny MDE,” without paying for it somewhere else.
Lever three: power
Power is the part teams forget because they focus on confidence alone. But confidence without enough power leads to lots of tests that end with a shrug.
If your team needs a plain-English walkthrough of this side of experiment planning, Otter's article on what statistical power means in A/B testing is a helpful primer.
The push and pull between the levers
You can think of these levers as a budgeting exercise:
- Want a smaller MDE? You'll usually need a larger sample.
- Want stricter significance? You may need a larger effect or a longer run.
- Want higher power? You'll typically need more data to support it.
Here's the practical takeaway. You can't order all three at the same time without consequence. Teams often want:
- a tiny detectable uplift,
- very high confidence,
- and a short test.
That combination often isn't feasible on real-world traffic.
A sensible MDE isn't the smallest number your team can imagine. It's the smallest change your traffic can support and your business would care about.
How to Calculate Your Minimum Detectable Effect
You don't need to become a statistician to work with MDE well. You do need to understand what changes when you ask a test to detect smaller gains.
For conversion experiments, the relationship is blunt: smaller effects need much more traffic.
A causal inference reference shows that with 80% power and 95% confidence, the minimum detectable effect falls from about 0.5 at N=100 to 0.15 at N=1,000, 0.05 at N=10,000, and 0.02 at N=100,000, as explained in this power and MDE reference for binary outcomes. You don't need to memorise those values. You just need to see the pattern. Sensitivity improves with sample size, but not cheaply.
The simple logic behind the maths
For a binary metric like conversion rate, sample size calculators estimate how much traffic each variation needs based on a few inputs:
- Your baseline conversion rate
- The relative lift you want to detect
- Your significance threshold
- Your desired power
That's the whole game. The maths underneath can get technical, but the decision logic is straightforward. If the baseline is low and the lift you care about is small, the traffic requirement climbs fast.
A practical way to do it
In day-to-day CRO work, using a calculator is recommended rather than doing the formula by hand. A good calculator forces the planning conversation before launch: what's the baseline, what uplift matters, and how long are we willing to wait?
If you want a guided walkthrough, this article on how to calculate sample size for A/B testing covers the mechanics in a practical format.
A real benchmark you can anchor to
One commonly cited example helps make the scale feel real. Detecting a 10% lift on a 15% baseline conversion rate at 95% statistical significance requires about 8,000 visitors per variation, based on the sample-size example referenced by the World Bank DIME overview of minimum detectable effect.
That example is useful because it shows how quickly “small but meaningful” can become “expensive in traffic”.
Table for planning conversations
Below is a planning table you can use in meetings. The first row uses the verified benchmark above. The remaining rows are intentionally qualitative, because your required traffic depends on the exact baseline, allocation, and design choices.
| Baseline Conversion Rate (BCR) | MDE (Relative Lift) | Required Visitors Per Variation |
|---|---|---|
| 15% | 10% | About 8,000 |
| Lower baseline | Smaller lift | More traffic required |
| Lower baseline | Larger lift | Less traffic than a smaller-lift test |
| Higher baseline | Smaller lift | Still substantial traffic in many cases |
| Higher baseline | Larger lift | Usually more feasible |
How to use this in a live planning meeting
When I'm working with a marketing team, I usually ask four questions in this order:
- What's the current conversion rate? Don't guess. Pull the recent baseline.
- What's the smallest uplift worth implementing? This is the commercial threshold, not wishful thinking.
- How much traffic does this page get? That determines whether the test belongs here at all.
- What are we giving up by running this test? Long tests block other experiments.
If the traffic doesn't support the desired sensitivity, don't force it. Change the page under test, choose a larger-impact idea, or accept a less sensitive design. Those are all better choices than running an underpowered test and pretending the result means something clear.
Setting a Practical MDE for Your Business
A statistically valid MDE can still be a poor business decision.
That's the part many teams miss. They treat minimum detectable effect as a purely mathematical setting, when it's really a commercial threshold. You're deciding what size of improvement is worth the cost of waiting, measuring, implementing, and possibly delaying other tests.
The UK context makes this sharper. The VWO article on understanding MDE notes that 22.8% of UK businesses sold via e-commerce websites or apps in 2024, and for many firms with finite traffic, a statistically valid MDE may still be economically meaningless. It frames the core decision well in its discussion of MDE in lower-traffic settings.
What makes an MDE practical
A practical MDE sits where three things overlap:
- It matters commercially. If the uplift won't justify the effort, don't optimise for detecting it.
- It fits your traffic reality. Some sites cannot support tiny-difference testing on key pages.
- It suits the type of change. A headline test and a checkout overhaul shouldn't always use the same threshold.
Questions that lead to better MDE decisions
Ask these before launch:
- Would we implement this change for that size of lift? If the answer is no, the MDE is too small or the idea is too weak.
- What does waiting cost us? A longer test ties up traffic and team attention.
- Is this page the right place to test? Sometimes the page is too low-traffic, but a related page higher in the funnel can answer the question faster.
If you want broader reading on experimentation and optimisation habits, Wonderment Apps' CRO guide is a useful collection because it keeps bringing strategy back to business outcomes rather than dashboard watching.
The right MDE isn't “the smallest uplift we'd love to see”. It's “the smallest uplift we can detect in time and would actually act on”.
A good rule for teams with mixed traffic
High-traffic pages can afford more sensitivity. Lower-traffic pages usually need bolder changes and a larger MDE. That doesn't mean smaller pages are untestable. It means they require stronger hypotheses, fewer vanity experiments, and tighter commercial judgement.
How Otter A/B Can Refine Your MDE Strategy
Modern testing tools change how you live with an MDE, even though they don't change the underlying statistics.
Traditional planning often treats sample size as a fixed waiting room. You choose your thresholds, estimate the visitors needed, and then assume the team must sit on its hands until the test reaches that level. In practice, tool behaviour matters. The World Bank DIME example shows that detecting a 10% lift on a 15% baseline conversion rate at 95% statistical significance needs about 8,000 visitors per variation, and it also notes that a tool with continuous monitoring can conclude earlier if the true effect is larger than the planned MDE, as described in the earlier linked DIME reference.
Why continuous monitoring changes the planning conversation
If your tool continuously checks significance, the MDE becomes less like a rigid finish line and more like a planning threshold.
That matters because real tests don't all behave the same way:
- Some variants outperform clearly and early. If the true effect is larger than expected, you may get an answer faster.
- Some tests hover near zero. Continuous reporting helps teams avoid false certainty while watching the evidence build.
- Some ideas need cleaner traffic control. Precise allocation matters when every visit counts.
For teams that want to run this planning step before launch, the minimum detectable effect calculator is the useful place to start.
What this means in practice
A lightweight testing setup changes the workflow more than the math. You still need to choose a sensible MDE up front. But if the tool gives you real-time significance updates, clean traffic splitting, and straightforward variant setup, you can operate with more discipline and less ceremony.
That's where Otter A/B fits naturally in an experimentation stack. It uses a frequentist z-test approach with ongoing significance calculation, so teams can pair pre-test MDE planning with real-time monitoring instead of relying on a fixed calendar date alone.
Common Pitfalls and Your MDE Questions Answered
The most common mistake is treating MDE like a hard border between “real” and “not real”.
It isn't. As the Analytics Toolkit article on observed effects and MDE explains, MDE is not the same as the smallest real effect that can ever be significant. It's a design threshold tied to power. Smaller true effects can still reach significance by chance, and the full explanation of observed effects below MDE is worth reading if your team keeps misreading null tests.
Quick answers to the questions teams ask most
What happens if we set MDE too high?
You'll need less traffic, but you may miss smaller improvements that were still worth shipping.
What happens if we set MDE too low?
The test may take too long, consume too much traffic, and crowd out better experiments.
Should we stop a test because the observed lift is below MDE?
Not automatically. MDE is a planning threshold, not a live cutoff rule.
How often should we recalculate MDE?
Recalculate when the baseline rate shifts, when traffic changes materially, or when the business value of the metric changes.
For a broader set of execution habits around test quality, Aakash Gupta's A/B testing tips are useful because they focus on the operational mistakes that often ruin otherwise sensible experiments.
A small observed uplift doesn't prove the variant failed. It may simply mean your test wasn't built to detect that size of effect reliably.
If your team wants a faster way to plan experiments before launch, Otter A/B gives you a straightforward way to think through MDE, sample size, and live significance so you can stop running tests that were never set up to answer the question.
Stop guessing
Ready to start testing?
Set up your first A/B test in under five minutes. No credit card required.
- 14-day free trial
- No credit card required
- Cancel anytime