Performance Benchmarking Guide: Boost Your Growth in 2026
Unlock growth with performance benchmarking. This guide covers key types, metrics, and a framework for web, app, & experiment analysis.
A lot of teams are sitting in the same uncomfortable spot right now. They shipped a redesign, changed a checkout step, launched a new onboarding flow, or rolled out an A/B test. Early feedback sounds positive. Dashboards look busy. Someone says performance is “better”.
But better than what?
That question is where most growth teams either mature or stay stuck. Without a benchmark, every performance conversation turns into opinion trading. Marketing wants more speed. Product wants more features. Engineering wants fewer scripts. CRO wants clearer test results. Everyone has a plausible argument, and none of them has a proper reference point.
Performance benchmarking fixes that. It gives you a way to compare your current state against a baseline, a peer group, a technical threshold, or your own previous best. More importantly, it lets you judge not just whether a page, funnel, or platform is working, but whether your optimisation programme is improving the business without quietly damaging user experience.
From Guesswork to Growth With Benchmarking
A familiar pattern plays out in growing teams. A new feature goes live on Monday. By Wednesday, the team is reading a mix of conversion reports, session recordings, customer comments, and engineering logs. One person points to a revenue uptick. Another highlights slower page loads. A third says the change probably helped, but can't prove it.
That's what work looks like without benchmarking. You have data, but no yardstick.
Performance benchmarking replaces that ambiguity with structured comparison. It asks a simple question in a disciplined way: how does this result compare with the right reference point? Sometimes that reference point is your own historical baseline. Sometimes it's another product line, region, channel, or competitor set. In technical environments, it may be a defined operating baseline under normal and peak conditions.
The UK has treated this as a serious management practice for a long time. A foundational milestone was the Competing for Quality (C4Q) initiative, launched in the early 1990s to help public services compare performance and spread best practice across organisations through measurable comparison rather than anecdotal improvement, as outlined in this discussion of industry benchmarks and performance comparison. That matters because it shows benchmarking isn't a trendy reporting layer. It's an operating discipline.
What changes when teams benchmark properly
When benchmarking is weak, teams chase movement. When benchmarking is sound, teams judge significance and context.
A strong programme does a few things well:
- Defines a baseline clearly so “improvement” has a real meaning
- Separates signal from noise across teams, channels, and time periods
- Turns debate into prioritisation because gaps become visible
- Protects decision quality by forcing fair comparison conditions
For commercial teams, that often starts with cleaner analytics operations. If your event naming is inconsistent, your segments are unstable, or your reporting logic changes by stakeholder, benchmarking collapses fast. That's why a resource on seller analytics best practices is useful before you scale comparison work. It helps teams establish the measurement maturity that benchmarking depends on.
Practical rule: If two reports define the same KPI differently, you don't have a benchmarking programme. You have competing narratives.
Benchmarking becomes even more valuable when experimentation enters the picture. It's one thing to benchmark site speed, conversion rate, or funnel completion. It's another to benchmark the performance impact of the testing programme itself, so your optimisation stack doesn't distort the baseline you're trying to improve.
The Four Core Types of Performance Benchmarking
Not all benchmarking answers the same question. Teams get into trouble when they treat every comparison as if it were interchangeable. It isn't. The benchmark you choose has to match the decision you need to make.
Here's the simplest way to separate the main approaches.
| Benchmarking Type | Primary Goal | Comparison Point | Example Use Case |
|---|---|---|---|
| Internal Benchmarking | Improve over time | Your own historical performance or teams | Compare conversion rate by month or by landing page group |
| Competitive Benchmarking | Understand market position | Direct rivals or category peers | Compare delivery promise, pricing presentation, or checkout friction |
| Web/App Performance Benchmarking | Protect technical quality | Baseline technical thresholds and operating conditions | Compare latency and error behaviour before and after a release |
| Experiment Performance Benchmarking | Ensure testing doesn't harm baseline | Test tool impact versus non-test experience | Check whether an A/B test script adds delay, flicker, or instability |
Internal benchmarking
This is the most useful starting point because you control the data and the definitions. You compare today against your own past performance, or one team, store, segment, or product area against another.
Internal benchmarking is ideal when the business needs operational clarity more than market theatre. It helps answer questions like:
- Are we improving consistently
- Which funnel step is lagging behind the rest of the site
- Which acquisition channel produces stronger post-click behaviour
- Which team runs cleaner experiments
It's also the least glamorous type. That's exactly why it works. It keeps teams honest.
Competitive benchmarking
Competitive benchmarking matters when context outside your business affects decision-making. A site might look fine internally but still feel slow, confusing, or dated compared with direct alternatives.
This type is best used selectively. Don't benchmark everything competitors do. Benchmark what changes customer choice.
Useful areas include:
- Offer structure such as bundles, incentives, or guarantees
- Experience standards like mobile flow, account creation, and checkout effort
- Content clarity around pricing, delivery, and trust signals
The trade-off is obvious. Competitive data often looks clean from the outside but hides different business models, margins, traffic mixes, and technical constraints. Use it to frame questions, not to copy tactics blindly.
Web and app performance benchmarking
Growth and engineering meet. You benchmark the technical behaviour of the product itself, especially the parts users feel before they articulate them.
Teams usually need this when a release “should” have helped, but behavioural metrics weaken. The product may be more persuasive in theory while becoming heavier, less stable, or slower in practice.
A benchmark that ignores operating conditions usually flatters average performance and hides failure under peak demand.
This type of benchmarking works best when business stakeholders can see the practical implication. Slower rendering, unstable pages, and increased errors don't stay technical for long. They show up as weaker conversion journeys, poorer campaign efficiency, and less trustworthy experiment results.
Experiment performance benchmarking
This is the category many teams miss.
Most experimentation programmes benchmark the outcome of tests. Fewer benchmark the cost of running those tests. That's a mistake. If your test tooling adds delay, blocks rendering, creates visual flicker, or increases failure risk, then the experiment can change user behaviour before the variant itself has any chance to do so.
That means your testing stack becomes part of the treatment.
Experiment performance benchmarking focuses on the mechanics of testing delivery:
- Script weight and load behaviour
- Render impact
- Visual stability
- Impact on baseline page speed
- Differences between tested and non-tested sessions
If you run A/B tests without benchmarking the delivery layer, you can end up “winning” tests on distorted traffic. For a CRO team, that's one of the most expensive forms of false confidence.
Choosing What to Measure Key Benchmarking Metrics
A benchmarking programme fails early when teams choose metrics because they're easy to export rather than useful for decisions. You don't need more KPIs. You need a defensible set that connects technical behaviour, user experience, and commercial outcomes.
Business metrics that tie to decisions
Start with the metrics leadership already uses to allocate budget and judge performance. In most growth environments, that means commercial outcomes, not vanity movement.
Common examples include conversion rate, average order value, revenue per user, lead completion quality, checkout completion, and repeat purchase behaviour. The exact mix depends on the business model, but the rule is stable. If a metric won't influence action, it doesn't belong in the core benchmark set.
When paid acquisition is involved, external reference points can help frame channel efficiency. A practical example is reviewing e-commerce media buyer benchmarks to understand how media teams think about return expectations. That doesn't replace your own economics, but it helps stop isolated interpretation.
User experience metrics that explain behaviour
Behavioural performance sits between technical delivery and commercial results. From this position, teams often find the “why”.
Useful UX benchmark areas include:
- Bounce and exit behaviour to spot mismatch or friction
- Journey completion rates across signup, checkout, or onboarding
- Page-level engagement where content hierarchy matters
- Visual and interaction stability when tests or scripts alter rendering
The point isn't to create a giant dashboard. The point is to create a chain of evidence. If conversion weakens, UX metrics should help explain whether the issue came from clarity, friction, trust, or flow design.
For teams tightening KPI definitions, this explainer on how KPIs are measured is a useful reminder that metric definitions need to be stable before comparisons become meaningful.

Technical metrics that keep the whole system honest
In digital benchmarking, the strongest baseline combines throughput, response time or latency, uptime, error frequency, and resource usage, because response time captures user-perceived performance while throughput and resource usage reveal bottlenecks that often appear only under peak demand, as described in this guide to IT system performance metrics for benchmarking.
That combination matters because single-metric benchmarking misleads. Fast average latency can hide poor error behaviour. Strong uptime can mask degraded responsiveness. High throughput can look impressive while resource strain is building underneath.
Working rule: Never benchmark speed in isolation. Benchmark speed with stability and capacity.
A clean metric set usually has one job at each layer. Business metrics show whether performance matters. UX metrics show where users struggle. Technical metrics show what the system is doing underneath.
A Repeatable 5-Step Benchmarking Framework
Benchmarking only becomes useful when it's repeatable. One-off reports are fine for meetings. They don't create operating discipline. A proper programme runs as a cycle with consistent inputs, clear comparison logic, and action attached to every gap you identify.
Step 1 Planning
Before collecting anything, define the decision the benchmark is meant to support. Are you judging release quality, conversion efficiency, operational consistency, market position, or the safety of your experimentation layer?
Scope matters just as much as intent. Teams often try to benchmark too much at once and end up with a diluted report no one trusts. Start with one business area, one product flow, or one technical layer.
Good planning usually locks down:
- The object of comparison such as pages, stores, regions, or releases
- The audience for the result including product, engineering, paid media, or leadership
- The action threshold that determines when the gap is large enough to warrant intervention
A visual model helps when you're rolling this out across functions.
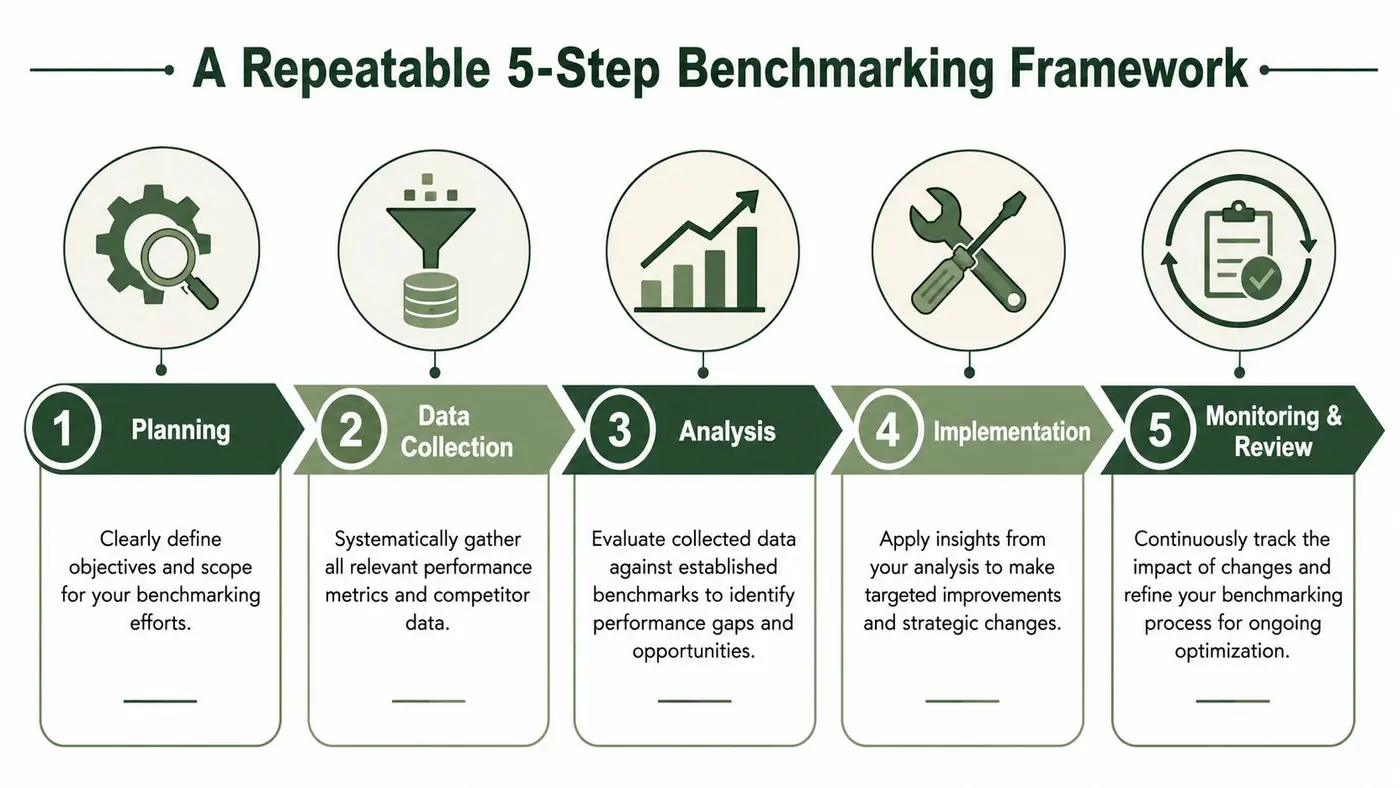
Step 2 Data collection
Teams either build trust or lose it. Collect first-party data from analytics tools, product telemetry, server logs, support signals, and test platforms. Then collect external benchmarks only where comparison conditions are credible.
The strongest external comparisons are those normalised by industry, geography, and business maturity, because raw totals often mislead. Reliable reports should clean data and compare within the same industry so the result reflects true performance gaps rather than structural differences, as noted in this overview of benchmarking types and comparison standards.
Step 3 Analysis
Analysis isn't just plotting your number against someone else's. It's checking whether the comparison is fair.
Ask hard questions:
- Are we comparing similar user groups
- Did traffic mix shift
- Was the product state stable during the period
- Did seasonality or campaign pressure distort the result
This is also the step where you benchmark under realistic operating conditions. For technical benchmarking, average load alone won't tell you much. You need peak and stressed conditions if you want a useful baseline.
A short walkthrough can help teams align on the rhythm of the process.
Step 4 Root cause analysis
A benchmark gap is only a starting point. The primary work is diagnosing why it exists.
That usually means pairing quantitative findings with direct evidence:
- Session recordings for visible friction
- Error and performance logs for technical explanation
- Experiment history for recent changes
- Funnel segmentation for audience-level differences
Cross-functional review's utmost importance becomes clear. Product managers often see prioritisation trade-offs. Engineers spot implementation constraints. CRO leads recognise where behavioural changes and delivery changes are getting mixed together.
Step 5 Implementation and monitoring
The final step is where benchmarking either becomes operational or dies as a slide deck. Each identified gap needs an owner, a change plan, and a review window.
Track whether the intervention improved the benchmark and whether it created side effects elsewhere. This closes the loop and prevents local wins from becoming system-wide losses.
Benchmarking should change the work queue. If it doesn't alter priorities, it's reporting, not management.
Benchmarking Your Experiments for Maximum Impact
Organizations often benchmark the result of experiments. Far fewer benchmark the delivery cost of the experiment itself. That's a blind spot, especially on high-traffic commercial pages where even small implementation overhead can alter user behaviour.
When an A/B testing setup is heavy, users don't experience a neutral baseline plus a variant. They experience delay, layout instability, flicker, and inconsistent rendering before the variant logic settles. At that point, the test is no longer measuring the thing you think it is.
What experiment performance benchmarking actually checks
This form of benchmarking looks at the layer underneath the hypothesis. You're not asking whether version B converted better than version A yet. You're asking whether the testing environment changed the page before the experiment even started to matter.
Useful checks include:
- SDK or script load behaviour under real conditions
- Render-blocking effects on key templates
- Visual flicker when content swaps after paint
- Impact on response and interaction feel
- Differences between tested pages and untouched controls
Those checks matter most on pages where persuasion and speed are tightly linked, such as product detail pages, landing pages, pricing pages, and checkout steps.
Why poor experiment delivery corrupts learning
A slow test setup doesn't just risk a worse user experience. It can distort the interpretation of the experiment itself.
If one audience segment is more exposed to delay, if mobile sessions experience heavier rendering cost, or if visual instability changes trust at the wrong moment, then the measured uplift or decline may reflect implementation artefacts rather than the variant idea. That creates false losers, false winners, and fragile follow-up decisions.
The practical fix is to benchmark your experimentation layer as part of release hygiene. Treat testing infrastructure like any other production dependency. If it changes rendering quality, it belongs in your performance review process.
For teams trying to improve the statistical quality of their test programme, understanding minimum detectable effect also helps. It forces better judgement about whether a test is sized to detect a meaningful difference, rather than just produce noise after a long run.
What good looks like in practice
A sound experiment benchmarking setup usually includes:
- A pre-test technical check on the target pages
- A control benchmark without the experiment layer active
- A live comparison between tested and non-tested performance conditions
- A post-test review that records both conversion effect and delivery impact
If your testing stack changes the baseline materially, your experimentation programme is grading its own homework.
That standard is worth enforcing. A faster route to insight isn't valuable if the mechanism for testing causes a subtle degradation of the thing you're trying to improve.
How to Interpret Results and Avoid Common Pitfalls
The biggest mistake in performance benchmarking isn't collecting the wrong number. It's trusting a neat comparison that isn't comparable.
Teams love clean benchmark charts because they feel decisive. But a benchmark only means something if the underlying populations, periods, and conditions are sufficiently aligned. That problem gets harder as your scale grows. A frequent gap in performance benchmarking is making comparisons statistically trustworthy across varied sites or customer mixes. In one large public example, the UK's NHS App was used by 36.4 million people in 2024/25, which shows why teams need methods that separate genuine improvement from case-mix or seasonality effects, as discussed in this example on benchmarking variation and mixed populations.
Static comparisons create false confidence
A benchmark snapshot can hide a lot:
- Seasonal traffic shifts that change intent and conversion likelihood
- Channel mix changes that alter user quality
- Product changes that affect one segment more than another
- Regional variation that makes one site look weaker for structural reasons
This is why mature teams interpret trends, not just point-in-time gaps. They ask whether the difference persists across slices, whether it appears in related metrics, and whether the comparison window is stable enough to trust.
For operators who want stronger habits here, Doczen's guide on data analytics is useful because it frames analysis as an operational discipline rather than a reporting task.
Moving benchmarks need moving interpretation
Benchmarks don't stand still. User expectations shift, device conditions change, and digital adoption keeps moving. If the market baseline rises quickly, a result that looked strong last quarter may only be average now.
That's why smart benchmarking programmes maintain more than one reference point:
- A historical baseline for internal progress
- A recent cohort baseline for current conditions
- A segmented baseline for major audience differences
When teams evaluate experiments or channel shifts, they also need a workable grasp of uncertainty. This primer on confidence intervals in statistics is helpful because it reinforces a key discipline: treat measured differences as ranges to interpret, not trophies to announce.
Strong interpretation comes from asking “what changed around the metric?” not just “did the metric move?”
That habit prevents rushed conclusions and makes benchmarking useful for decisions.
Conclusion From Benchmarks to Breakthroughs
Performance benchmarking works when it becomes part of how the business thinks, not just how the analytics team reports. It gives growth teams a shared language for judging progress, spotting gaps, and deciding what deserves attention next.
The most effective programmes do three things consistently. They benchmark the right type of comparison for the decision at hand. They choose a metric set that connects technical reality, user experience, and business outcomes. They interpret results with enough discipline to avoid false confidence.
The extra step that separates modern teams from average ones is benchmarking the experimentation layer too. It's no longer enough to ask whether tests produce lifts. You also need to know whether your testing machinery preserves the baseline experience or contaminates it.
When that discipline is in place, benchmarking stops being a retrospective exercise. It becomes a prioritisation system. Product teams use it to judge release quality. CRO teams use it to protect learning quality. Engineering teams use it to catch hidden regressions. Leadership uses it to allocate effort where the gap is real and worth closing.
That's when benchmarking starts producing breakthroughs. Not because it gives you more dashboards, but because it gives you better decisions.
If you want an A/B testing platform that helps you optimise without dragging down page experience, Otter A/B is built for that job. It's designed for lightweight experimentation, fast setup, and clear reporting, so you can test headlines, layouts, and offers while keeping a close eye on the performance baseline that matters.
Stop guessing
Ready to start testing?
Set up your first A/B test in under five minutes. No credit card required.
- 14-day free trial
- No credit card required
- Cancel anytime