Web Optimisation Services That Raise Revenue
Web optimisation services cover speed, checkout, accessibility and tests that prove revenue, not just clicks. A practical 2026 UK guide.

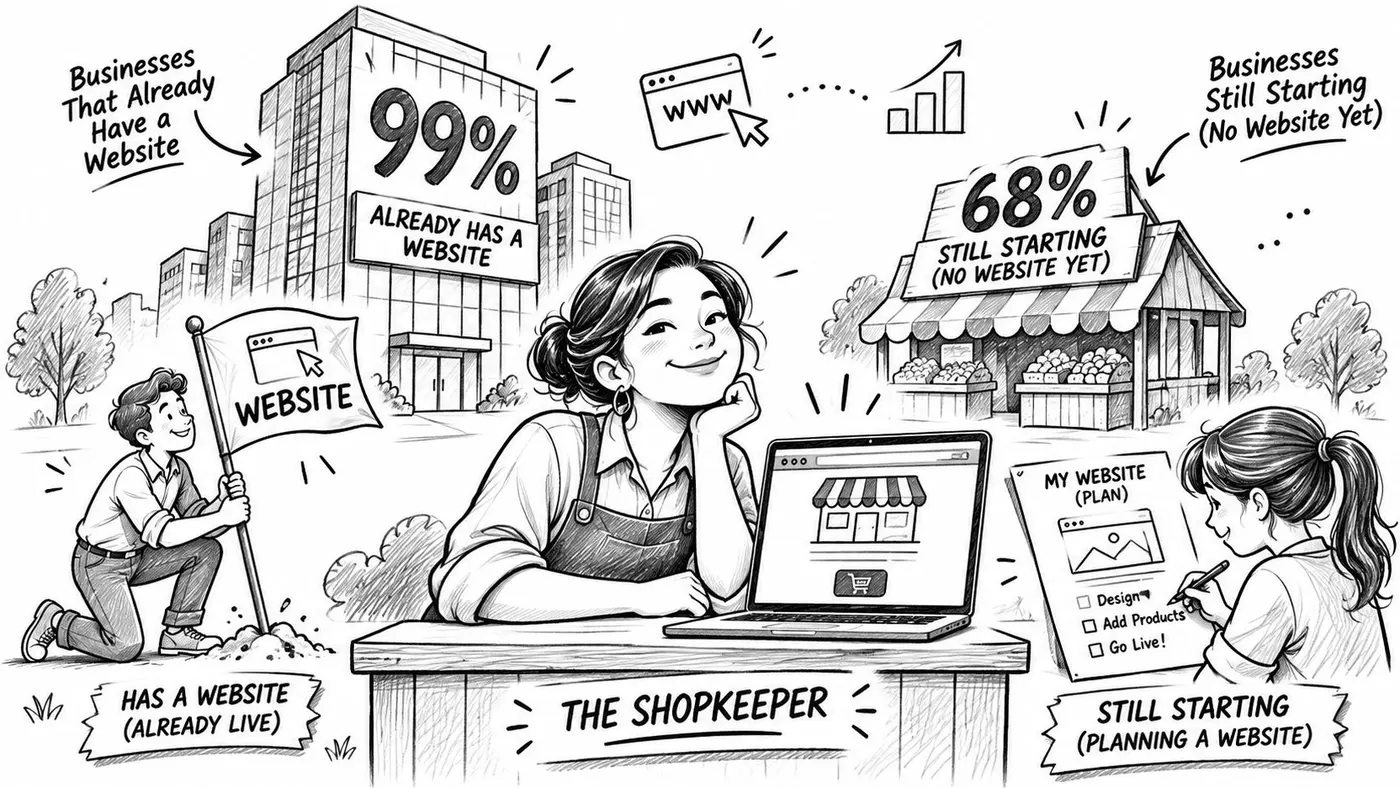
68% of UK businesses had a website in 2024, according to the Department for Science, Innovation and Technology's UK Business Data Survey 2024. Having one is settled. Making it return more than it costs is not.
That gap, between a site that exists and a site that sells, is what web optimisation services are hired to close. The work is unglamorous and specific. It's a delivery date placed above the fold, a server that answers before the shopper's thumb moves, a checkout that doesn't lose the basket at the payment step, and a button a screen reader can name out loud.
One standard runs through everything below. A higher conversion rate is not a win by itself. It's a win when revenue per visitor rises, when the mobile journey improves rather than just the desktop one, and when the visitors a new layout excludes can still finish what they came to do. Anything short of that is a prettier page with a launch email.
Why a Website Still Loses Sales
The headline adoption number hides a wide split. The same Department for Science, Innovation and Technology survey breaks website ownership down by business size, and the spread runs from near-universal to roughly two in three: 99% of large businesses, 97% of medium-sized businesses and 93% of small businesses reported having a website, against 74% of microbusinesses and 65% of sole traders.
Those two ends of the spread are buying different work. A large retailer with thousands of SKUs and an in-house team doesn't need a new website; it needs the one it has to work harder at the points where it currently leaks sales. A sole trader setting up for the first time has no funnel to repair yet, so the sensible spend is on getting the template, the price list and the enquiry form right at launch.
A website works like a shop on a busy street. Traffic is the people walking past. Optimisation is whether the door opens without a shove, whether the labels tell the truth about the price, and whether the till takes the card the customer is holding. You can buy more footfall all day and still sell nothing if the door sticks.
The one-minute test: if a customer on a phone can't find your number, read your prices and pay you inside a minute, the site isn't finished, whatever it looks like.
The leaks are rarely where owners look first. A faster homepage earns nothing if the mobile checkout still drops baskets at the payment step. A higher conversion rate earns nothing if average order value falls with it, or if the new layout locks out shoppers who use a keyboard. Each failure has a different cause, a different fix and a different number that proves the fix paid.
The Work Web Optimisation Services Cover
Web optimisation services are scheduled, measured changes to a live site so that more of the right visitors complete a valuable action. Not a rebuild handed over at launch, and not a traffic campaign. The site stays up while it changes, and every change carries one number that should move plus one number that must not fall.
What web optimisation services are hired to change
Service area On-site change Metric to move Proof question Speed and stability Response time, images, scripts and layout LCP, INP, CLS, TTFB at the 75th percentile Did UK mobile users get faster without a layout jump? Findability Titles, internal links, templates Indexed pages and qualified entrances Are the money pages the ones people land on? Journey design Navigation, product facts, calls to action Progression to cart or lead form Did more people reach the next step? Checkout and forms Steps, errors, delivery and payment clarity Completion, average order value, revenue per visitor Did completed orders stay profitable? Accessibility Names, contrast, headings, keyboard order Task completion with keyboard and assistive tech Can someone finish without a mouse? Experimentation Hypothesis, split, goal, sample Significance and revenue by variant Was the winner real, or only more clicks?Read that table right to left. The proof question in the last column is what you're buying, and it's the question to put in the brief before anyone touches the site.
Where the money usually leaks
The rows aren't equally urgent for every business, and a provider who quotes for all six at once is selling a package rather than a diagnosis. Match the row to the symptom you already see.
- People arrive and leave immediately: brief speed and stability, with the 75th percentile on UK mobile as the target, not the sitewide average.
- People browse but never reach a product or form: journey design and findability, in that order, since a well-built page nobody lands on changes nothing.
- People reach the basket and stop: checkout and forms, plus trust signals such as delivery dates and payment options.
- Orders complete but revenue doesn't move: average order value and revenue per visitor, which belong in the same conversation as completion rate.
Findability is the row most often handled by a different specialist, because it's template and indexation work rather than page design. If the money pages aren't the pages people land on, technical SEO services from AY Rank cover titles, internal links and indexable templates as a standalone piece of the job.
Write the brief around two rows, not six. Name the leak, name the metric, and name the commercial number that must not fall. Providers can then price a diagnosis instead of a redesign.
Every row above should report segmented at least by device. An aggregate figure can improve while the mobile experience gets worse, and mobile is where the impatient, one-handed shopper is standing.
Speed That Leaves Room to Convert
Speed is a budget, not a score. A score is something you report at the end of a project. A budget is what a shopper's phone can afford to spend between tapping a link and seeing something worth tapping, and the useful question is how much of it is left over once the page has finished loading.
The UK government website is a reasonable benchmark for what healthy looks like, because its timings are measured with real visitors rather than in a lab.
Real-user measurements for that site show approximately 661 ms Largest Contentful Paint, 95 ms Interaction to Next Paint, 0 Cumulative Layout Shift and 257 ms Time to First Byte, all substantially inside the commonly used good thresholds, as recorded in DebugBear's comparison of government website speed. Copying those numbers isn't the goal. Seeing how much room is left when a page is comfortable is.
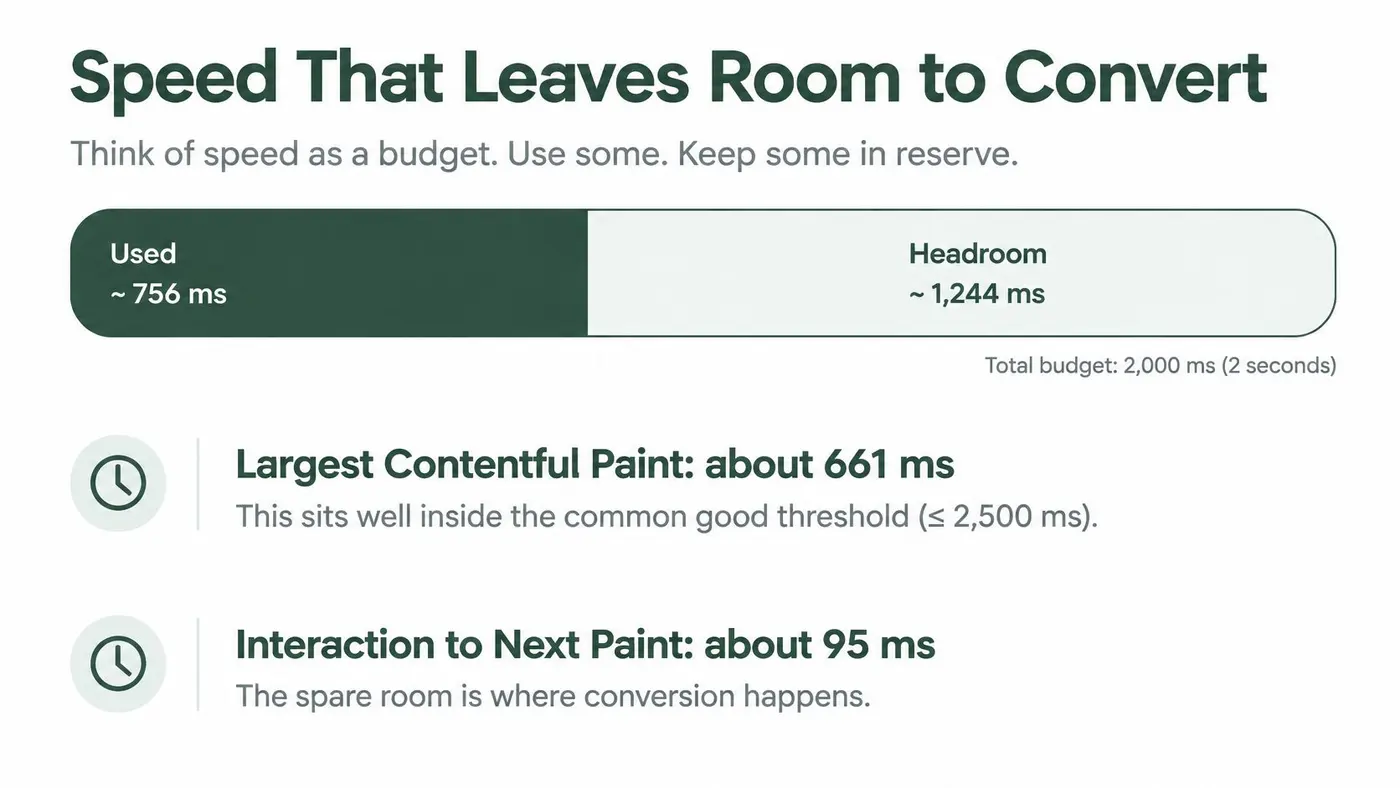
The four timings form a chain rather than four separate marks. A low time to first byte is the kitchen starting the order early, so rendering still fits inside the loading budget. A low interaction delay is the till responding the moment someone taps. Zero layout shift is the button staying where the thumb expected it, which prevents mis-taps, re-reading and displaced calls to action.
Metric Real-user figure What it protects Largest Contentful Paint 661 ms Rendering still fits the loading budget Interaction to Next Paint 95 ms Taps are handled without added input delay Cumulative Layout Shift 0 Buttons stay where the thumb expected Time to First Byte 257 ms The server starts early enough for renderingThree rules for implementation
- Segment at the 75th percentile on UK traffic. An average hides the slow mobile users and the patchy regional networks, and those are the people who abandon.
- Track server time separately from client rendering. If TTFB is high, no amount of image compression will rescue the page, and if TTFB is low you know where the remaining delay sits.
- Reserve space for images and dynamic modules, and defer non-essential JavaScript. Layout shift and input delay are usually caused by something arriving late, not by something being large.
Treat every new tag and experiment script as a suspect until it has been measured in production against LCP, INP and CLS. Agree the rollback threshold before the code ships, not during the argument afterwards.
Agree the rollback line in writing: if LCP at the 75th percentile on mobile rises past the threshold you set, the script comes out the same day, no discussion needed.
A lab score can guide a build, and Core Web Vitals optimisation is the natural follow-on reading for the measurement detail. It can't replace field data from the people who buy. A page that scores well in isolation and feels sluggish on a train is still losing orders.
A UK Retail Journey in Numbers
Online sales accounted for 28.0% of total retail sales in Great Britain in September 2025, up from 27.8% in August. Online spending was 5.6% higher than in September 2024, according to the Office for National Statistics retail sales bulletin. More than a quarter of retail sales value was coming through online channels.
That makes small improvements worth measuring in pounds, not just percentages. A rise in conversion can still reduce revenue if it comes with a lower average order value or weaker checkout completion on mobile.
Three stages, three published figures
A shopper moves through several decisions before paying. In 2025, the UK e-commerce add-to-cart rate was 9.5% to 10.0%, according to ECDB's UK market transaction data. That is roughly nine or ten shoppers in every hundred adding an item to their basket.
For the next stage, the average UK e-commerce checkout converted 58% of shoppers who reached it in 2024, according to the IMRG and Ecommpay study reported in Compare Card Fees' UK ecommerce payment statistics. The table separates published figures by journey stage, so each rate can be read in context.
Journey stage Published figure Period Online share of retail sales 28.0% September 2025, Great Britain Online spending versus a year earlier 5.6% higher September 2025 versus September 2024 Add-to-cart rate 9.5%–10.0% 2025, UK e-commerce Checkout conversion among those who reach it 58% 2024, UK e-commerceUse these figures as reference points, not targets. A £12 accessory and a £1,200 sofa can attract different add-to-cart rates because shoppers weigh the purchase differently.
Compare your own funnel stage by stage. If add-to-cart is near the published range but mobile checkout performs less well, investigate the payment journey and the information shoppers need to trust it. If few visitors reach product pages, prioritise speed and findability before changing checkout. A test is a commercial win only when the improvement carries through to revenue, without harming order value or the mobile journey.
Accessibility So a Reported Win Is Real
A UK study of 115 ecommerce sites found that 97.4% had at least one critical or serious accessibility issue, with an average of 38.4 issues per site, as set out in the State of UK Ecommerce Accessibility report. The sample wasn't random, so read it as an engineering risk indicator rather than a national rate. Almost every site in a review of real shops carried at least one blocking fault.
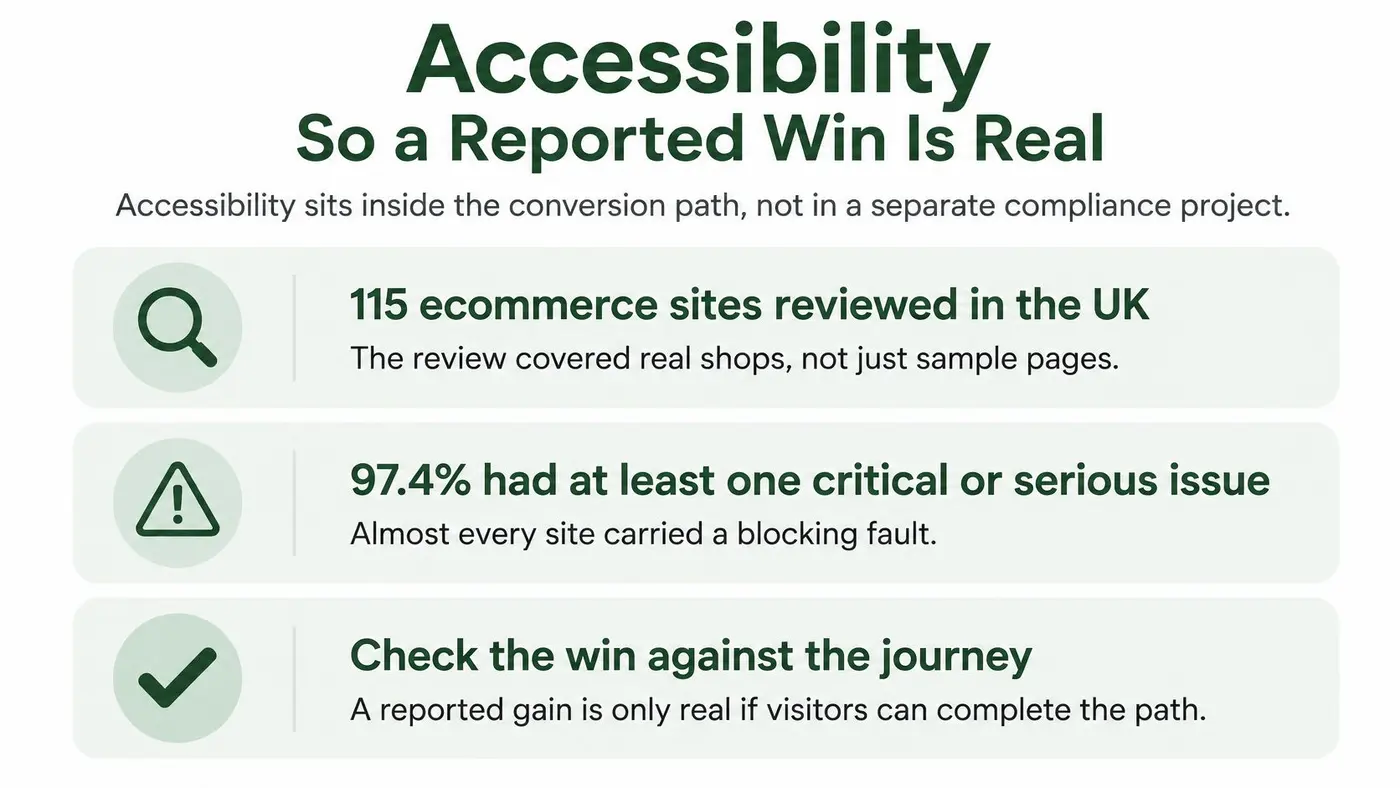
The defects that show up most often in UK retail audits are also the ones that break the exact journeys an optimisation project is trying to improve.
- Buttons and links without accessible names. A screen-reader user hears nothing useful where the call to action should be, so the primary path disappears.
- Weak colour contrast. Text that reads fine on a desktop monitor becomes guesswork on a phone held in daylight.
- A broken heading order. Someone navigating by headings loses the page's structure and has to plough through the whole document.
- Images with no text alternatives. Product details and delivery promises vanish for anyone who can't see them.
- Navigation regions with no label. Keyboard users cycle through menus with no idea which one they've landed in, and some get stuck there.
Three habits on every redesign and every experiment
First, run automated audits alongside a manual keyboard pass. Automated tools catch contrast and missing names; only a person tabbing through the checkout finds the trap. Second, check WCAG 2.1 AA at component level, including the variant's own markup, so a winning layout doesn't ship with unnamed buttons. Third, watch the funnel by device and by interaction signals that hint at keyboard or assistive use, because an aggregate uplift can exclude the people who can't finish.
A variant that lifts conversion by excluding users hasn't lifted anything. It has moved the same failures onto the people least able to complain about them.
This connects directly to the fundamentals of poor web design: structure, labels and contrast aren't decoration, they're the plumbing of the journey. Test accessibility as part of conversion, and a reported win is one you can defend.
Tests That Follow the Money
The assumption worth challenging is the one many teams carry into a monthly review: that the variant with the highest conversion rate wins. It doesn't always, and the cases where it fails are the expensive ones.
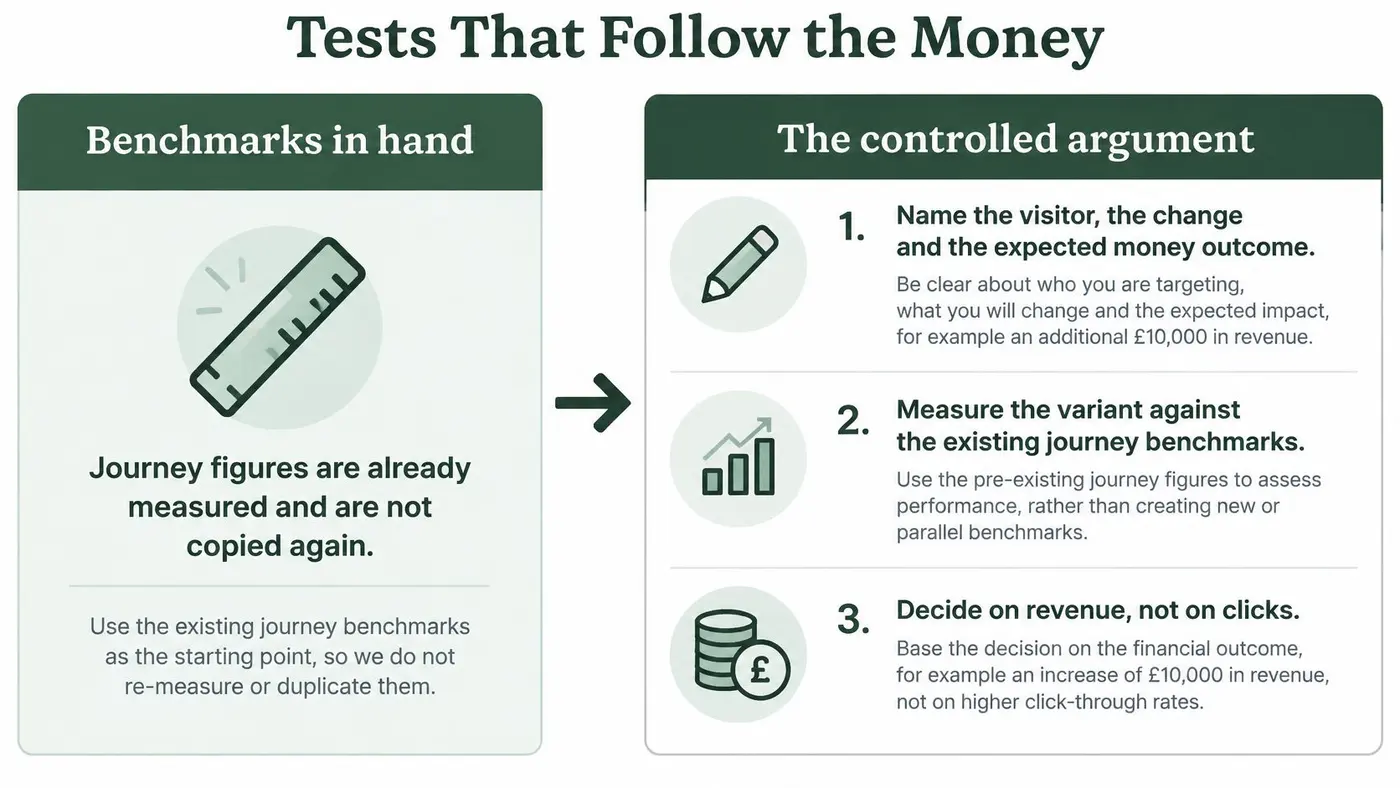
- Name the visitor, the change and the expected money outcome. "Mobile shoppers arriving from paid search see a delivery date next to the price, which raises revenue per visitor." A hypothesis that names no visitor can't be segmented later.
- Split traffic so both versions see the same mix. New and returning people, devices and sources should be spread evenly, otherwise you're comparing two audiences rather than two pages.
- Score purchases or qualified leads, and report three numbers side by side. Completion rate, average order value and revenue per visitor belong in the same table. Recent UK benchmark data shows mobile abandonment above desktop, and single-page checkout completing more often than multi-page, which is exactly why a higher rate can't be crowned alone: a flow that finishes more often can still finish smaller.
- Set the stop rule before you start. A frequentist read at 95% confidence is a defensible line, and when rate and revenue disagree the honest outcome is no winner yet, not the number you prefer.
- Segment by device, source, new versus returning and product category. The aggregate hides the mobile result you were trying to fix.
Test trust signals, payment presentation, delivery clarity and error recovery alongside page length. Shortening the checkout is one hypothesis, not a law of nature.
Otter A/B is built around this argument rather than around clicks: it reports conversion rate, average order value and revenue per visitor side by side for each variant, and when those readings disagree it says so instead of declaring a winner. The wider discipline of choosing what to test is covered in this guide to A/B testing strategy, which is worth reading before you size the first experiment.
The question to ask after every test: did this create profitable growth, or just more orders?
Brief the Work and Start One Test
You can send a brief this week without a research budget. Six lines do the job.
- Name the page and the device where the leak shows. Weak add-to-cart points at speed and findability; mobile checkout lag points at trust, delivery clarity and payment presentation.
- Name the metric and the number that must not fall. Usually revenue per visitor, or qualified leads if you sell a service rather than a product.
- Ask which single hypothesis the provider would run first, and what result would make them stop. An answer you can't follow is an answer you can't manage.
- Keep the change small. One headline, one call to action or one trust block on the mobile template that already loses people. Bigger changes take longer to read and harder to attribute.
- Check the field before you call a result. Look at LCP, INP and CLS at the 75th percentile on mobile traffic, and tab through the variant by keyboard so the new layout doesn't trap checkout.
- Ship only when revenue agrees with the rate. Not because the page looks newer, and not because a dashboard turned green on clicks.
If you're running the test yourself, size it before it ships. Otter A/B publishes a free Sample Size Calculator, Significance Calculator, Duration Calculator, Conversion Rate Calculator, Image Compressor and Hypothesis Generator, and its visual testing runs unlimited variants with precise traffic splits from a one-line install and no developer handoff. The snippet works with any website, CMS or framework and needs no build step.
Otter A/B runs the kind of test this article argues for: it splits traffic on your existing site, reports conversion rate, average order value and revenue per visitor side by side for each variant, and when those readings disagree it tells you rather than crowning a winner on clicks. Size the first experiment with the free calculators, then run it on Shopify, WordPress, Webflow or a custom stack with a one-line install. Start free at Otter A/B and let the revenue number, not the design review, decide what ships.
Stop guessing
Ready to start testing?
Set up your first A/B test in under five minutes. No credit card required.
- 14-day free trial
- No credit card required
- Cancel anytime