How to Set Up Uptime Monitoring for Web Services
Discover how to implement uptime monitoring with core metrics, alerting strategies and dashboards to keep your services reliable and conversion data clean.
A flash sale goes live, the homepage stays green, and the dashboard still says everything is fine. Then orders begin stalling in checkout, a payment API misbehaves for some users, and the first warning sign is a weak conversion report. That is the trap with uptime monitoring. A page can return a neat 200 OK and still fail the people trying to log in, pay, or submit a form.
For UK-facing web services, the stronger setup is usually a layered view that catches availability, correctness, and user journey failures before they contaminate operations or experiments. A single response code only proves that one door opened. It does not prove the whole building is safe to use. That is why teams often pair an HTTP(S) check with second-layer checks such as DNS, SSL, or heartbeat monitoring, so they can see whether the service is healthy end to end.
Understanding Key Concepts
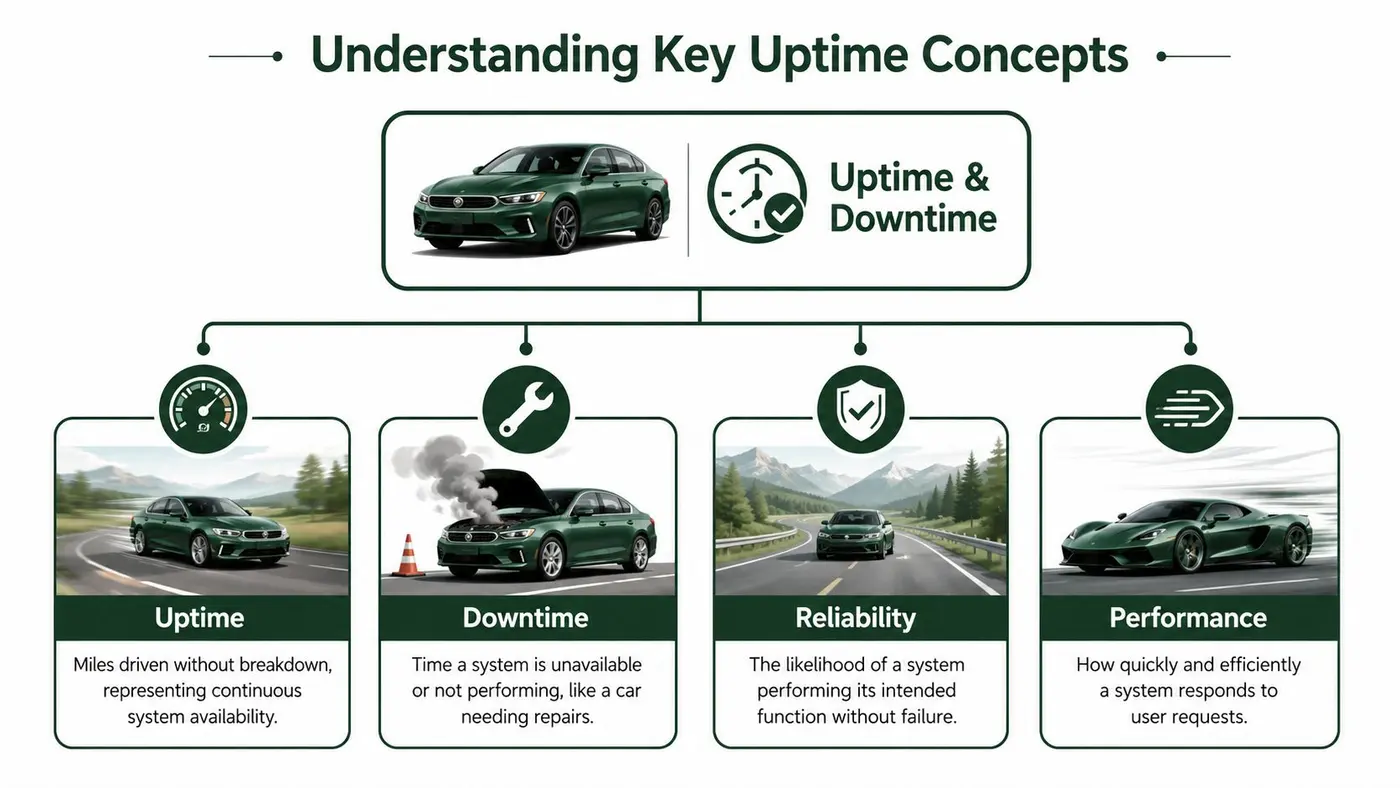
A good reliability setup starts with the plain meaning of the words, because teams often mix them up. Uptime is the time a service keeps working as expected. Downtime is the time it doesn't, whether that means a full outage or a partial failure that breaks a key path. The simplest analogy is a car: if it keeps driving, that's uptime. If it's in the garage for repairs, that's downtime.
Uptime and downtime in business terms
For a website, uptime isn't just “the homepage loads.” A checkout flow, login page, or form submission can fail while the rest of the site still responds. That's why the most useful monitoring treats the service as something users depend on, not just a server that can answer a request.
Reliability is the likelihood that the service will keep doing its job without failing. Performance is how quickly and smoothly it does that job. Think of a car that starts every morning, but accelerates badly and stalls on hills. It's technically running, but it's not reliable in practice, and it's not performing well either.
SLA, SLO, MTTR, and MTBF without the jargon
An SLA is the promise made to a customer or partner. An SLO is the internal target that supports that promise. If you run a customer-facing service, the SLA is the contract language, while the SLO is the operational target your team works towards.
MTTR, or mean time to repair, is the time it takes to restore service after a failure. MTBF, or mean time between failures, describes how long a service tends to run before the next incident. You don't need to memorise the acronyms to use them well. You just need to understand the direction each one points. Lower MTTR usually means faster recovery and less damage during incidents. Better MTBF usually means fewer interruptions in the first place.
Practical rule: map every customer-facing SLA to a business outcome, not just a technical metric. If checkout is down, the problem isn't only that a monitor failed. It's that customers can't complete a purchase, and that can distort reporting, support volume, and conversion analysis.
Why these definitions matter for teams
Newer teams often get confused. They assume a service is either up or down, then they discover that a service can be half broken, regionally broken, or broken only for logged-in users. A healthy monitoring model helps you separate those cases before they become arguments in incident review.
That distinction also helps CRO and growth teams. If a checkout or sign-up issue is treated as “just a web glitch,” experiment data can end up mixing real user intent with outage noise. Once that happens, the numbers stop telling a trustworthy story.
Comparing Monitoring Approaches
A service can look healthy from one angle and still fail from another. That is why synthetic checks, real-user monitoring, and heartbeat or agent-based checks are best treated as separate lenses on the same system. Each one answers a different question, and a solid monitoring setup uses all three instead of trusting a single signal.
Synthetic checks catch broken workflows early
Synthetic checks run scripted requests from controlled locations. They are useful because they can target a specific path on purpose, such as a homepage, login flow, or checkout step. That makes them a strong early warning tool when a page still loads but the workflow behind it has stopped working.
They also help with correctness, not just reachability. As noted in the UptimeRobot monitoring types guide, a single HTTP(S) availability check should be paired with another layer of monitoring, such as DNS, SSL, or heartbeat checks, because one response code does not prove the full service is healthy.
Real-user monitoring shows what visitors actually experience
Real-user monitoring, or RUM, collects data from actual browsers. That makes it valuable when the question is not only “did the endpoint answer?” but also “what did users see?” If a page renders slowly, throws front-end errors, or behaves differently by device, RUM is often the first place those problems appear.
RUM is especially useful for CRO and growth teams because it reflects the user journey as it really happened. A checkout path may still look fine in a lab test while real visitors hit layout issues, script errors, or timing problems that distort conversion analysis and A/B test results.
The main limit is that RUM depends on real traffic. If traffic drops or a path is rarely used, the signal may arrive slowly or look incomplete. That is why RUM works best beside synthetic checks, not as a replacement for them.
Heartbeat and agent checks confirm infrastructure health
Heartbeat checks serve a different purpose. They are used when a server, worker, or background job needs to report “I'm alive” on a schedule. If the heartbeat stops, the monitoring system knows something is wrong even if the public website still appears fine.
That matters for queues, scheduled jobs, and internal services that do not have a neat public page to probe. It also catches failures deeper in the stack than a browser test would ever see, such as a stuck job runner or a process that stopped sending data.
A single green check can hide a lot. If you only watch the surface, you miss DNS oddities, certificate problems, and partial rendering failures that users notice long before a basic probe does.
Why layering matters for UK-facing services
For UK-facing uptime monitoring, the practical pattern is to use at least two monitors per critical system, one for availability and one for correctness. That pairing helps a team separate “the service answered” from “the service worked for a user.” The same idea is especially useful for CRO and growth teams that need clean analytics during outages, because a checkout failure can pollute experiment data even when the homepage still loads.
A balanced setup also uses intervals and timeouts that match the risk of the service. Faster checks fit customer-facing paths, while slower checks can be enough for lower-priority systems. The goal is to catch the failure chain early without turning the alert stream into background noise.
Designing Alerts and On Call Practices
A monitor that pages everyone for every hiccup stops being trusted very quickly. The trick is to tune alerts so they're sensitive enough to catch real incidents, but calm enough that people don't mute them out of frustration. For UK services, a common expert baseline is a 1-minute production interval, with 30-second checks for critical paths and 2 to 3 consecutive misses before escalation (Uptime Monitor best practices).
Start with the service, not the alarm
The right threshold depends on the endpoint. Payments, authentication, and core APIs deserve faster checks than a static blog page or a back-office report. A 30-second check can make sense for a checkout flow, while a 5-minute interval is often enough for non-critical services. The key is to match the monitoring speed to the actual business risk.
Use confirmation rules to cut false alarms
Consecutive-failure logic matters because networks are noisy. One failed probe may mean nothing. Two or three failures in a row are more likely to signal a real issue. That's why the guidance above recommends 2 to 3 consecutive misses, which keeps the system responsive without making it jumpy.
UK teams also need to think about probe location. A region-specific routing issue can look like a global outage if you only test from one place. Multi-region checking helps separate local network noise from a genuine service failure, especially for traffic that's concentrated in the UK but still served globally.
Useful habit: if an alert fires, the first question shouldn't be “who gets paged?” It should be “what failed, from where, and did more than one signal confirm it?”
Build escalation around human attention spans
On-call works when every step is clear. First-line alerts should go to the people who can verify the issue quickly. If they can't resolve it, the incident should escalate to the next owner without forcing everyone to stay glued to the screen. That's where a clean rotation and well-defined ownership matter.
For teams that coordinate releases and incident response, it helps to separate monitoring duties from deployment duties. A clear release process reduces confusion when someone needs to decide whether a new build, a config change, or an upstream dependency caused the problem. If you want a useful companion read on that operational split, see this release management guide.
Keep experiment noise out of incident response
This part matters for growth teams. If a payment path or sign-up flow is being tested during an outage, client-side errors can pollute experiment readings. When you use tight thresholds and consistent escalation rules, you're not just protecting uptime. You're also protecting data quality, which keeps incident response separate from A/B testing interpretation.
Implementation Checklist and Practical Examples
A workable setup starts with a short, disciplined inventory. List the endpoints that matter, then decide which ones need public checks, internal checks, or both. From there, choose monitoring regions that match your traffic footprint, define the notification path, and document who owns each alert.
A practical setup checklist
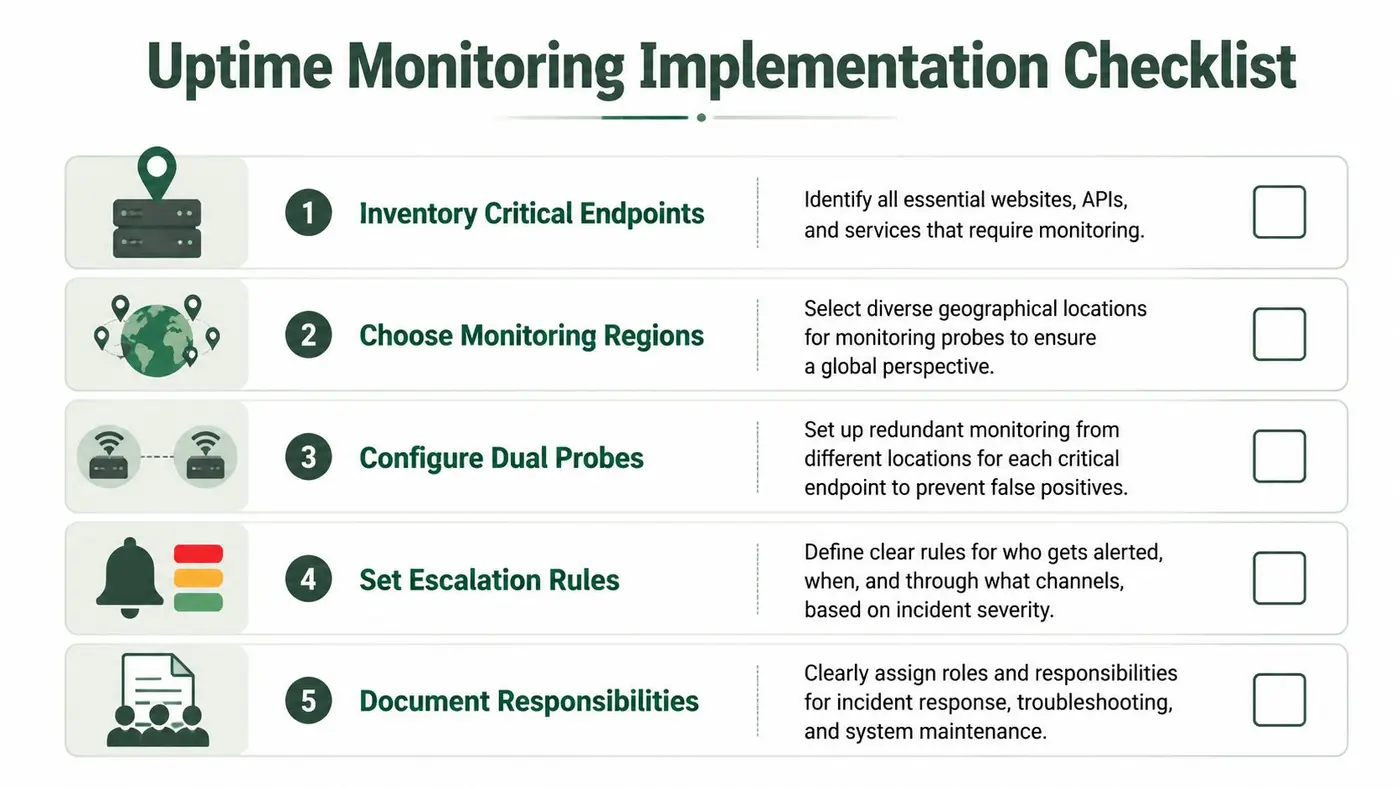
- Inventory critical endpoints. Identify the homepage, login flow, checkout, API routes, and any background services that must stay healthy.
- Choose monitoring regions. Pick probe locations that reflect where users come from, then add coverage that can spot routing or regional issues.
- Configure dual probes. Pair an availability check with a second signal, such as content matching or a heartbeat, so you don't trust a single response code too much.
- Set escalation rules. Decide who gets notified first, who gets notified second, and which failures are noisy enough to ignore until they repeat.
- Document responsibilities. Make it obvious who checks the dashboard, who investigates, and who communicates with stakeholders.
The best way to keep this sane is to treat each monitor like a question. Does the service exist? Does it behave correctly? Does the user journey still complete? If a monitor can't answer one of those questions, don't pretend it covers the system.
Example one, HTTP check with content validation
A basic HTTP probe is a good starting point, but it shouldn't stop at “the endpoint answered.” Use the response body, headers, or status text to confirm the service is healthy.
curl -fsS https://example.com/health | grep -q '"status":"healthy"'
That command is simple on purpose. It checks that the endpoint returns a successful response and that the payload contains the expected health signal. If the page returns an error message wrapped in a 200 response, this catches the mismatch.
If you're using a hosted monitor rather than shell scripts, the same idea still applies. A check that validates response content is stronger than one that only watches a status code, because it catches pages that are technically reachable but functionally broken.
Example two, heartbeat monitoring for background services
Heartbeat monitoring works well for jobs that can't be judged from the outside alone. A queue worker, scheduled task, or internal synchronisation process can send a periodic signal to show it's still alive. If the heartbeat stops, the system can alert before customers notice missing work.
A simple agent-based pattern looks like this in practice:
monitor:
  name: background-worker-heartbeat
  type: heartbeat
  interval: 1m
  timeout: 10s
  consecutive_failures: 3
The important detail isn't the syntax, it's the logic. The agent reports on a schedule, the timeout stays short enough to surface trouble, and consecutive failure handling keeps brief hiccups from waking the whole team.
You can cross-check implementation details against the deployment guide when you're wiring monitors around release events, because teams often want alerting to reflect new releases, not just steady-state operation.
Two common pitfalls to avoid
One pitfall is over-monitoring everything at the same speed. That creates noise and burns attention. Another is checking only from one region, which can hide the difference between a local routing issue and a broader service problem. Both mistakes are fixable if you start small, validate one critical path at a time, and add coverage carefully.
Integrating Uptime Monitoring With Experimentation and Analytics
A conversion dashboard means very little if the service was unstable while the test ran. That's the core reason uptime data belongs inside experimentation and analytics workflows, not just inside ops dashboards. A frequently under-answered angle is whether uptime monitoring should be treated as a user-journey problem rather than a simple site up/down check, combining flow validation like login and checkout with performance metrics such as TTI and LCP (PerkyDash on why uptime is not enough).
Treat outages as data quality events
If a checkout path fails during an A/B test, the result set is no longer clean. One variant might appear worse because more users encountered the outage window. That doesn't mean the page lost. It means the experiment was exposed to a service problem.
The cleanest approach is to tag experiment data with uptime state. If monitoring shows an incident, you can mark the affected period, exclude those sessions from the final readout, or at least interpret the result with caution. That is much safer than letting outage noise sit inside a conversion report.
Tie journey checks to key experiment paths
For CRO teams, synthetic monitoring should mirror the paths that matter most to the business. If the main question is whether users can complete checkout, then checkout should be monitored as a flow, not just as a reachable URL. The same applies to login, account creation, lead capture, and any step where client-side behaviour can break the user experience without breaking the page load.
That approach pairs naturally with A/B testing best practices from Figr's guide, especially the parts around clean test setup, clear goals, and avoiding contaminated results. The main idea is simple. A test can only be trusted if the service stayed stable enough for the comparison to mean something.
Use analytics to separate product issues from infrastructure issues
When uptime events flow into your reporting, analysts can ask better questions. Did conversion drop because the variant underperformed, or because the payment step failed for a slice of visitors? Did a new release change the page, or did an incident distort the cohort?
That's also where operational visibility helps. If the reporting layer shows both experiment status and service health, product managers can stop arguing from incomplete screenshots. They can see whether a sudden change is an actual product signal or a reliability problem wearing a product-shaped mask.
For teams that want a clean reporting layer, real-time reporting patterns are especially useful because they help line up operational events with test timelines. The point isn't to flood everyone with more charts. It's to make the timing of incidents visible enough that people can trust the numbers again.
Make a simple decision rule
A useful internal rule is this. If the service was unstable during the test window, the result needs review before anyone calls a winner. That doesn't mean every blip invalidates every test. It means uptime context should be part of the decision, not an afterthought.
Sample Dashboards and SLAs for Uptime Monitoring
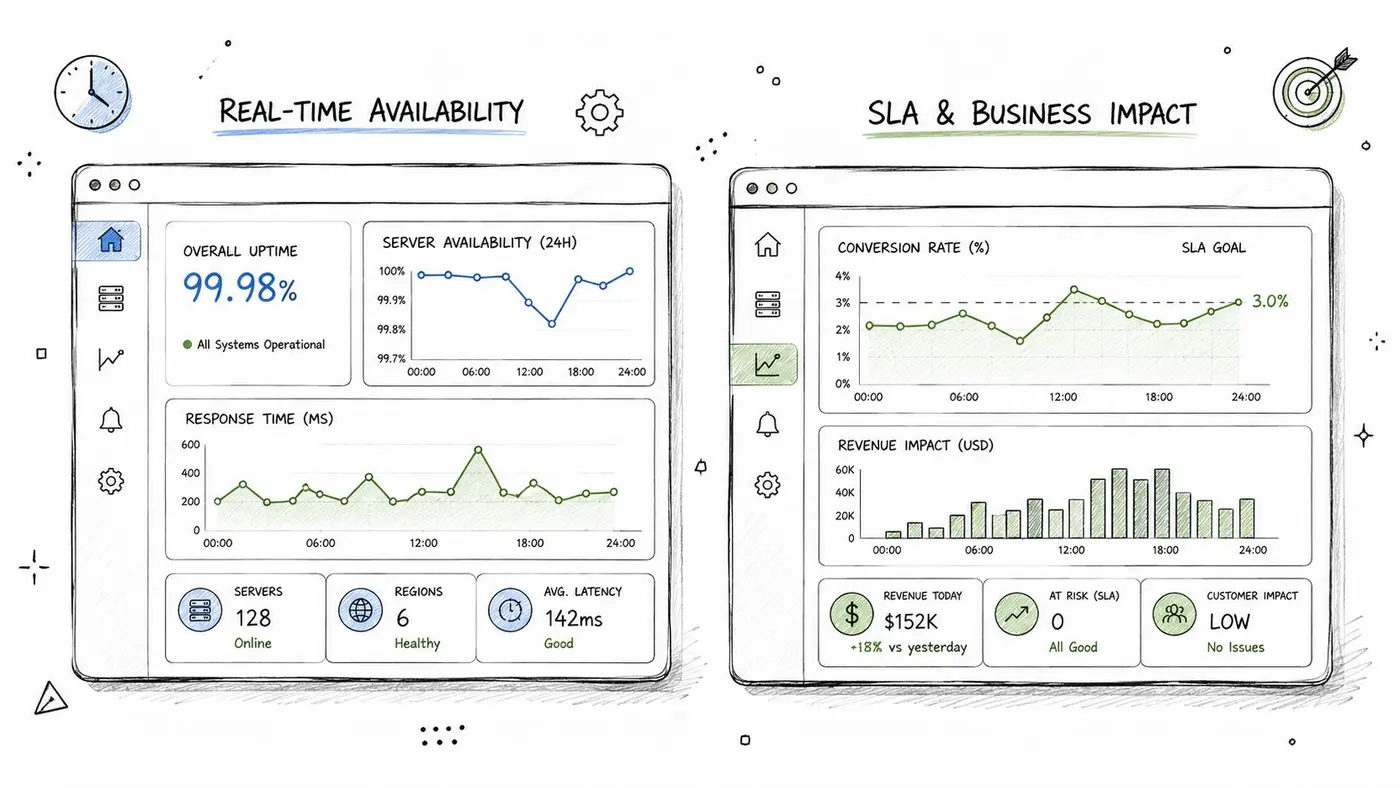
Dashboards work best when they answer one question per view. A reliability dashboard should show whether the service is available now, whether it has been stable over time, and whether the team is responding quickly enough when things go wrong. If you also care about revenue, the dashboard should make that business link visible too.
A dashboard for operations
The first mockup should focus on live health. Put the current pass or fail state at the top, then add response time, incident count, and any recent failures that need triage. That view is for the on-call engineer or site reliability lead, so it should answer “what's broken?” without extra scrolling.
Use one panel for availability and another for correctness. A service can be reachable but still serve the wrong content, which is why content checks and journey checks deserve their own space. If a dashboard only shows green or red, it hides the nuance that helps engineers act quickly.
A dashboard for business and SLA tracking
The second view should connect service behaviour to customer outcomes. Show the SLA target, the current service state, and a clear business metric such as completed orders or lead submissions. The exact metric depends on the service, but the reason is always the same. Reliability is easier to defend when stakeholders can see how outages affect the business.
A solid SLA template should include the objective, the monitoring method, the review cadence, and the incident ownership model. It should also state what happens when the target isn't met. That part matters because an SLA only works if the team knows how to review it after real incidents, not just file it away.
For teams looking at the underlying plumbing behind those dashboards, real-time monitoring system architecture is a helpful companion resource because it frames how alerting, metrics, and live views fit together.
Keep the template readable
Don't overload the dashboard with every metric you can measure. If the screen becomes a wall of widgets, nobody will use it during an incident. Start with the few signals that drive action, then expand only when the team can explain why a new metric changes a decision.
Troubleshooting and Next Steps
When an uptime setup starts causing more confusion than clarity, the problem is usually in the monitoring design, not the incident itself. The failure modes are predictable, and reliability teams can usually trace them back to a few choices: checking too often, checking too slowly, or checking only one layer of the service. A login page can return a healthy response while the checkout flow is broken, so a single probe only tells part of the story.
Common failure patterns to watch for
A monitor can fail in subtle ways that are easy to miss. Narrow region coverage hides geography-specific issues, especially when one location is healthy and another is not. Long timeouts push the alert past the moment when users first notice the problem. Loose escalation rules send the page to the wrong queue, and then nobody feels responsible for the fix.
Another common problem is giving every alert the same weight. A brief blip and a real outage do not deserve the same response, because the team stops trusting the signal when low-value alerts keep arriving. Keep thresholds explicit, confirm failures before escalating, and review false alarms after each incident so the system becomes calmer and easier to trust over time. That review loop matters for CRO and growth teams as well, since a noisy alert stream can make it harder to tell whether a checkout drop is a service issue, an experiment effect, or a reporting gap.
Where to go next
Once the basic monitors are stable, add user-flow checks for the journeys that matter most, such as signup, checkout, and lead submission. Those checks help show whether the site is merely reachable or usable, which is the difference between green infrastructure and healthy customer experience. Then connect those checks to analytics and experiment reporting so outages do not distort A/B test reads or hide data integrity problems.
Sub-minute monitoring can help when customer impact appears quickly, but it also raises alert fatigue and cost if probe locations are weak or confirmation rules are too loose. The trade-off depends on where failure is likely to appear first and how much confidence the team needs before paging someone, as noted in UptickNow on uptime monitoring trade-offs. Faster checks belong on the journeys that carry immediate business risk, while slower checks can stay in the background for services where a short delay does not change the decision.
If the goal is to make uptime monitoring useful for engineers, CRO teams, and stakeholders, start by auditing the highest-value journeys, then connect those checks to reporting and incident review with Otter A/B.
Ready to start testing?
Set up your first A/B test in under 5 minutes. No credit card required.