A B C Test
A/B c test. Learn the difference between A/B and A/B/C testing, when to use multiple variants, and how to calculate sample size and significance

An A/B/C test compares three mutually exclusive variants in one experiment, while sequential A/B testing runs one two-variant experiment after another. In the UK dataset of 2,408 tests, only 17.4% produced a statistically significant winner and 74.2% were inconclusive or showed no detectable difference, so adding a third option without planning for extra uncertainty is a costly mistake.
That's the situation many teams face after a promising A/B test. The green checkout button is ahead of blue, someone suggests adding red, and the change looks so small that nobody expects the statistics to change. But an A/B/C test isn't three A/B tests running side by side. It's a different experiment, with more comparisons, greater sample requirements, and more opportunities to mistake noise for a genuine improvement.
The distinction matters because an experiment should produce a decision you can trust, not just a dashboard that displays a winner. This guide explains when a three-variant test makes sense, when sequential A/B testing is safer, and how to design an A/B c test without letting complexity outrun the value of the insight.
Why Adding a Third Variant Changes Everything
Your checkout team has tested a blue button against a green one. Green is ahead, and the result looks encouraging. Before rolling it out, a designer proposes a red version, arguing that urgency might make it even stronger.
At first glance, the plan seems harmless. Keep blue, keep green, add red, and see which colour wins. The problem is that the team is no longer answering one comparison. It's asking which of three variants performs best, while making several pairwise comparisons at the same time.
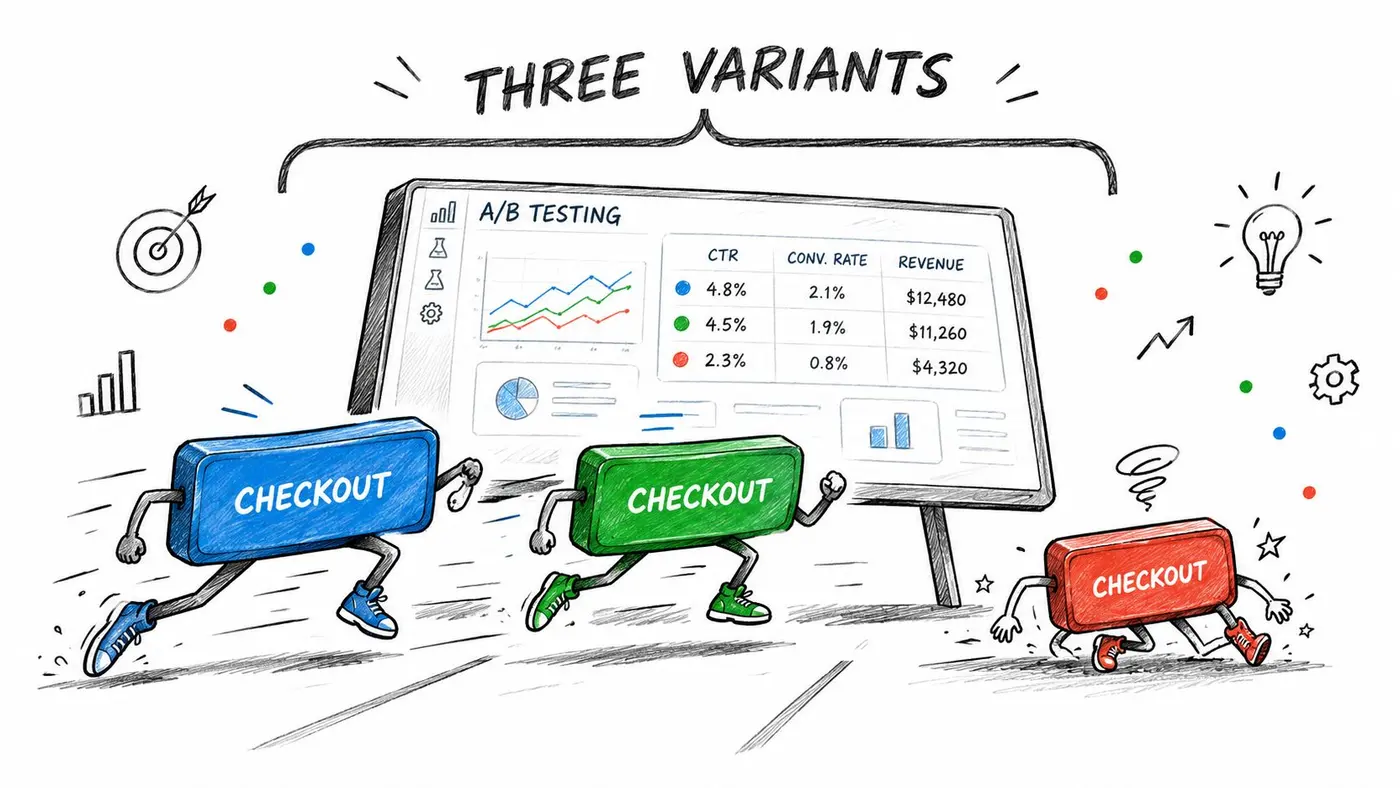
The experiment has changed, not just the page
In a standard A/B test, visitors are randomly assigned to a control or a challenger. The analysis asks whether the observed difference between those two groups is larger than the variation you'd expect by chance.
An A/B/C test adds a third mutually exclusive group. Each visitor sees only one version, but the analysis must consider the relationship between all three groups. Green may beat blue, red may trail green, and red may still beat blue. Those are separate comparisons, not one simple pass or fail question.
That creates two practical consequences:
- Traffic is divided more widely. Each variant receives a smaller share of visitors than it would in a two-arm test with the same total traffic.
- The analysis becomes more demanding. More comparisons create more opportunities for a random difference to appear meaningful.
The UK dataset cited above found an 8.4% average uplift among winning tests and a 6.1% median uplift, which shows why teams want to find genuine winners rather than abandon experimentation. Those figures come from the same UK CRO testing dataset, but they shouldn't be treated as a promise that a new button colour will produce a similar result.
Practical rule: Adding a variant is a change to the statistical design, not merely an extra design option.
Resist the tempting shortcut
A common mistake is to run the original A/B test, notice that green is ahead, then add red halfway through and continue as if nothing happened. That combines traffic from different designs and decision rules. It also makes it difficult to define the correct starting point, allocation, and stopping condition.
If the third idea is important enough to test, define it before launching the experiment. If it arrives after the original test has started, treat it as a new experiment or redesign the test explicitly. You'll lose some speed, but you'll gain a result that can be interpreted.
Understanding A/B/C Testing Versus Multivariate Testing
An A/B/C test changes one variable across three levels. You might compare three headlines, three CTA labels, or three checkout button colours while keeping the rest of the page constant. The question is narrow: which version of this one element performs better under the same surrounding conditions?
A multivariate test changes multiple variables simultaneously. For example, a team might combine two headlines with two button colours, creating several headline-and-colour combinations. That design can reveal interactions, such as a headline that works well only with one button treatment, but it also makes attribution harder.
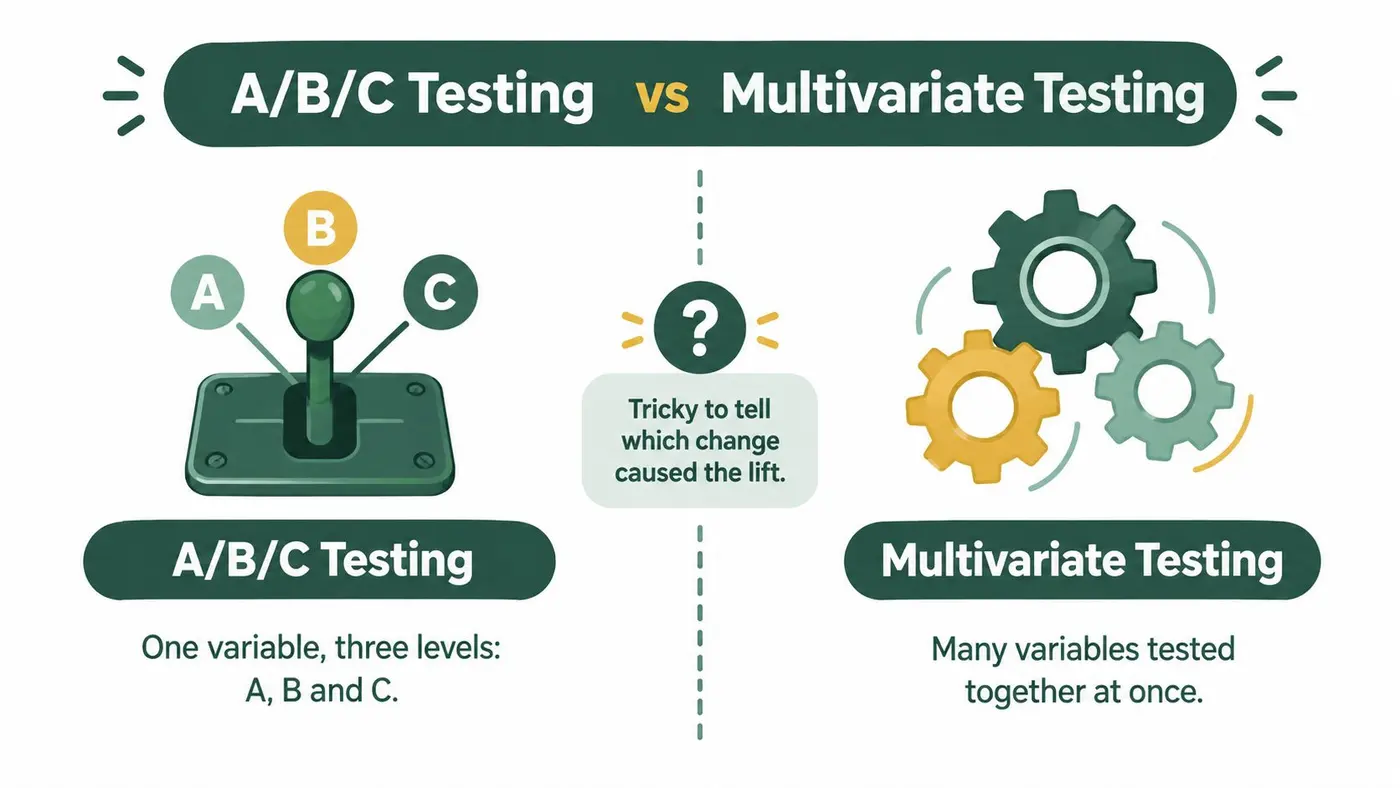
Use the narrowest design that answers the question
Start with the decision you need to make.
- If one element is under review, use A/B/C. Three meaningful headline directions can be compared while the layout, offer, and CTA remain stable.
- If combinations matter, consider multivariate testing. This is appropriate when the interaction between elements is part of the hypothesis, not when the team only has several ideas.
- If the variants represent unrelated strategies, pause. A single test can become difficult to interpret if one version changes the headline, layout, offer, and checkout flow all at once.
A/B/C testing is usually easier to explain to stakeholders because the variable stays isolated. Multivariate testing can provide richer learning, but it needs more traffic, stronger instrumentation, and a clear interpretation plan. The practical distinction is covered in more depth in this guide to what multivariate testing is.
Don't use multivariate testing to avoid making a prioritisation decision. If the team can't describe what each combination is meant to prove, the design is probably too ambitious.
The Statistical Impact of Multiple Variants
The hidden trap in an A/B/C test is the multiple comparisons problem. When analysts compare more groups, they create more chances for at least one apparent difference to arise through random variation. A result can look impressive in isolation while failing to represent a reliable underlying effect.
That doesn't mean three variants are automatically invalid. It means the test needs a decision rule that accounts for the number of comparisons being made. Without that adjustment, a team may declare a winner because one pair happened to separate in the data, even though no durable difference exists in the wider audience.
Why the sample requirement grows
A third variant affects sample planning in two ways. First, the available traffic is spread across more groups. Second, a stricter significance threshold may be needed to control false discoveries.
Methods such as the Bonferroni correction divide the acceptable error rate across the planned comparisons. A Dunn-Sidak adjustment takes a different mathematical approach to the same underlying problem. Neither method creates information, and neither makes a weak experiment stronger. They make the decision rule more cautious.
That caution increases the sample required to detect a real effect at the chosen power. The exact requirement depends on the baseline conversion rate, minimum detectable effect, allocation, variance, significance threshold, and desired power. It's not responsible to copy a sample-size figure from another site and assume it applies to yours.
Use a power calculation before launch, and document the assumptions behind it. The guide to calculating statistical power is useful for turning the business decision into a test requirement rather than guessing from a traffic target.
Separate statistical significance from commercial value
A statistically credible difference may still be too small to justify implementation effort. Conversely, a commercially attractive idea may need more data before the evidence becomes decisive.
Define the primary metric before the test begins. For an ecommerce checkout, that might be completed purchase rather than a button click. Secondary measures such as average order value, revenue per visitor, refunds, or support contacts can reveal whether a high-converting variant creates a poorer commercial outcome elsewhere.
A three-variant test should answer two questions separately: is the difference credible, and is the difference worth shipping?
Avoid peeking at the dashboard and stopping the moment one colour moves ahead. Monitor for technical failures and severe harm, but make the final decision using the pre-agreed analysis and stopping rule. The cleverest correction cannot repair a test that was repeatedly checked and stopped opportunistically.
When to Use Sequential A/B Tests Versus A/B/C Testing
Sequential A/B testing compares two variants, records the learning, and uses the result to choose the next comparison. A button programme might test blue against green first, then place the leading option against red in a separate experiment. This takes longer on the calendar, but each test has a simpler question and a cleaner interpretation.
A/B/C testing makes more sense when the alternatives must compete under identical conditions. It can be useful when the team has a time-sensitive launch, when the variants represent distinct approaches that shouldn't be tested in different periods, or when seasonality could make sequential results difficult to compare.
Decision Matrix for Sequential A/B Testing Versus A/B/C Testing
| Factor | Sequential A/B Testing | A/B/C Testing |
|---|---|---|
| Traffic availability | Better suited to limited traffic because each experiment has two groups | Requires enough traffic for three groups and stricter analysis |
| Decision speed | Slower when several alternatives need comparison | Faster on the calendar when all variants launch together |
| Question clarity | Strong for one focused comparison at a time | Strong when three defined alternatives must compete simultaneously |
| Statistical handling | Simpler comparison and communication | Needs multiple-comparison planning and a larger sample requirement |
| Learning quality | Encourages iterative learning and refinement | Offers a direct same-period comparison of all variants |
| Seasonality risk | Later variants may face different audience conditions | All variants experience the same test window |
| Implementation complexity | Usually easier to launch and debug | Requires careful allocation, tracking, and analysis |
| Best fit | Incremental improvements and traffic-constrained teams | High-priority alternatives with enough volume and a shared launch window |
The choice also depends on how meaningful the variants are. If blue, green, and red are cosmetic changes based on weak hypotheses, sequential testing may provide a better learning path. If they represent three substantially different value propositions and the team needs a fair head-to-head comparison, A/B/C can earn its additional complexity.
Before launch, review practical A/B testing best practices, particularly around hypothesis quality, measurement, and experiment discipline. For teams that need to understand the trade-offs of running tests one after another, this explanation of sequential testing provides useful context.
Step-by-Step Guide to Implementing A/B/C Testing
A reliable A/B/C test starts with a decision, not a collection of designs. The team should know what will change, why it might change behaviour, and what evidence would justify implementation.
1. Define the hypothesis
Write the control, the three alternatives, the primary metric, and the expected mechanism. “Red will win because it creates urgency” is a starting point, not a complete hypothesis. Specify the user action that should change and the business outcome that matters.
Keep the variants meaningfully distinct. Three barely different shades may create a technically valid test but little strategic learning.
2. Plan the sample before allocating traffic
Estimate the baseline rate, minimum effect worth detecting, desired power, and acceptable significance threshold. Then account for the planned comparisons using an appropriate adjustment, such as Bonferroni or Dunn-Sidak.
Don't promise a fixed test duration unless traffic and conversion behaviour are stable enough to support that estimate. A test should run until it has the required evidence, not until a convenient date on the marketing calendar.
3. Randomise and validate the split
Use random assignment so audience characteristics are balanced across control, B, and C. Equal allocation is a sensible default when the variants have similar implementation risk and business value.
Before counting results, check that the experiment serves the intended experience. Confirm that each visitor sees one consistent variant, events fire correctly, and conversions are attributed to the right group. A clean statistical method can't compensate for broken assignment or missing events.
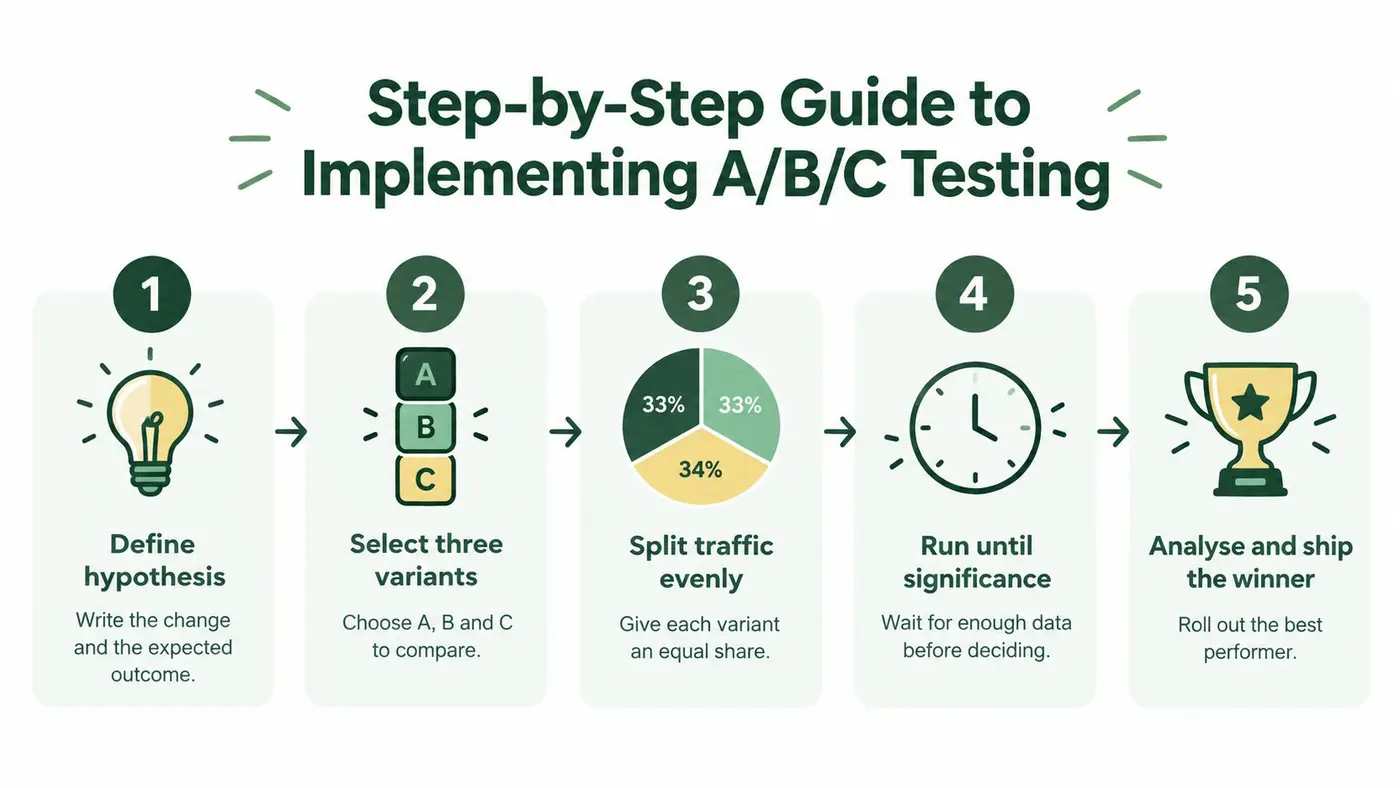
4. Choose the analysis before launch
A frequentist approach can use a suitable proportion test or z-test for conversion outcomes, with the significance calculation adjusted for the planned comparisons. For revenue and order value, use analysis appropriate to the distribution and the business question rather than forcing every metric into a binary conversion test.
Set the primary outcome first. Treat clicks, scroll depth, and micro-conversions as diagnostic or secondary metrics unless they directly represent the decision you're making.
5. Read the result as a business decision
When the test reaches the pre-defined evidence threshold, compare the winning candidate with the control and inspect the full metric set. Check whether the result is consistent across important audiences, devices, and traffic sources, but don't turn every segment into a separate winner hunt.
Teams that need a broader view of implementation can review Alpha Omega Digital's CRO services for examples of the wider research, analysis, and optimisation work that surrounds an experiment.
Document the hypothesis, allocation, dates, exclusions, analysis method, result, and follow-up action. A failed test is still useful if the team knows what it tested.
Real-World Example of Testing Three CTA Button Colours
Consider an ecommerce team choosing between blue, green, and red CTA buttons. The team expects green to feel reassuring, while red may create urgency. Rather than changing the button during an existing test, it defines all three variants in advance, keeps the surrounding page stable, and assigns visitors randomly.
The team's mistake would be to treat the first colour that moves ahead as the winner. It needs to compare the variants under the planned correction, check the primary purchase metric, and inspect revenue-related outcomes before making a rollout decision. If green leads, the correct conclusion is not that green buttons always work. It's that this green treatment performed better than the defined alternatives for this audience, page, and test period, subject to the quality of the evidence.
A useful follow-up is to examine mobile and desktop behaviour as an interpretation exercise, not as permission to keep slicing until something looks exciting. If red appears stronger on mobile, validate whether the pattern is large enough and plausible enough to inform a new, pre-planned experiment.
The page also deserves scrutiny beyond button colour. UK ecommerce averages vary sharply by vertical, device, and site speed. A recent UK-focused review reported category conversion rates ranging from 0.53% in electrical and commercial equipment to 4.82% in arts and crafts, with a January 2026 market median of 1.45%, while another Great Britain benchmark reported a 3.4% average and 2.35% median in April 2026, as documented in UK ecommerce conversion research. Those differences make generic benchmark comparisons a poor substitute for a well-designed site-specific experiment.
If the test shows no reliable colour winner, investigate speed, trust signals, offer structure, and checkout friction rather than forcing a design decision. Teams dealing with abandoned carts can also review practical SMS cart recovery fixes, because the strongest conversion opportunity may sit after the CTA rather than inside it.
Key Takeaways and Implementation Checklist
An A/B c test earns its place when three alternatives need a fair, simultaneous comparison. It doesn't earn its place just because launching one experiment feels faster than making a prioritisation decision.
Use this checklist before sending traffic:
- Clarify the decision: Write the business question, the control, the three variants, and the action that follows each possible result.
- Check the design: Confirm that one variable changes in the A/B/C test. If several variables change, decide whether a multivariate design is justified.
- Plan for uncertainty: Account for multiple comparisons, use a power calculation, and accept that the required evidence may be greater than for a straightforward A/B test.
- Protect the allocation: Randomise visitors, keep variants mutually exclusive, and validate event tracking before counting conversions.
- Name the primary metric: Choose the outcome closest to business value. Use clicks and engagement signals as supporting evidence unless they directly drive the decision.
- Set a stopping rule: Don't stop because a dashboard looks favourable. Define the evidence requirement and the conditions for an early safety stop.
- Inspect commercial impact: Compare purchases, average order value, revenue per visitor, and relevant quality signals where the business model supports them.
- Record the learning: Save the hypothesis, result, decision, and next test so the programme compounds knowledge instead of repeating guesses.
Choose sequential A/B testing when traffic is constrained, the changes are incremental, or the next hypothesis depends on what you learn first. Choose A/B/C when the alternatives must face the same audience conditions and the organisation can support the additional sample and analysis discipline.
Conclusion of Making the Right Testing Choice
A/B/C testing is useful, but it isn't a shortcut around experiment design. Adding a third variant changes traffic allocation, increases the number of comparisons, and raises the risk of declaring a false winner unless the analysis accounts for it.
For many teams, sequential A/B testing should remain the default. It keeps the question narrow, makes implementation easier, and lets the team refine the next test using the previous result. That advantage matters when traffic is limited or when the variants are modest iterations rather than competing strategies.
A/B/C becomes the better choice when three well-defined alternatives need to run under identical conditions. Use it for a deliberate head-to-head comparison, not for collecting every stakeholder's idea in one launch. Define the primary metric, calculate the required sample with the planned correction, validate randomisation, and wait for enough evidence to make a commercial decision.
The right outcome isn't a colourful dashboard or a statistically labelled winner. It's a change the team can defend, implement, and measure against the business result that motivated the experiment.
Otter A/B lets teams create multiple variants, split traffic, define conversion and revenue goals, and monitor statistical significance in one dashboard. If you're deciding between sequential A/B tests and a true A/B/C design, visit Otter A/B to set up a structured experiment and connect the result to purchases, average order value, and revenue per variant.
Stop guessing
Ready to start testing?
Set up your first A/B test in under five minutes. No credit card required.
- 14-day free trial
- No credit card required
- Cancel anytime