Core Web Vitals WordPress: How to Measure and Optimise
Core Web Vitals WordPress. Learn how to measure, diagnose, and fix Core Web Vitals on WordPress sites. Practical steps for LCP, INP, and CLS optimisation
Most advice about Core Web Vitals for WordPress starts with the same promise: install a caching plugin, compress a few images, defer JavaScript, and the site will pass. That sequence can help, but it hides the decision that matters most. Some failures come from poor configuration and are straightforward to correct. Others come from a theme, page builder, hosting setup, or plugin architecture that keeps recreating the same problems.
Google's targets are clear. At least 75% of visits must meet the relevant real-user threshold for a page to pass, with LCP at 2.5 seconds or less, INP at 200 milliseconds or less, and CLS at 0.1 or less. The practical question for a UK WordPress team isn't just how to improve a PageSpeed score. It's whether the current stack can reach those thresholds without consuming more time and maintenance effort than a structural change would require. Google's Core Web Vitals guidance for UK WordPress sites provides the right foundation: field data should decide whether the experience is passing.
Why Most WordPress Sites Still Fail Core Web Vitals
Choosing a performance plugin is not a performance strategy. CMS benchmark data shows why. A 2025 comparison found that 43.44% of WordPress sites achieved a good Core Web Vitals score, compared with 83.63% for Duda, 75.22% for Shopify, 70.76% for Wix, 67.66% for Squarespace, and 59.07% for Drupal. The figures appear in Search Engine Journal's coverage of the 2025 CMS Core Web Vitals rankings.
That gap doesn't mean WordPress is slow by nature. WordPress core gives teams considerable control. The production stack usually adds a theme, visual builder, plugins, commerce features, analytics, consent tooling, chat, advertising, and marketing integrations. Each layer can enqueue CSS, execute JavaScript, expand the DOM, create database requests, or inject content after the initial layout calculation.
The architecture behind the score
The same causes appear across performance audits:
- Theme bloat: Multipurpose themes often load design features that a page never uses.
- Builder overhead: Visual builders can create nested markup and broad stylesheets, increasing the work required before the browser paints the main content.
- Plugin scripts: A form, slider, review, or commerce plugin may load assets across the whole site instead of only on relevant templates.
- Database work: Uncached queries and complex dynamic components delay the server response that begins the page load.
- Third-party code: Analytics, consent managers, chat widgets, payment tools, and advertising scripts compete for the browser's main thread.
The result is a structural mismatch. WordPress is designed for extensibility, while Core Web Vitals measure the experience produced by the complete assembled stack. A faster host can reduce server delay, but it cannot remove unnecessary JavaScript. A cache can serve HTML quickly, but it cannot reserve space for a banner that appears late. A minification plugin can reduce file size, yet it may break a builder's dependency order.
Practical rule: Treat every optimisation as a hypothesis about a specific metric, not as a reason to collect more performance plugins.
UK WordPress teams also have a useful external comparison. GOV.UK reported a median page load time of 0.455 seconds for all pages and devices in April to May 2022, based on real-user monitoring. A later update reported a 40% reduction in homepage CSS, from 42 kB to 25 kB, alongside an LCP improvement from 2.53 seconds to 2.35 seconds. These results do not define a universal WordPress target. They show that reducing front-end work can produce a measurable improvement on an important page. The evidence is documented in GOV.UK's real-user monitoring lessons.
A benchmark is a warning, not a verdict
A CMS pass rate cannot identify whether a homepage fails because of an oversized hero image or because the whole template is expensive to render. Use the benchmark to test optimistic assumptions, then examine the actual URLs and templates. For a practical reference on tracking Web Vitals with Fivenines, teams can supplement their own monitoring process with the available resources.
The decision threshold is clear. Tactical work fits a failure with a specific asset, server, or script cause. Structural work becomes more appropriate when every template inherits the same builder output, the theme tightly couples its scripts, and updates repeatedly recreate the performance debt. At that point, another plugin may treat one symptom while preserving the underlying constraint.
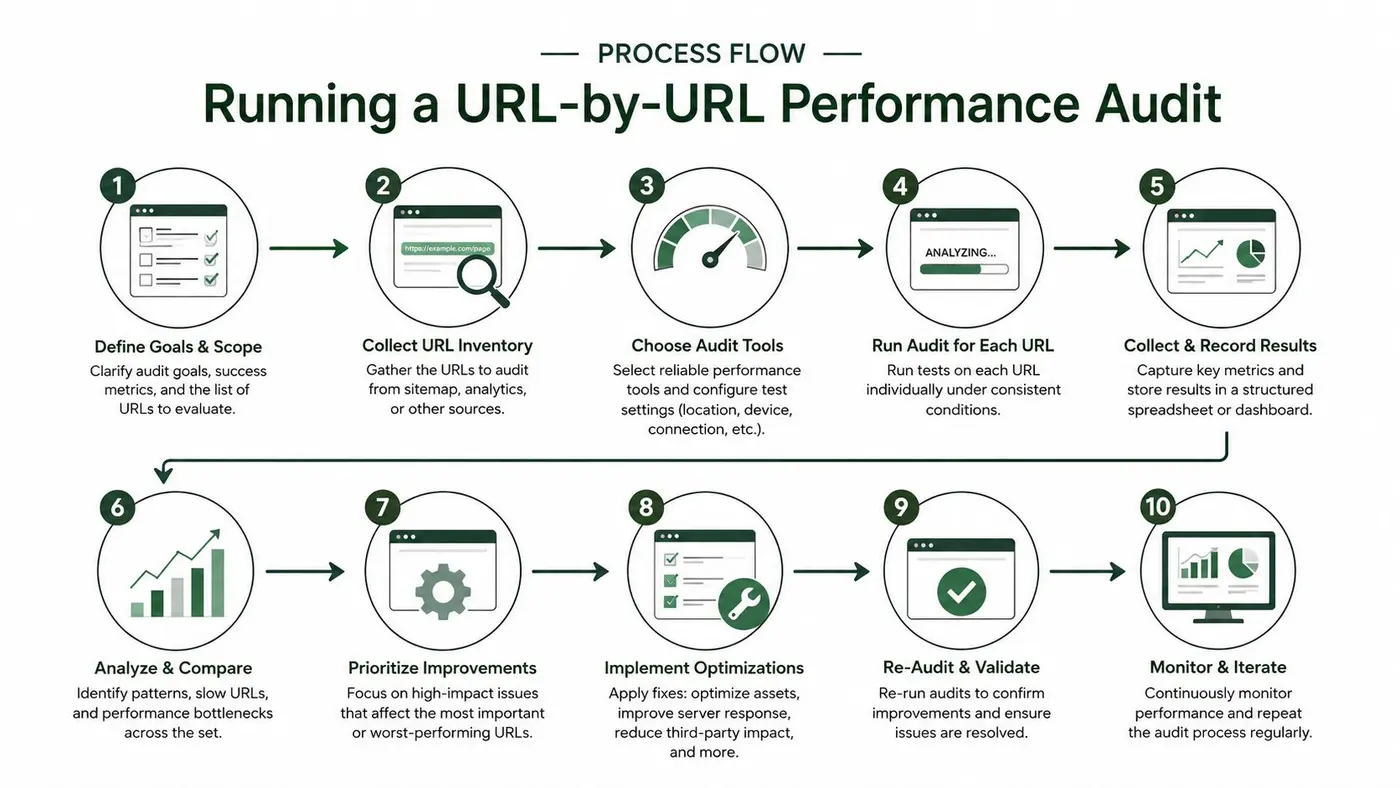
Running a URL-by-URL Performance Audit
A site-wide PageSpeed score should not be the starting point for a WordPress performance project. WordPress sites combine different templates and URL types, so a homepage can behave very differently from a service page, product detail page, checkout flow, or article. Audit representative URLs individually, then connect each failure to the template, plugins, and components responsible for it. That separation also shows when tactical plugin changes have reached their limit and the stack itself needs review.
Start with real users
Open PageSpeed Insights for the homepage, a key landing page, and the main revenue page. Record three details before changing anything:
- Field data availability: Check whether the URL has real-user data or only lab data.
- Metric status: Record the status of LCP, INP, and CLS against Google's thresholds.
- Page context: Identify the device audience, template, builder, commerce features, and third-party services involved.
Google's field data comes from real visits, while lab data comes from a controlled test. A low-traffic UK site may have no URL-level field data even when its code is problematic, so “no data” does not indicate a pass. Search Console's Core Web Vitals report groups similar URLs and separates pages with enough field information from those requiring lab diagnosis. Google's Search Console documentation explains how to interpret that distinction.
Move from symptoms to causes
Use lab tools after identifying the URLs that matter. Chrome DevTools' Performance panel can reveal long tasks, delayed paints, and layout shifts. The Coverage panel shows JavaScript and CSS that a page downloads without using. WebPageTest supports repeatable runs from a chosen location or connection profile, while Lighthouse CI can preserve a baseline for staging and deployment checks.
For each URL, create a short evidence record:
| URL type | Field data | Failing metric | Likely investigation |
|---|---|---|---|
| Homepage | Available or absent | LCP, INP, or CLS | Hero media, global assets, header scripts |
| Landing page | Available or absent | LCP, INP, or CLS | Builder modules, forms, tracking |
| Revenue page | Available or absent | LCP, INP, or CLS | Product media, AJAX, checkout scripts |
Prioritise the page that combines a meaningful business role with a confirmed field failure. A lab-only issue on an obscure archive may be less urgent than a field-data failure on a campaign landing page, even if the archive receives a more dramatic synthetic score.
Keep a before-and-after capture for every change. Record the cache state, device profile, URL, metric, and implementation detail. Without that record, teams can mistake a different test run or cleared cache for a genuine improvement. If the same expensive builder output and global scripts affect every template, repeated plugin-level fixes will eventually produce smaller gains than a structural stack change.
Diagnosing LCP, INP, and CLS Issues on WordPress
The practical question for a UK WordPress team goes beyond improving a PageSpeed score. Assess whether the current stack can reach Google's thresholds without consuming more time and maintenance effort than a structural change would demand. LCP, INP, and CLS describe different browser bottlenecks, so one generic “speed” fix rarely resolves all three. WordPress complicates diagnosis because one plugin can influence loading, interaction, and layout through separate mechanisms.
LCP starts with the first visible priority
Find the LCP element in PageSpeed Insights or the DevTools Performance panel. It is often a hero image, featured image, heading, or large content block. If the browser discovers that element late, waits for render-blocking CSS, or receives the document slowly, LCP remains poor even after the rest of the page loads.
Inspect the delivery chain before compressing images again. Confirm that the hero image is not lazy-loaded, uses a responsive source, and has dimensions matching its rendered space. Check server response time, page caching, critical CSS, and the order in which the browser discovers the asset. A page builder can delay the image through generated CSS and markup, even when the file is already well compressed.
For a focused explanation of the metric and its sub-parts, use this guide to Largest Contentful Paint.
INP is usually a main-thread problem
INP failures often appear after loading, when a visitor opens a menu, changes a product option, submits a form, or applies a filter. Inspect the interaction in DevTools and identify long tasks around the event. Common WordPress sources include builder runtime code, WooCommerce AJAX calls, sliders, consent tooling, analytics, chat widgets, and plugin handlers that run globally.
Ask which JavaScript runs during the interaction and whether that work needs to happen immediately. A script may be harmless on an article but expensive on a product page. Conditional loading, cleaner event handlers, smaller DOM updates, and yielding non-critical work to the browser usually help more than combining or minifying every file.
CLS needs reserved space
A layout shift occurs when content moves without the visitor requesting it. Missing image dimensions, late web fonts, injected cookie notices, advertising containers, recommendation widgets, and embedded media can all cause movement. Use the Layout Shifts track in DevTools to identify the element and the source of the shift.
WordPress themes sometimes replace native image attributes with custom markup. Builders and block patterns may also insert components after the initial layout. Give images and iframes explicit dimensions, reserve space for dynamic regions, and avoid inserting content above existing content unless it follows an interaction.
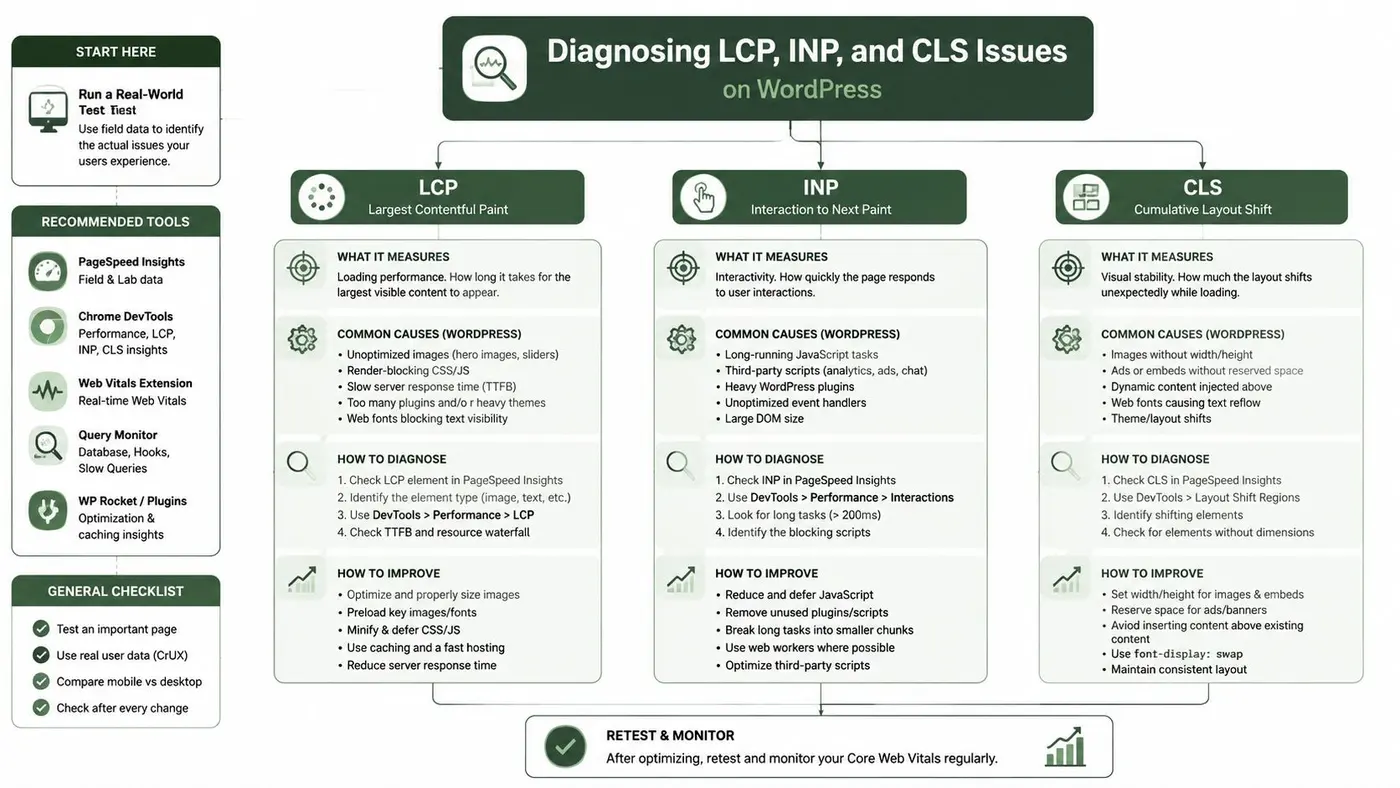
The thresholds make diagnosis concrete: LCP must be 2.5 seconds or less, INP 200 milliseconds or less, and CLS 0.1 or less for the relevant good classification, as summarised in the UK WordPress Core Web Vitals guidance. Small lab variation is not a root cause. Look for a repeatable field-data pattern or a trace that identifies the responsible work. If the same builder output and global scripts affect every template, plugin-level tuning may eventually deliver smaller gains than changing the theme, builder, or wider stack. That is the point where further tactical optimisation needs to justify its maintenance cost.
Implementing Fixes That Actually Move the Metrics
Performance work improves when each change has a metric owner. Start with infrastructure and delivery, then reduce browser work, then stabilise the layout. Avoid stacking WP Rocket, Autoptimize, LiteSpeed Cache, and other overlapping tools. Choose the solution that matches the server, configure one source of truth for caching, and test after every meaningful change.
Prioritise by bottleneck
For LCP, fix the server response and the LCP resource before polishing below-the-fold images. Use page caching, a CDN where appropriate, compressed delivery, and a responsive WebP or AVIF version of the hero image. Exclude that image from lazy loading, verify its dimensions, and use preload or high fetch priority only when the asset is the LCP resource. Over-preloading competes with the document and can make the page worse.
For INP, delay or conditionally load third-party JavaScript. A chat widget doesn't need to execute on an editorial article before the visitor interacts with it. WooCommerce assets shouldn't load on pages with no commerce behaviour. Perfmatters and Asset CleanUp can help with per-page controls, but manual review matters because disabling a dependency can break menus, forms, or checkout interactions.
For CLS, reserve space before content arrives. Set dimensions for images and video, define stable containers for embeds and adverts, and review font loading so fallback text doesn't reflow the page when the web font arrives. Lazy loading remains useful for content below the fold, but it's the wrong treatment for the element that controls LCP. Guidance on shrinking image files without sacrificing quality can help editors prepare better media before it enters WordPress.
| Fix | Target metric | Expected impact | Effort level |
|---|---|---|---|
| Page caching and server tuning | LCP | High when server response is the bottleneck | Medium |
| LCP image sizing and priority | LCP | High when the hero asset is discovered late | Low to medium |
| Critical CSS and reduced render blocking | LCP, CLS | Medium to high, depending on theme output | Medium |
| Conditional JavaScript loading | INP, LCP | Medium to high on plugin-heavy templates | Medium |
| Long-task reduction | INP | High when interactions trigger expensive handlers | High |
| Reserved media and dynamic-content space | CLS | High when shifts come from missing dimensions | Low |
| Self-hosted, carefully matched fonts | CLS, LCP | Medium when typography causes reflow or delay | Medium |
Don't let optimisation plugins hide the architecture
WP Rocket can automate caching, critical CSS, JavaScript delay, and related controls. Perfmatters is useful when granular asset management is the priority. LiteSpeed Cache makes sense when the hosting environment supports LiteSpeed features. None of these products can repair a page builder that renders unnecessary modules into every template, or a plugin that performs expensive work during every interaction.
Image loading needs the same care. Use srcset and sizes, serve an appropriate source for the viewport, and inspect the final HTML rather than trusting the media library settings. For implementation details around deferred media, see lazy-loading implementation on WordPress.
At hosting level, review page caching, PHP configuration, object caching such as Redis where it fits the application, and compression. These changes can improve the platform's baseline, but they won't compensate for a page that sends excessive code to the browser. The metric result depends on the complete delivery path.
When to Optimise and When to Rebuild
Optimisation makes sense when the site has isolated bottlenecks. A well-structured theme with a large hero image, unnecessary global plugin assets, weak caching, and a few layout shifts can usually improve without changing the publishing system. The work is targeted, reversible, and easy to validate URL by URL.
A rebuild deserves serious consideration when the same defects appear across every important template. Warning signs include a builder generating irreducible DOM depth, theme scripts that can't be separated safely, plugins that reintroduce assets after updates, and a development team spending more time preventing regressions than shipping improvements. At that point, another optimisation plugin adds configuration rather than capacity.
Use a decision score, not frustration
Score each key template against three questions:
- Metric gap: Is the field failure confined to one element, or does the entire rendering model create delay?
- Business value: Does the affected URL support enquiries, purchases, or a major acquisition path?
- Maintenance burden: Can the fix survive normal editor activity, plugin updates, and campaign changes?
A high-value page with a persistent LCP or INP failure is a stronger rebuild candidate than a low-value archive with a small CLS issue. Rebuilding doesn't automatically mean abandoning WordPress. It could mean replacing a heavy builder with Gutenberg and a lean theme, rebuilding only revenue templates, or separating the content management layer from a more controlled front end.
The CMS comparison reinforces the need for an honest review. The reported 43.44% WordPress good-score rate sits well below the benchmark for Duda and the other listed platforms in the CMS comparison. That doesn't establish a universal migration threshold, but it does challenge the idea that tactical tuning is always the cheaper long-term answer.
Rebuild the part that creates the constraint, not the part that merely looks untidy.
A structural change should have a defined success condition. Identify the templates, metrics, and field-data evidence that must improve, then test the proposed stack before committing to a full migration. If the new architecture only produces a better lab score, it hasn't solved the business problem.
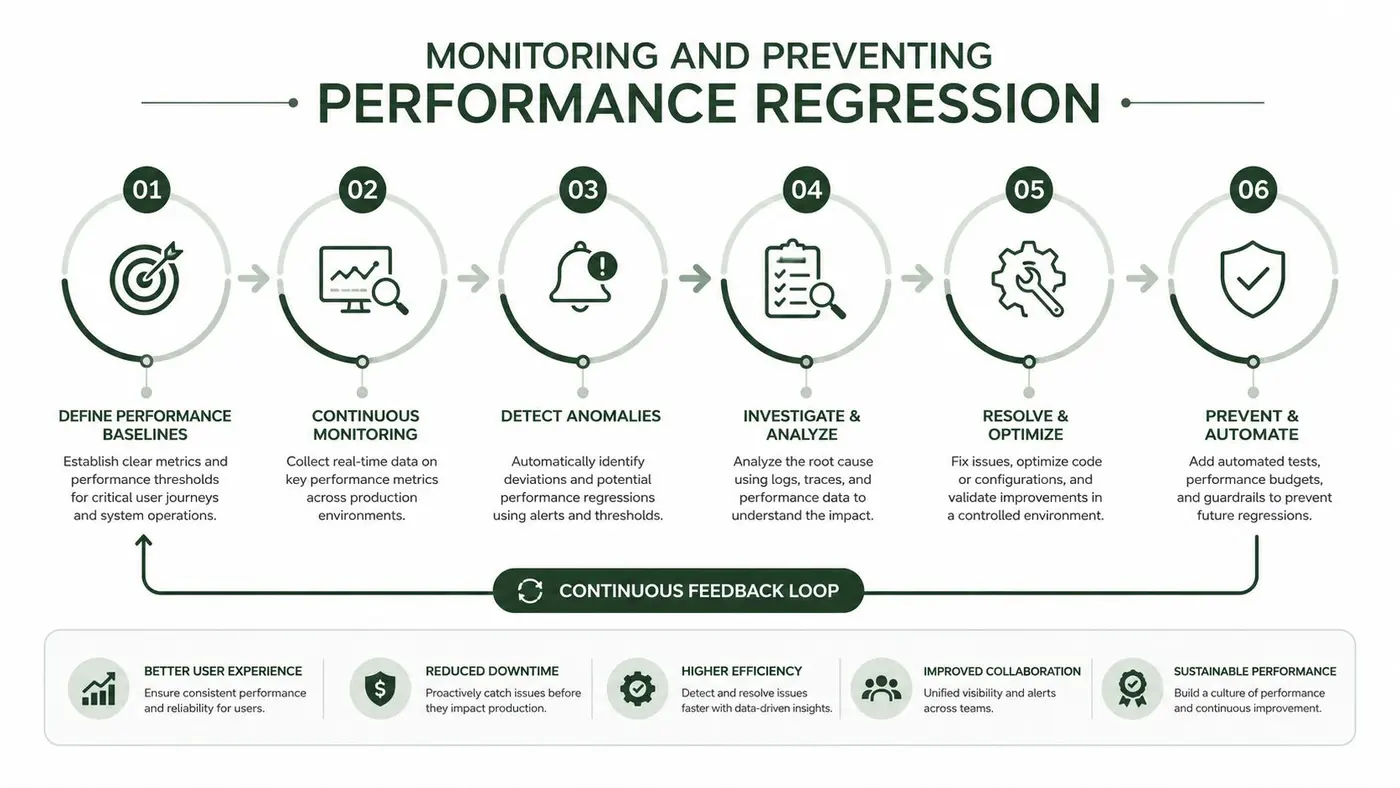
Monitoring and Preventing Performance Regression
A WordPress site regresses through ordinary work. A plugin update changes an asset dependency, an editor uploads a large hero image, a developer adds a consent banner, or a campaign introduces a new embedded tool. The fix is a monitoring system that catches those changes before they become accepted as normal.
Use two layers. Field data shows what real visitors experience and should guide the final pass or fail decision. Lab testing gives you repeatable diagnostics during development. Search Console is useful for grouped URL trends, while a real-user monitoring setup can add page, device, and template detail. Otter A/B's performance monitoring guidance also covers capturing Core Web Vitals and connecting the visitor's variant assignment to performance data when experiments are running.
Set ownership around releases
A practical governance model assigns clear checks to different people:
- Developers: Run Lighthouse CI or equivalent checks against staging and investigate budget breaches.
- Editors: Compress and correctly size prominent media, especially images used near the top of a page.
- Marketing teams: Review the performance cost of chat, analytics, consent, and campaign scripts before launch.
- Site owners: Review Search Console trends and maintain a record of meaningful template changes.
Keep a performance changelog with the URL, release, metric, test mode, and observed result. Don't claim a field-data recovery immediately after a deployment. Lab results can change at once, while real-user reporting reflects an aggregated experience over time. The changelog helps you connect later field movement to the change that caused it.
For teams testing page variations, measure performance as well as conversion outcomes. A lightweight experiment script still needs validation on mobile, with caching enabled and the variant assignment available to the monitoring layer.
The sustainable approach is simple: test representative URLs before release, inspect field data after release, and pause experiments or integrations that create a measurable regression. That turns Core Web Vitals from a one-off clean-up task into a shared operating standard.
Otter A/B helps teams test WordPress headlines, CTAs, and layouts while tracking the performance context around each variant, so conversion decisions don't ignore user experience. Visit Otter A/B to evaluate experiments without losing sight of LCP, INP, CLS, and the business result that matters.
Stop guessing
Ready to start testing?
Set up your first A/B test in under five minutes. No credit card required.
- 14-day free trial
- No credit card required
- Cancel anytime