Effect Size Interpretation for Growth Marketers
Master effect size interpretation for A/B testing. Learn to evaluate Cohen's d, odds ratios, and practical significance beyond p-values
Most growth teams still treat effect size interpretation as a labelling exercise. They see a result, compare it with a familiar “small”, “medium”, or “large” threshold, then decide whether the experiment mattered. That shortcut fails because a number has no business meaning until you connect it to the baseline, the outcome scale, the cost of implementation, and the value of the customers affected.
A statistically significant result can be commercially irrelevant. A result described as small can still change a serious business decision. UK guidance from the University of Southampton describes effect size as a way to assess practical significance, while UK academic guidance from Lancaster University warns that benchmarks are only rough rules of thumb. For growth marketers, that distinction is more useful than memorising a threshold.
Why Your Significant Result Might Still Be Useless
A low p-value tells you that the observed data would be unusual under a no-effect assumption. It doesn't tell you whether the change is large enough to justify engineering time, design work, maintenance, support costs, or the risk of disrupting a working journey.
Suppose a checkout test produces a statistically significant conversion improvement, but the absolute difference is so slight that the additional gross profit won't cover the implementation and monitoring cost. Shipping the variant because the dashboard says “significant” would be poor decision-making. The test detected a signal, but the signal didn't clear the commercial bar.
The opposite mistake is just as costly. A modest effect on an important, high-volume journey may create a substantial number of additional customers or purchases. Calling it “small” and discarding it because it doesn't resemble an academic textbook example confuses a standardised label with a business judgement.
Practical rule: Statistical significance answers whether the data supports a difference. Effect size interpretation asks whether the difference is worth acting on.
Separate detection from decision
I use four questions when reviewing an experiment:
- Did the test detect a credible difference? Look at the estimate and its uncertainty, not the p-value alone.
- How large is the difference in the original business units? For conversion, use percentage points and relative change. For revenue, use currency per visitor or per order.
- What does the change mean at the current baseline? The same relative movement can represent very different customer volumes at different starting rates.
- What will implementation require? Include development, QA, analytics, operational support, and the opportunity cost of delaying another test.
This approach doesn't make statistical significance irrelevant. It puts significance in its proper place. A result with weak evidence and a large-looking estimate may deserve another test, not an immediate rollout. A result with strong evidence and a tiny estimate may be worth implementing when the change is cheap and reversible, but not when it requires a major rebuild.
The business can make a “small” effect large
A standardised effect describes magnitude relative to variability or scale. It doesn't know your margin, traffic quality, customer lifetime value, implementation burden, or strategic priority. That information has to come from the business.
The most useful report therefore contains both the statistical result and the practical translation. State what changed, how precisely it was estimated, how many customers it affects in ordinary operations, and whether the expected value exceeds the cost of acting. That is the foundation of sound effect size interpretation.
Core Effect Size Metrics Every Marketer Should Know
Start with the metric that preserves the meaning of the business outcome. Standardisation can help compare studies, but it can also hide the size that stakeholders care about.
Conversion outcomes need absolute and relative differences
The absolute difference is the treatment conversion rate minus the control conversion rate. If the control converts at one rate and the variant converts at a higher rate, the result in percentage points tells you how many additional conversions occur per equivalent group of visitors.
The relative difference divides that absolute change by the control rate. It answers a different question, namely how large the change is compared with the starting point. Relative lift can make a small absolute change sound dramatic when the baseline is low, so report both.
For binary outcomes, you may also encounter:
- Risk ratio, which compares the probability of an event between groups.
- Odds ratio, which compares odds rather than probabilities and can be misunderstood when events aren't rare.
- Absolute risk difference, which remains closest to the customer-level business impact.
Use absolute change for planning and commercial translation. Use relative change when comparing performance across journeys, provided you keep the baseline visible.
Cohen's d fits continuous metrics
Cohen's d expresses the difference between two means in standard deviation units. For an A/B test, it can help compare average order value, revenue per visitor, time spent, or another continuous outcome when the variability of the metric matters.
The basic calculation is:
Cohen's d = difference between group means ÷ pooled standard deviation
A larger standard deviation makes the standardised effect smaller even when the raw mean difference is unchanged. That isn't a flaw. It tells you that the observed movement is small relative to the noise in the metric, which matters when deciding whether the result will repeat.
Don't use d as a substitute for currency. If average revenue per visitor moves, show the raw monetary difference first, then include d as supporting context.
Match the measure to the question
| Effect size metric | Best for | Example use case |
|---|---|---|
| Absolute difference | Direct business impact | Change in checkout conversion |
| Relative difference | Proportional comparison | Comparing lift across pages with different baselines |
| Cohen's d | Difference between continuous means | Revenue per visitor or average order value |
| Risk ratio | Relative probability of an event | Purchase probability between variants |
| Odds ratio | Logistic models and odds-based analysis | Modelling the likelihood of signup |
| Correlation, r | Strength and direction of association | Relationship between engagement and activation |
A metric isn't “better” in isolation. It becomes useful when it answers the question your decision-maker needs answered. UK guidance from Lancaster highlights that interpretation changes across measures such as d, r, w, and f², and that effect size belongs to the study and outcome context rather than existing as an absolute label.
Why Fixed Benchmarks Fail in Real Business Contexts
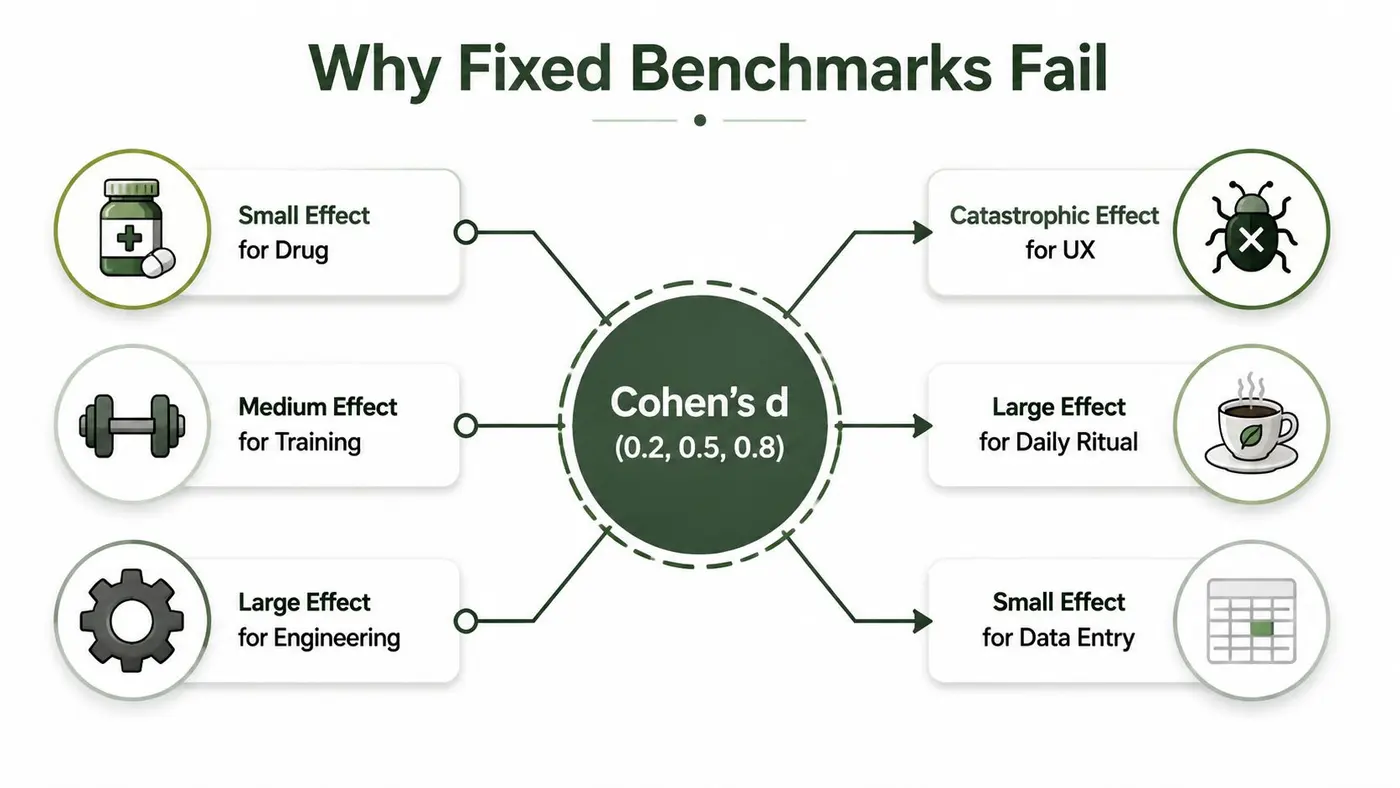
Cohen's familiar bands often appear as 0.2 for small, 0.5 for medium, and 0.8 for large when the measure is Cohen's d. Those values can provide a starting vocabulary, but they weren't designed to decide whether a landing-page change deserves engineering capacity.
The same standardised effect can carry very different consequences depending on the outcome scale, baseline rate, population, and decision cost. A small movement in an important public-service or education outcome can matter at population scale, a point also emphasised in UK-linked guidance discussed by the UCL Research Department of Epidemiology and Public Health. The practical question isn't “Which label applies?” It is “What does this movement change for the people and economics involved?”
Baseline changes the interpretation
A relative lift is anchored to the control rate. The same proportional movement can produce a very different absolute number of additional conversions when applied to different audiences or funnel stages. A high-value checkout may justify action on a smaller absolute movement than a low-margin content interaction, especially if the implementation is simple.
The outcome scale matters too. A movement in revenue per visitor is already expressed in a commercial unit. A movement in a usability score may need translation into retention, activation, or support demand before anyone can judge its value. Standardised effect sizes help compare noisy measures, but they shouldn't replace the original units.
Cost, risk, and reversibility belong in the decision
A cheap copy change and a complex pricing experiment shouldn't face the same practical threshold. For the first, a modest credible effect may be enough to deploy. For the second, the team may require stronger evidence, a larger expected impact, or a safer rollout because the downside is harder to reverse.
I also separate importance from certainty:
- Importance: Would the estimated effect materially improve the business or customer experience?
- Certainty: How narrow is the interval around the estimate, and does it exclude outcomes that would make the change unattractive?
- Execution: Can the team implement and monitor it without creating a larger problem elsewhere?
This is why “small effect” is not a decision. It's an invitation to inspect the scale, baseline, uncertainty, and economics.
How Effect Size Connects to P-Values and Statistical Power
Experiment reports often place p-values, effect sizes, and power in separate boxes, as if each were an independent verdict. They aren't. They describe different parts of the same inference problem.
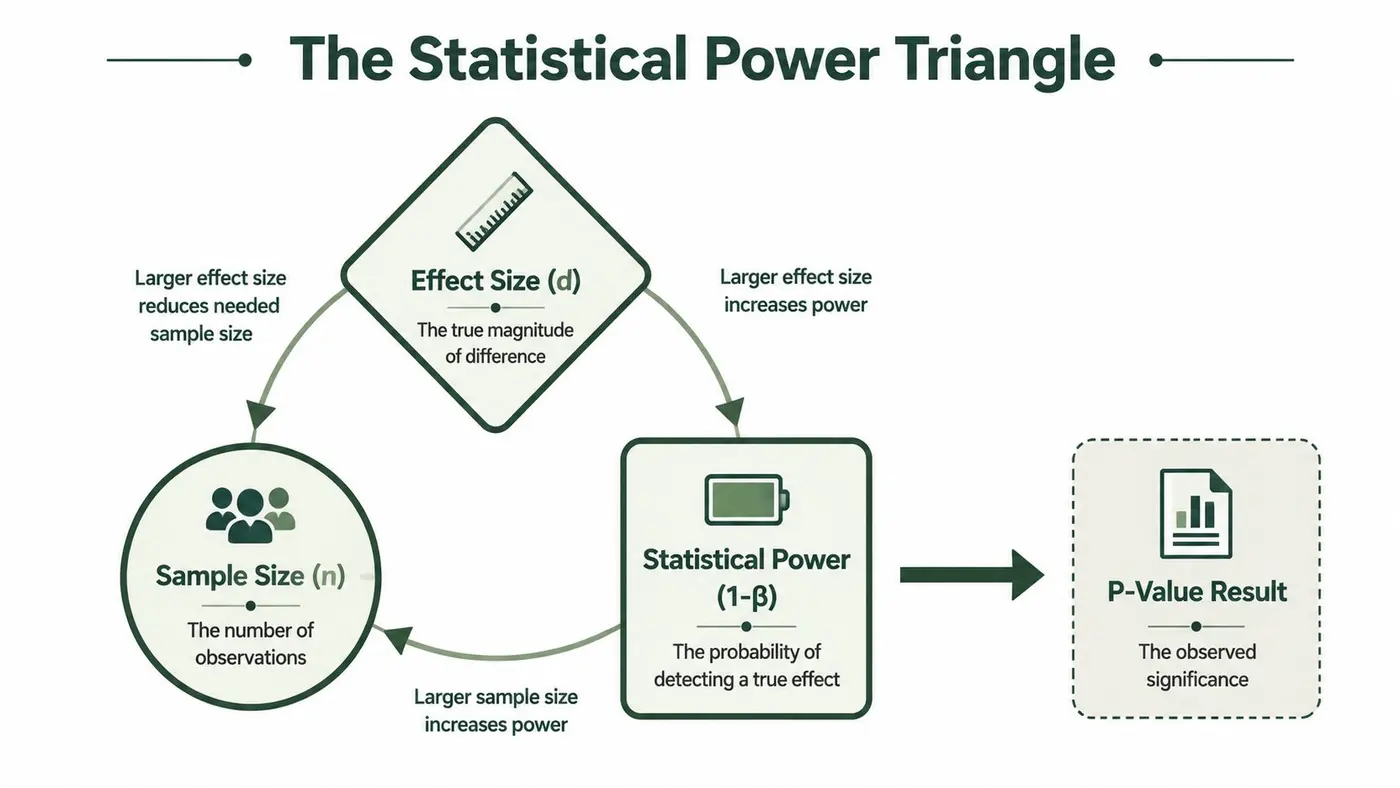
The p-value concerns compatibility with a no-effect model. The effect size describes the magnitude of the observed difference. Statistical power describes the test's ability to detect an effect of a specified size under its design assumptions. Sample size, variability, allocation, and the target effect all affect that ability.
A large sample can make a very small movement statistically detectable. A small sample can produce a large estimate with enough uncertainty that the result remains inconclusive. A non-significant result therefore doesn't prove that the effect is absent. It may mean the test couldn't distinguish the estimate from ordinary sampling noise.
Design the test around a useful effect
Before launch, define the smallest effect that would change your decision. That target feeds the sample-size calculation. If you choose an effect that is too small, the test may take too long or consume traffic that could support more valuable work. If you choose an effect that is unrealistically large, the test may appear adequately planned while missing the improvements the business could achieve.
Power analysis should use a credible estimate based on comparable evidence, historical variability, or the minimum business impact worth pursuing. It shouldn't be reverse-engineered from whichever result the team hopes to see.
The statistical power calculation guide provides a practical reference for connecting the target effect with the design parameters. The important habit is to make those assumptions explicit before anyone sees the outcome.
Read non-significance with the interval
A point estimate alone can tempt you to overreact. Pair it with a confidence interval and ask whether the plausible range includes no meaningful benefit, a worthwhile benefit, or a harmful outcome.
If the interval spans a wide range, the next action may be more data or a better-designed test. If the entire plausible range sits below the commercial threshold, stopping can be rational even when the p-value doesn't provide a neat headline. Power supports the design, but effect size interpretation supports the decision.
Interpreting Effect Sizes in Real A/B Testing Scenarios
A dashboard should never force you to choose between “winner” and “loser” before you understand the magnitude. The following examples use invented values as calculation illustrations, not company results or reported case studies.
Product page conversion
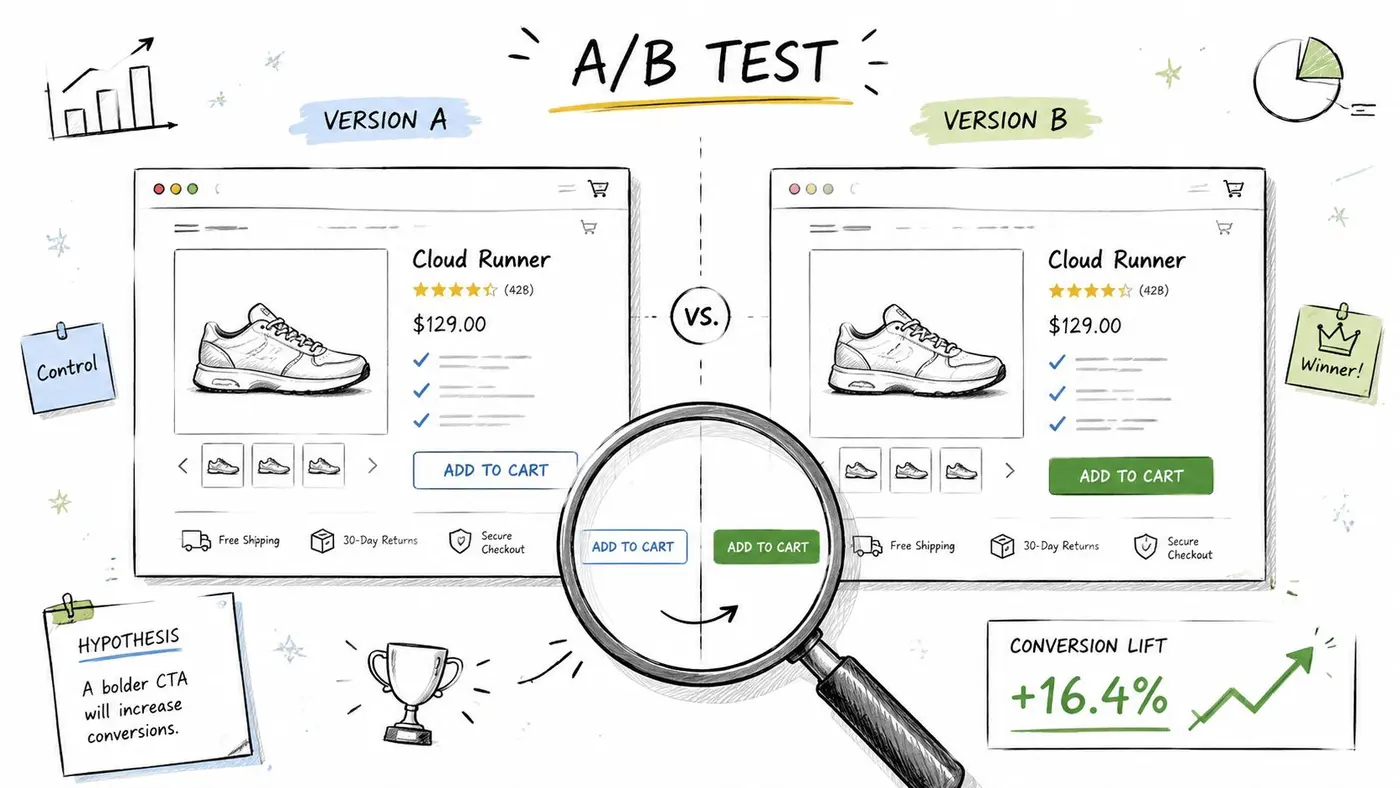
Assume a product-page control converts at 4.0% and a variant converts at 4.4%. The absolute difference is 0.4 percentage points, while the relative difference is 10% because the change is measured against the control rate.
Those two statements are both correct, but they create different impressions. The relative figure sounds substantial, while the absolute figure tells the implementation team how much the funnel moved. To decide whether to ship, estimate the incremental gross profit from the additional purchases, then subtract implementation and monitoring costs.
The result may be worth deploying if the change is low-risk and the upside is durable. If the variant required a complex redesign, the same movement might not justify the trade-off. For teams working on paid acquisition or channel measurement, a useful companion is this SaaS incrementality testing guide, because observed conversion change isn't always the same as incremental business impact.
Revenue per visitor
Now suppose the control produces £0.80 in revenue per visitor and the variant produces £0.86. The raw difference is £0.06 per visitor. To calculate Cohen's d, divide that difference by the pooled standard deviation of revenue per visitor.
If the metric has a wide, skewed distribution because a small number of customers place large orders, d may look modest even when the raw revenue movement is commercially relevant. In this case, report the currency difference, the distribution or variability assumptions, and the confidence interval. Consider whether the result persists when you examine purchasers separately, without changing the primary metric after seeing the data.
Average order value
Assume average order value rises from £72 to £75. The absolute change is £3 per order. Whether that matters depends on order volume, margin, fulfilment costs, refunds, and whether the treatment changes the number of orders.
A higher average order value can still reduce total revenue if it suppresses purchase conversion. Conversely, a small standardised effect may be attractive when the variant increases basket value without harming checkout completion. Evaluate the whole revenue path, not the most flattering metric.
Commercial reading: An effect size becomes useful when it survives contact with the complete customer journey and the cost of shipping the change.
Setting Meaningful Minimum Detectable Effects Before You Test
A minimum detectable effect, or MDE, should describe the smallest change worth detecting, not the smallest number that makes a spreadsheet look ambitious. Start with the decision, then work backwards to the statistical design.
Begin with the economics
Ask what improvement would pay for the work. Include engineering, design, QA, analytics, maintenance, customer support, and the value of the alternative work the team won't do. For an ecommerce experiment, translate the target into incremental contribution, not just extra conversions. For a SaaS onboarding test, include activation quality and downstream retention rather than celebrating a shallow click.
Write the threshold in plain business language first. “We would ship a change that produces a durable improvement in qualified activation and doesn't damage paid conversion” is more useful than presenting an unexplained statistical target.
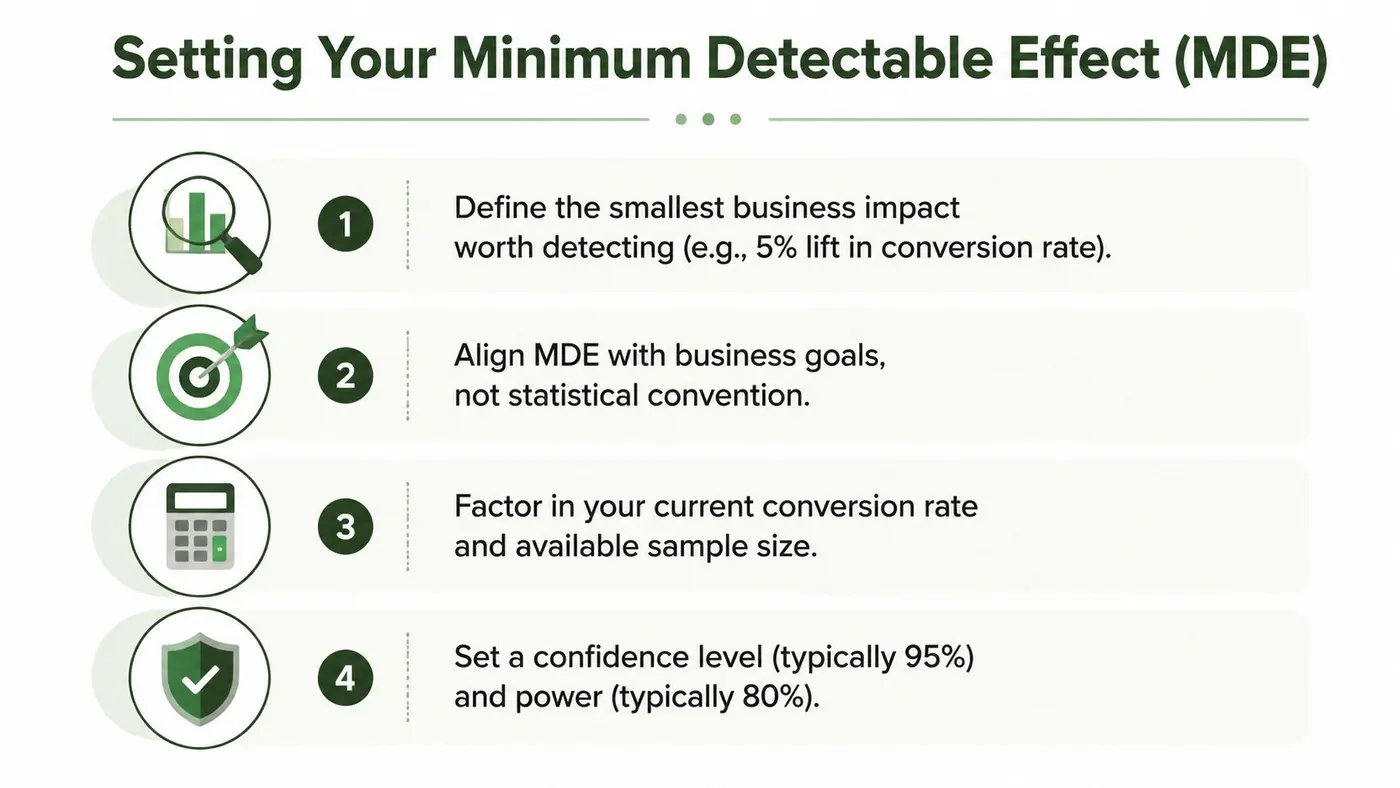
Use a disciplined planning sequence
-
Choose the primary outcome. Pick the metric tied most closely to the decision. Secondary metrics can identify harm or explain behaviour, but they shouldn't replace the primary measure after launch.
-
Set the smallest worthwhile effect. Use the original unit where possible, such as percentage points, pounds per visitor, or completed activations. Only then convert it into the effect-size measure needed by the analysis tool.
-
Check feasibility. Compare the target with available traffic, expected variance, test duration, and operational constraints. A target that requires an impractical test should trigger a scope change, not hidden optimism.
-
Agree the decision rules. Define what happens if the interval sits above the business threshold, below it, or across it. This stops stakeholders from inventing a new success criterion when the result arrives.
The minimum detectable effect guide offers a focused reference for this planning step. Treat MDE as a decision contract between the growth, product, analytics, and engineering teams.
Don't confuse MDE with a guaranteed outcome
MDE is a design assumption, not a promise that the test will produce that effect. The observed estimate can be smaller, larger, or negative. Report the planned target alongside the actual estimate and its uncertainty so stakeholders can distinguish what the experiment was built to detect from what it found.
Reporting Results That Stakeholders Actually Understand
Lead with the decision, then show the evidence. A useful result summary says what changed in business terms, gives the absolute and relative movement where relevant, and explains how uncertain the estimate remains.
A strong format looks like this:
- Outcome: The variant increased or decreased the primary metric.
- Magnitude: State the raw difference first, followed by the standardised measure if it adds comparison value.
- Uncertainty: Include the confidence interval and explain whether it sits above, below, or across the business threshold.
- Decision: Ship, iterate, extend the test, or stop, with the reason stated plainly.
Avoid declaring a winner solely because a p-value crossed a threshold. Avoid calling a result “no impact” when the interval is wide enough to include a meaningful benefit. The confidence interval guide gives stakeholders a clearer way to understand that uncertainty.
Keep a testing record containing the hypothesis, primary outcome, planned MDE, observed effect, interval, implementation cost, and final decision. Over time, that archive helps your team learn which types of changes produce worthwhile movement in your own environment.
Use Otter A/B as one option for running website experiments when you need conversion, purchase, average order value, and revenue reporting alongside frequentist significance and confidence intervals. Visit Otter A/B to start a free experiment, define a business outcome before launch, and judge the result by impact rather than the label attached to its effect size.
Stop guessing
Ready to start testing?
Set up your first A/B test in under five minutes. No credit card required.
- 14-day free trial
- No credit card required
- Cancel anytime