Incrementality Testing: A Practical Guide for Marketers
Learn incrementality testing explained with clear definitions, experimental designs, and how to tie results to real revenue outcomes.

The most popular advice about incrementality testing is also the least useful for many smaller advertisers: create a clean holdout, wait for a statistically significant result, then move the budget. That describes the textbook, not the operating conditions of a small UK ecommerce brand with limited conversions, overlapping campaigns, seasonal demand, and no dedicated experimentation team.
The underlying question remains simple: would this sale have happened without the marketing activity? Attribution can show which touchpoints appeared before the sale. Incrementality testing tries to measure what the marketing caused. The difference matters because budget decisions depend on marginal results, not on how many platforms can claim the same conversion.
UK adoption is moving in that direction. A UK-focused industry article reports that 31% of brands were running some form of incrementality test in 2026, compared with 12% in 2024, while geo holdouts were used by 51% of incrementality testers and platform-native lift tests by 47%. The same article reports a median of 4.2 tests per year among brands running them, evidence that testing is becoming a repeatable measurement process rather than an occasional audit. (UK incrementality testing and attribution statistics)
Why Attribution Alone Is Not Enough
Most marketing dashboards answer a correlation question: which touchpoint appeared before a conversion? Last-click attribution gives the final interaction the credit. Multi-touch attribution distributes credit across several interactions. Data-driven models use patterns in the journey to assign credit differently.
None of those approaches, by themselves, establishes that the conversion depended on the marketing. A person who searches for your brand, clicks a paid search advert, and buys may already have decided to purchase. The advert appears in the path, but its presence may not have changed the outcome.
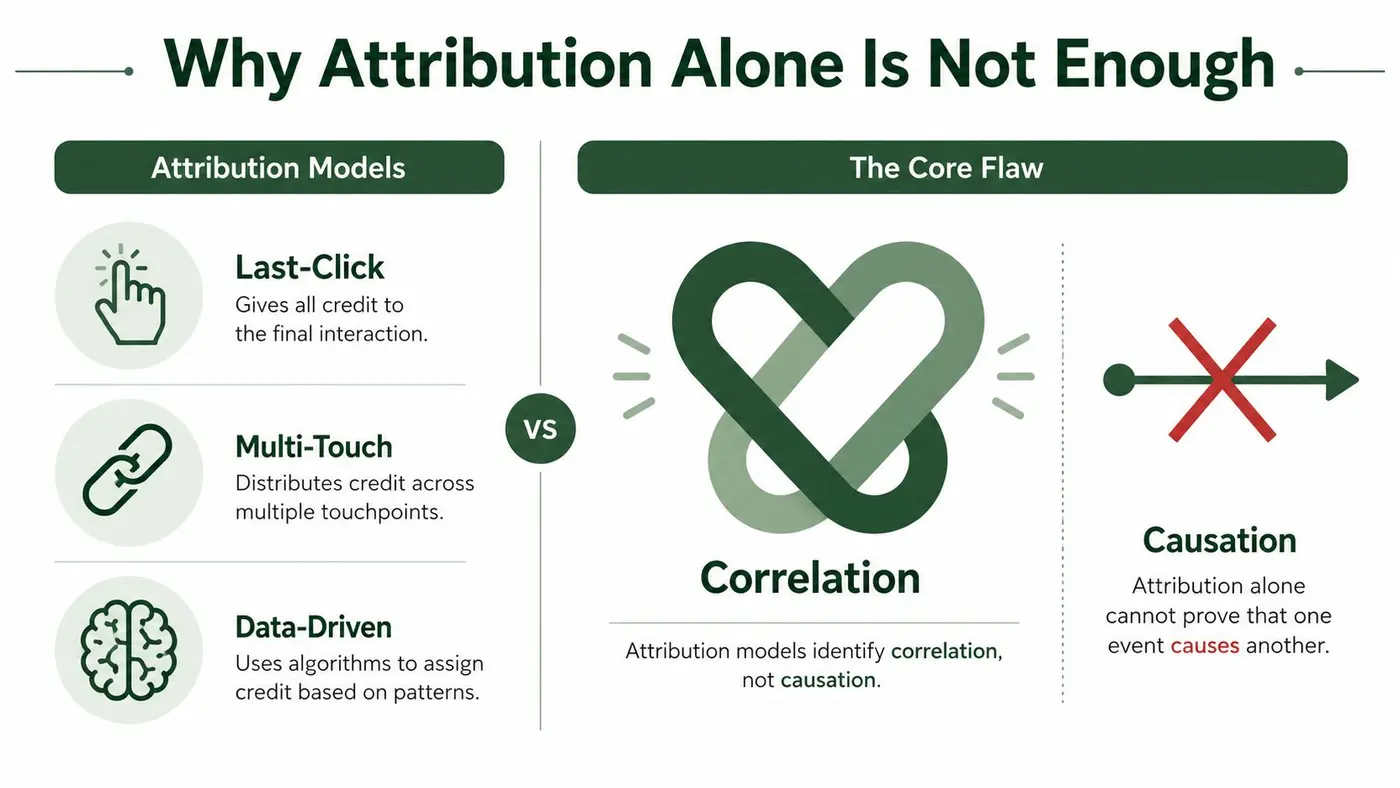
Correlation records the path, causation tests the difference
A useful analogy is a shop with a sign outside. On rainy days, more customers may enter after seeing the sign, but rain could be the factor that changed footfall. The sign and visits correlate, yet the sign may not have caused every visit.
Marketing has the same problem. High-intent customers are often easier to reach, more likely to click, and more likely to convert. An attribution model can reward the channel for finding those customers even when the campaign added little extra demand.
The causal alternative is to compare a treatment group that receives the marketing with a comparable control group that doesn't. If the exposed group produces more conversions after accounting for the test design, the difference is an estimate of incremental conversions. Incrementality means the revenue or conversions that occurred because the intervention was present and wouldn't otherwise have occurred.
Practical rule: Attribution tells you where a conversion was observed. Incrementality asks whether the conversion depended on the marketing.
Why this changes budget decisions
Suppose a campaign reports strong attributed revenue, but conversions remain broadly unchanged when the campaign is withheld from a comparable group. The platform's report may still be internally accurate, yet it can be over-crediting the campaign's causal contribution.
This creates an attribution tax. Several platforms can claim the same order because each recorded an interaction, while the business treats the combined claims as separate evidence of value. That inflates apparent performance and conceals true marginal return.
Before running a test, validate the underlying tracking and revenue definitions. A practical resource on attribution data validation tips can help teams check whether their reporting inputs are consistent before they interpret a causal result.
The Three Core Experimental Designs
No experimental design is universally superior. The right choice depends on whether you can control exposure at user level, whether your campaign reaches identifiable regions, and whether a platform permits a clean no-ad condition.
| Experimental Design Comparison | Design | Best For | Traffic Needed | Bias Risk | Practical Fit |
|---|---|---|---|---|---|
| User-level holdout | Digital campaigns with platform support | High audience volume | Low when randomised correctly | Cleanest option, but platform-dependent | |
| Geo-based test | Regional, offline, TV, or privacy-sensitive activity | Sufficient regional demand | Moderate if regions differ | Strong practical option for UK advertisers | |
| Time-based ghost ad or PSA test | Platforms that restrict user holdouts | Enough conversions across test windows | Higher if timing affects demand | Flexible, but vulnerable to seasonality |
User-level holdouts
A platform randomly assigns some eligible users to treatment and suppresses the tested adverts for the control group. The remaining users receive the campaign as normal. Comparing outcomes between the groups gives a direct estimate of lift, provided randomisation, exposure, conversion tracking, and spillover controls are sound.
This is often the cleanest approach because the groups can be balanced at the individual level. It also demands enough audience activity to distinguish a real difference from random variation, and the platform must support a credible holdout. Cross-platform overlap can complicate interpretation because a control user might still see related activity elsewhere.
Geo-based tests
A geo test assigns matched towns, regions, or other geographic areas to treatment and control. UK practitioners often recommend this design when individual-level randomisation isn't practical. The7stars describes geo-based test and control cells as the “gold-standard” for incrementality measurement, with the test cell nationally representative in volume and audience penetration and highly correlated with the control cell. (The7stars demand generation white paper)
The advantage is reach. Regional tests can include online and offline activity without depending on user identifiers. The weakness is that regions can differ in baseline demand, promotions, competitor activity, weather, and seasonality. Matching and pre-test analysis therefore matter as much as the campaign switch itself.
Time-based ghost ads or PSA tests
A time-based design alternates campaign activity across defined windows. In a ghost ad setup, the platform identifies an eligible impression but withholds the advert from the control condition. A public service announcement can sometimes replace the commercial creative, preserving an impression opportunity without delivering the tested message.
This approach helps when user-level suppression isn't available. It carries greater risk from weekly patterns, promotions, paydays, stock changes, and changing auction conditions. A control group testing guide from AdStellar AI is useful for reviewing the mechanics of treatment and control assignment before choosing this compromise.
Statistical Considerations You Cannot Skip
A positive campaign result can still be a coincidence. Statistical design sets the rules for separating a real causal effect from ordinary fluctuation, before the numbers begin influencing budget decisions.
Start with the significance level. A 95% threshold means accepting a stated risk that random variation produced the observed result. It is a decision rule, not a guarantee that the campaign worked. The distinction matters because exposed customers may already differ from unexposed customers, while incrementality asks what changed because of the advertising.
Statistical power asks a separate question: if a meaningful effect exists, how likely is the test to detect it? Sample size depends on the baseline conversion rate and the minimum detectable effect, or MDE, that would justify action. A small advertiser seeking evidence of a modest lift needs more data than one prepared to act only on a substantial commercial difference. Use this practical guide to calculate statistical power while planning the design.
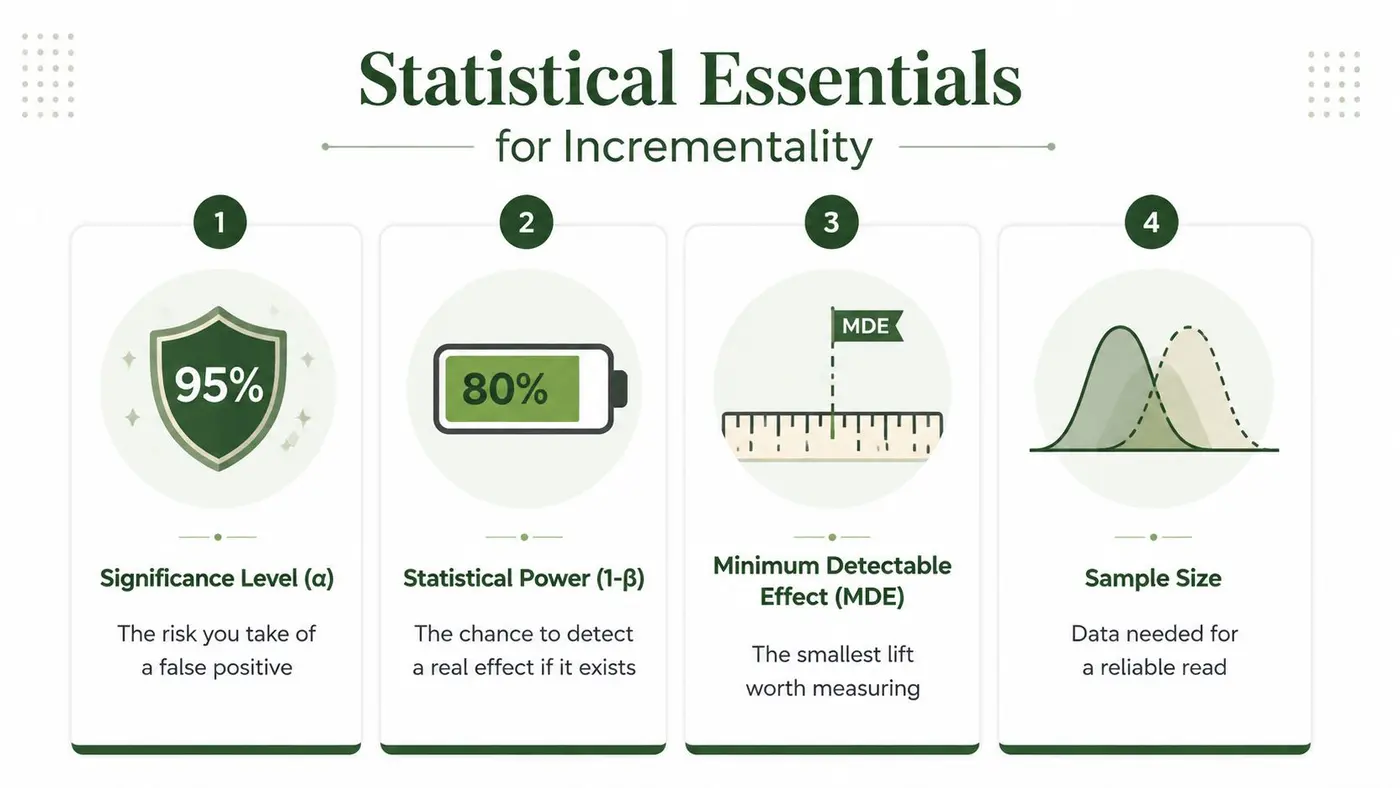
Time is part of the design
Many incrementality tests run for 4 to 8 weeks and require at least 1,000 conversions per test cell for reliable results. Brand effects may take 3 to 6 months to appear, so a short performance test may not capture longer-cycle demand creation. These planning ranges are useful benchmarks, not universal laws for every advertiser.
A test covering only part of the purchase cycle can misclassify delayed conversions. A window containing an unusual promotion or a single holiday period can produce a result that fails to generalise. Smaller teams may need to accept a larger MDE, extend the test, or combine experimental evidence with MMM rather than force a textbook design onto insufficient volume.
Don't peek and stop early
Repeatedly checking results and stopping when the lift first looks positive gives random noise several chances to appear convincing. That practice changes the probability of a false positive.
Pre-register the primary outcome, test window, decision threshold, and treatment definition. A non-significant result does not prove zero lift. It means the available design and traffic did not detect a reliable effect, which may justify running longer, accepting a larger MDE, improving measurement, or using a model for the decision.
Reading Results and Tying Them to Revenue
A test report usually contains three pieces of evidence. The point estimate is the measured difference between treatment and control. The confidence interval shows how wide the plausible range is. The p-value helps assess whether random variation is a credible explanation under the chosen testing assumptions.
A wide interval that crosses zero is noisy. It doesn't establish that the campaign has no value, but it does warn you against treating a positive point estimate as a dependable scaling signal. A tighter interval entirely above zero gives stronger evidence that treatment outperformed control under the tested conditions.
Commercial size still matters. A statistically significant lift can be too small to justify the operational cost, creative workload, or opportunity cost of additional spend. A larger lift may support scaling, but you should still check whether it holds at the planned budget level, whether marginal efficiency will decline, and whether the test measured revenue that finance recognises.
Turn lift into a decision
Use the result in the language of the budget. If treatment generated more conversions than control, estimate incremental conversions by applying the control outcome as the expected no-ad baseline. Apply the same logic to revenue, then divide incremental revenue by media spend to calculate incremental ROAS.
| Translating Incrementality Output Into Business Decisions | Test Output | Business Translation | Likely Budget Action |
|---|---|---|---|
| Positive, precise lift | The campaign caused additional demand in the tested setting | Consider reallocating or scaling, then validate at the new level | |
| Positive but wide interval | Direction is encouraging, but uncertainty remains high | Extend, redesign, or make a cautious provisional decision | |
| Interval crossing zero | No dependable causal signal was detected | Avoid claiming efficiency; investigate or reduce exposure | |
| Incremental revenue below media spend | The activity didn't cover its measured media cost | Cut, restructure, or test a different audience or message |
A simple projection illustrates the difference. Suppose a test has 2,000 conversions in treatment and 1,600 conversions in control, with equal-sized groups. The control rate becomes the estimate of what treatment would have produced without the campaign. If the treatment group would have produced 1,600 conversions at that baseline, the measured campaign contribution is 400 incremental conversions, not the full 2,000 attributed conversions.
That example uses invented values to explain the method, not a benchmark or reported result. Your actual calculation must use the tested groups' sizes, conversion definitions, revenue data, confidence interval, and media spend.
Making Incrementality Work With Limited Volume
Small advertisers may hear enterprise testing requirements and decide that incrementality is out of reach. That conclusion confuses an ideal design with a useful decision. Some guidance describes tests lasting 4 to 8 weeks and requiring at least 1,000 conversions per test cell, while a UK incrementality testing guide for smaller advertisers discusses a rough minimum of 100 conversions in the exposed group. These figures show the gap between textbook reliability and what a smaller team can realistically collect. They are planning references, not universal pass or fail rules.
The right response is to make the compromise visible. Define the business decision first, then choose the design and outcome that can support it. A test that cannot detect a commercially meaningful change may still inform learning, but it should not be presented as precise proof.
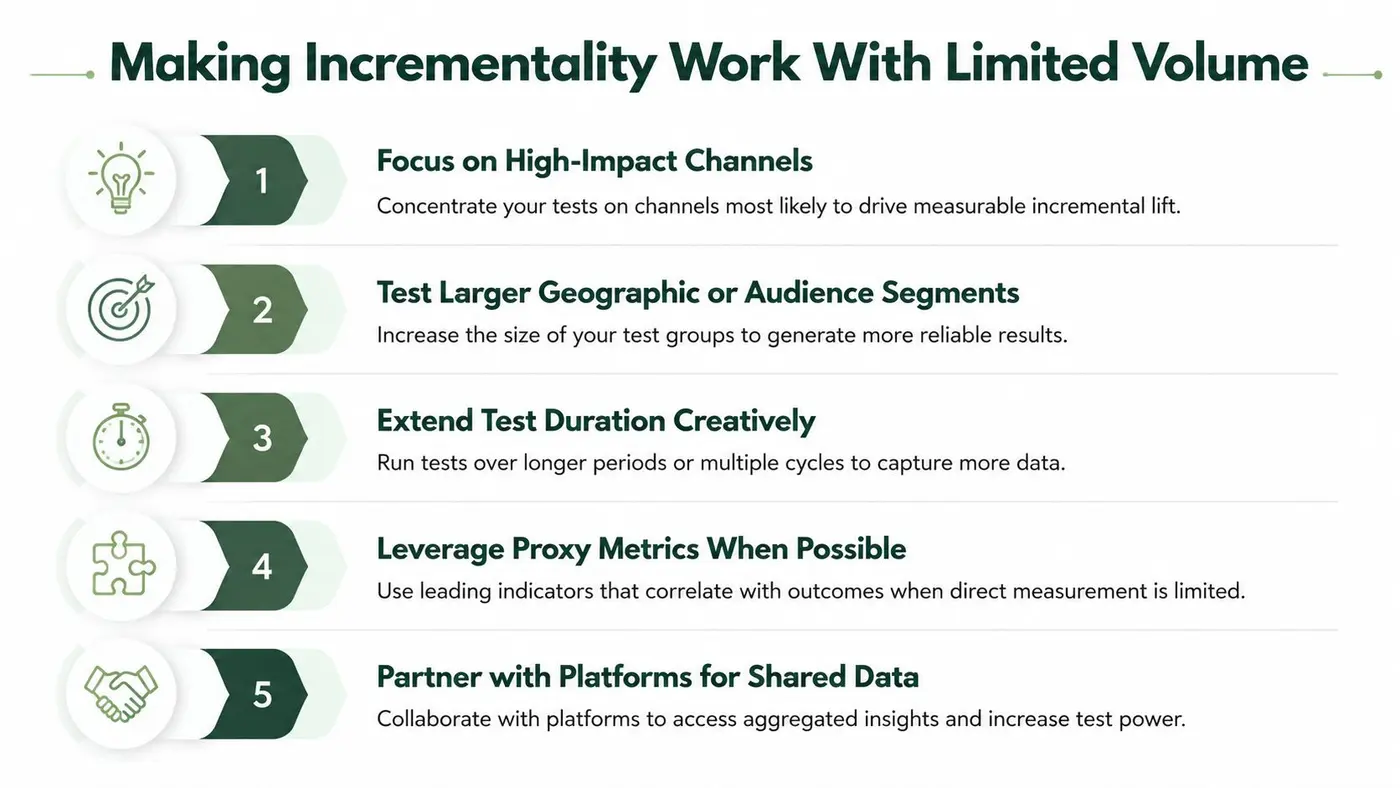
Practical compromises
- Extend the window: More weeks can produce additional conversions and capture weekly variation. The longer exposure also increases the chance that seasonality, stock changes, competitor activity, or budget fatigue affects the result.
- Test at campaign level: Combining related ad sets or audiences can produce a clearer signal sooner. The trade-off is reduced detail, since the result cannot identify which individual creative or segment caused the lift.
- Use a proxy outcome: Add-to-carts, qualified page visits, or email signups may arrive before purchases. Use them to shorten the feedback cycle only after checking that they have a meaningful relationship with revenue.
- Use a ghost design: Ghost ads can help when a true user holdout is unavailable. They require clean control of impression eligibility and checks that control users are not reached through another route.
- Use larger geographies: Regional testing can combine enough activity for analysis. Poorly matched areas still create bias, and extra volume will not correct that problem.
The minimum detectable effect sets the commercial boundary. A small business should not spend months proving a lift too small to change its budget. Set the smallest effect worth acting on, then assess whether available traffic can detect it. This guide to minimum detectable effect connects sample requirements to the decision instead of treating volume as an abstract target.
Decision rule: Run a controlled test when the decision is material and the design can produce a credible signal. Use a pre/post comparison with a control series when randomisation is unavailable. Use MMM with light experimental calibration when the business needs broader coverage than its traffic can support.
That final approach still requires discipline. Document uncertainty, use experiments where feasible, and avoid presenting a correlation-based estimate as causal proof.
Combining Incrementality Tests With MMM and Attribution
The argument that teams must choose between experiments and MMM is a false rivalry. Each method answers a different planning problem.
An experiment estimates causal lift in the channel, audience, geography, spend range, and period you tested. It offers strong evidence inside that domain, assuming the design is valid. Marketing Mix Modeling uses historical relationships between spend, outcomes, and external factors to estimate contribution across a broader set of channels and markets. It can cover activity that would be impractical to hold out, but it depends on model specification, data quality, variation, and assumptions.
Attribution remains useful for daily in-channel operations. It can help identify broken links, delivery issues, creative engagement, and journeys that deserve attention. It shouldn't be mistaken for a causal budget ledger. A practical marketing attribution playbook can help teams organise those operational signals without giving them more authority than they deserve.
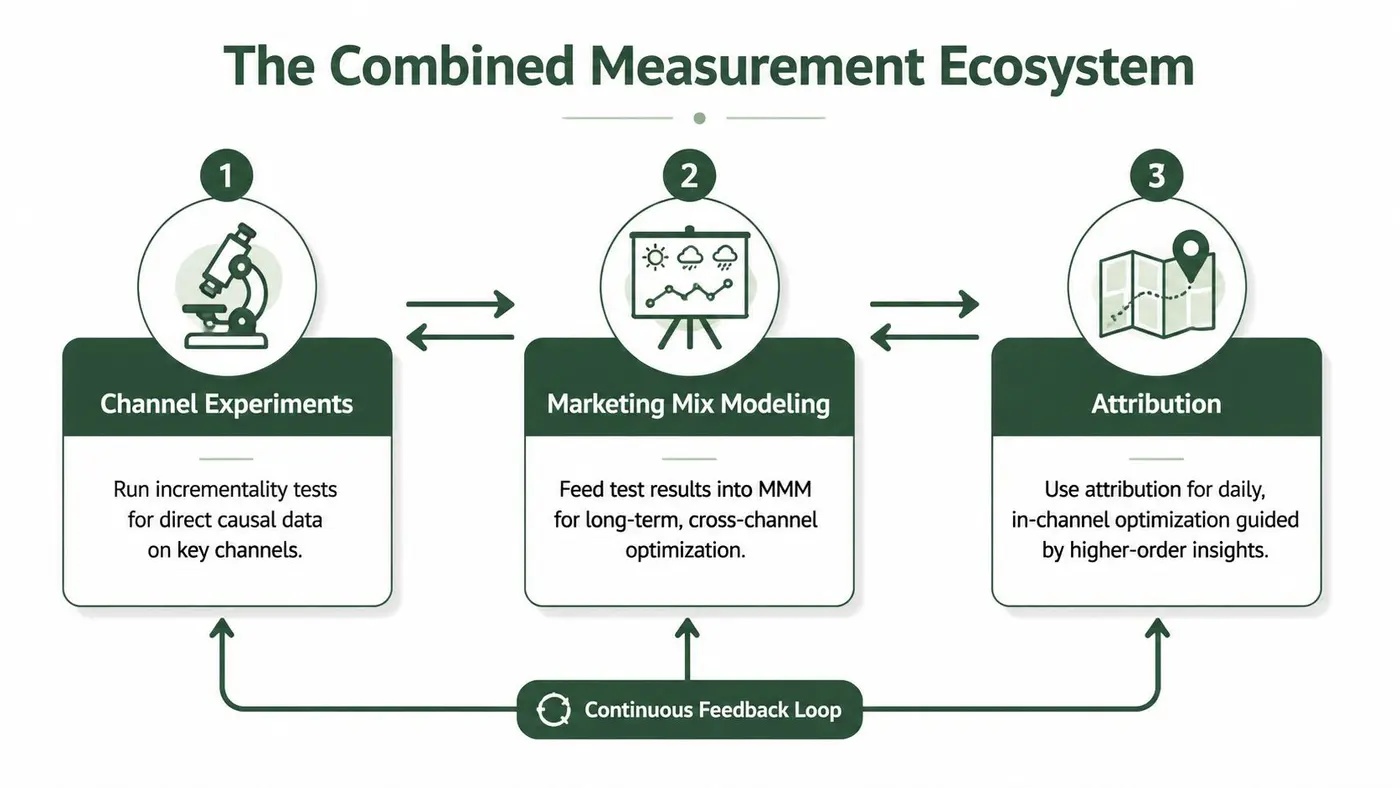
When should a test override the model?
Trust the experiment when its domain overlaps directly with the decision. If you're deciding whether to maintain a paid social budget in the same market, audience, season, and spend range as the test, the measured causal result deserves priority over a model that points in the opposite direction.
Use MMM when the decision extends beyond the tested domain. A single experiment can't establish how every channel interacts across every market and future season. It can provide a calibration point, not a permanent universal truth.
A UK BrandAlley case study published in 2025 describes an incrementality test used to validate a Marketing Mix Model, illustrating this triangulation approach. Google also says that experiments that once cost more than $100,000 can now be run for about $5,000, which signals that more brands can use tests as model-validation inputs rather than treating experimentation as an enterprise-only activity. (Google Ads incrementality measurement guidance)
A workable quarterly process is straightforward:
- Record the test scope, treatment, control, outcome, spend, point estimate, and uncertainty.
- Compare the measured lift with the MMM estimate for the same scope and period.
- Investigate differences before changing the model, including seasonality, overlap, saturation, and conversion lag.
- Use the experimental result as a calibration prior or validation anchor.
- Run a posterior check after the model update, then record the budget decision and the conditions under which it should be revisited.
For teams handling website experiments as part of the broader evidence set, multi-touch attribution guidance can sit alongside, not above, causal testing.
Common Misinterpretations and a Practical Checklist
A positive lift is a result, not a budget instruction. It may depend on a temporary promotion, apply only at the tested spend level, or carry enough uncertainty to change the decision. Relative lift can also look large while adding too little revenue to cover media cost.
A useful checklist should catch problems that emerge after the experiment is designed:
- Check for spillover: Confirm whether people in the control group could see the treatment through shared households, audiences, stores, or word of mouth. Spillover makes the control less independent and can reduce the measured lift.
- Monitor creative fatigue: Record how often each group saw the creative. A result from a fresh launch may weaken as exposure accumulates, so note frequency and retest when the campaign enters a different fatigue stage.
- Watch for model drift: Revisit the result when tracking rules, consent rates, landing pages, product mix, or bidding systems change. A stable estimate under old conditions may not describe the current campaign.
- Define the decision boundary: Write down the lift, incremental revenue, or incremental ROAS needed to increase, hold, or reduce spend. This prevents a statistically positive result from becoming an automatic scaling recommendation.
- Test the operating range: If the next budget decision differs materially from the tested spend, label the result as a calibration point rather than assuming the same efficiency continues.
- Record exclusions: Document markets, audiences, products, promotions, and channels left outside the test. Future users of the result need to know its boundary.
- Reconcile delayed outcomes: Match the reporting window to the purchase delay, and mark any outcomes that remain immature when the result is reviewed.
- Separate implementation from inference: Note delivery problems, missing conversions, uneven exposure, and tracking changes alongside the estimate. These are interpretation risks, not merely reporting details.
- Set a review trigger: Specify the business change that should prompt a new test, such as a major creative change, pricing change, seasonal shift, or channel expansion.
- Connect evidence without forcing agreement: Compare the result with MMM and attribution, explain differences, and preserve the disagreement when the methods answer different questions.
For a smaller advertiser, textbook certainty may be unrealistic for every channel. The practical standard is transparent scope, documented limitations, and a decision that matches the evidence available. An experiment can calibrate MMM, challenge an attribution pattern, or justify further testing without pretending to settle every future budget question.
Otter A/B helps teams run controlled website experiments on headlines, CTAs, layouts, purchases, average order value, and revenue per variant. Visit Otter A/B to test website experiences and compare observed conversion changes with evidence from holdouts, attribution, and MMM.
Stop guessing
Ready to start testing?
Set up your first A/B test in under five minutes. No credit card required.
- 14-day free trial
- No credit card required
- Cancel anytime