Master Multi Touch Attribution: Your 2026 Guide
Understand multi touch attribution to see your full customer journey. Learn the models, implementation steps, and how to drive real growth beyond the last

You're probably staring at a dashboard that says paid search “won” the deal, even though the buyer first found you through a blog post, came back by email, then converted after a direct visit on desktop. That's the classic last-click trap, and it's why multi-touch attribution matters when customer journeys are messy, cross-device, and rarely linear.
In the UK, that mess is now normal. Ofcom reported that UK adults spent an average of 4 hours 20 minutes per day online in 2024, and adults aged 16 to 24 spent 6 hours 1 minute online daily in the same year, which means people are moving across search, social, email, and direct visits before they buy, not sitting inside one neat channel path (Ofcom usage data as cited in industry attribution research). When teams implement multi-touch attribution, industry research reports a 23% improvement in budget-allocation accuracy and a 12 to 18% reduction in customer acquisition costs, because credit gets spread across the journey instead of being dumped on the final click (same industry attribution research).

For UK growth teams, that's the practical shift, not theoretical measurement purity. If a journey spans mobile research, desktop conversion, and an offline nudge that later turns into an online lead, single-touch reporting is usually too blunt to guide budget confidently. MTA doesn't fix every blind spot, but it gives you a better default when customer behaviour is multi-device and multi-channel.
Beyond the Last Click Why MTA Matters More Than Ever
A campaign can look weak in last-click reporting and still be doing important work upstream. That's the pattern many marketing teams recognise only after a quarter of overfunding the channels closest to the sale and underfunding the ones that start demand. Multi-touch attribution exists to show the whole path, not just the last tap before conversion.
Why the last interaction gets too much credit
Last-click attribution is simple, which is why it sticks around, but simplicity is not the same as accuracy. If someone reads a comparison article, clicks a retargeting ad, opens an email, then finally converts via direct traffic, last-click makes the final step look like the hero. In reality, the earlier touches may have created the demand that made the final visit possible.
That matters more in the UK because browsing habits are fragmented across devices and channels. Ofcom's usage figures show that online behaviour is embedded into everyday routines, not limited to a single browser session or a single device (Ofcom usage data as cited in industry attribution research). Once journeys look like that, a single-touch model stops being a neutral simplification and starts becoming a bias.
Practical rule: If a channel only looks brilliant when it appears at the end of the journey, treat that result as a measurement warning, not proof of performance.
MTA is a way to spread credit across the interactions that contribute to a conversion. That usually means search, social, email, remarketing, direct, and sometimes offline touchpoints all matter in different proportions. The point isn't to crown one true winner, it's to stop rewarding the final click for work it didn't do alone.
What good attribution changes in practice
When teams implement MTA properly, budget conversations usually get sharper. Industry research says attribution implementations can improve budget-allocation accuracy by 23% and reduce customer acquisition costs by 12 to 18% (industry attribution research). You don't get those gains from a prettier dashboard, you get them when credit allocation changes media decisions.
The value is directional. MTA helps a growth team answer which channels assist, which ones close, and which ones are getting over-credited because they sit nearest to the form fill. That's a much more useful conversation than defending every channel with the same last-click report.
The Common Attribution Models Explained
Attribution only becomes useful when the model matches the buying pattern you are trying to measure. A quick purchase, a considered B2B cycle, and a multi-device journey all tell a different story, so the credit split has to reflect that reality rather than force every conversion into the same shape.
Rule-based models in plain English
Linear attribution gives every touchpoint the same share of credit. That makes the model easy to explain, but it can flatten the difference between a casual visit and a touchpoint that moved the buyer forward.
Time-decay attribution gives more credit to touches closer to conversion. It fits shorter buying cycles and promotion-led activity, although it can still understate the role of early awareness. For a broader framework on choosing models in practice, this attribution modelling guide is a useful reference before you commit to a rule set.
U-Shaped attribution gives most credit to the first and last touches, then shares the middle across the rest. That works well when you want to recognise both demand creation and the final push to convert, which is why commercial teams often find it easy to understand.
W-Shaped attribution adds a key midpoint, often a lead creation event or opportunity stage. It suits B2B journeys better when the sales process has clear gates and the midpoint carries real weight, not just the first and last interactions.
| Model | How It Works | Best For | Potential Drawback |
|---|---|---|---|
| Linear | Splits credit evenly across all touches | Teams that want a simple shared-credit view | Can overstate low-impact touches |
| Time-Decay | Gives more credit to later touches | Shorter or more time-sensitive journeys | May under-credit demand generation |
| U-Shaped | Credits first and last touches most | Teams balancing awareness and conversion | Middle touches can be undervalued |
| W-Shaped | Credits first touch, key lead milestone, and last touch | B2B funnels with clear stage transitions | Needs clean CRM milestones |
The right model depends on how your business sells. A fast e-commerce brand with short journeys needs a different lens from a B2B sales team working through multiple stakeholders and longer decision windows. If you force both into the same scoring rule, the report may look tidy but the result will be misleading.
Practical rule: Start with a rule-based model that your commercial team can explain in one sentence. If they cannot interpret it, they will not trust it when the numbers move.
Advanced data-driven models can do more, but only when identity resolution and data volume are good enough to support them. When journey data is thin or stitched together badly, a transparent rule-based model often gives better operational value than a black box. That trade-off matters for UK marketers working with consent limits, partial journeys, and channel data that does not always line up cleanly.
How to compare models without getting lost
The simplest test is to run the same journey through two or three models and see how credit shifts. If your media team cannot explain why the distribution changed, the problem is often data quality or journey length rather than the model itself. That is usually the first thing to check, not the model label.
A useful comparison should answer three questions. Which channels gain more credit under each model, which stakeholders benefit from that version of the story, and which version fits the way customers buy. If those answers do not line up, do not force agreement too early.
Model choice also affects tool selection and reporting discipline. Teams comparing platforms can use SourceLoop's tool recommendations as a starting point, then test whether the platform can support the journeys they see in their own data.
How to Implement Multi-Touch Attribution
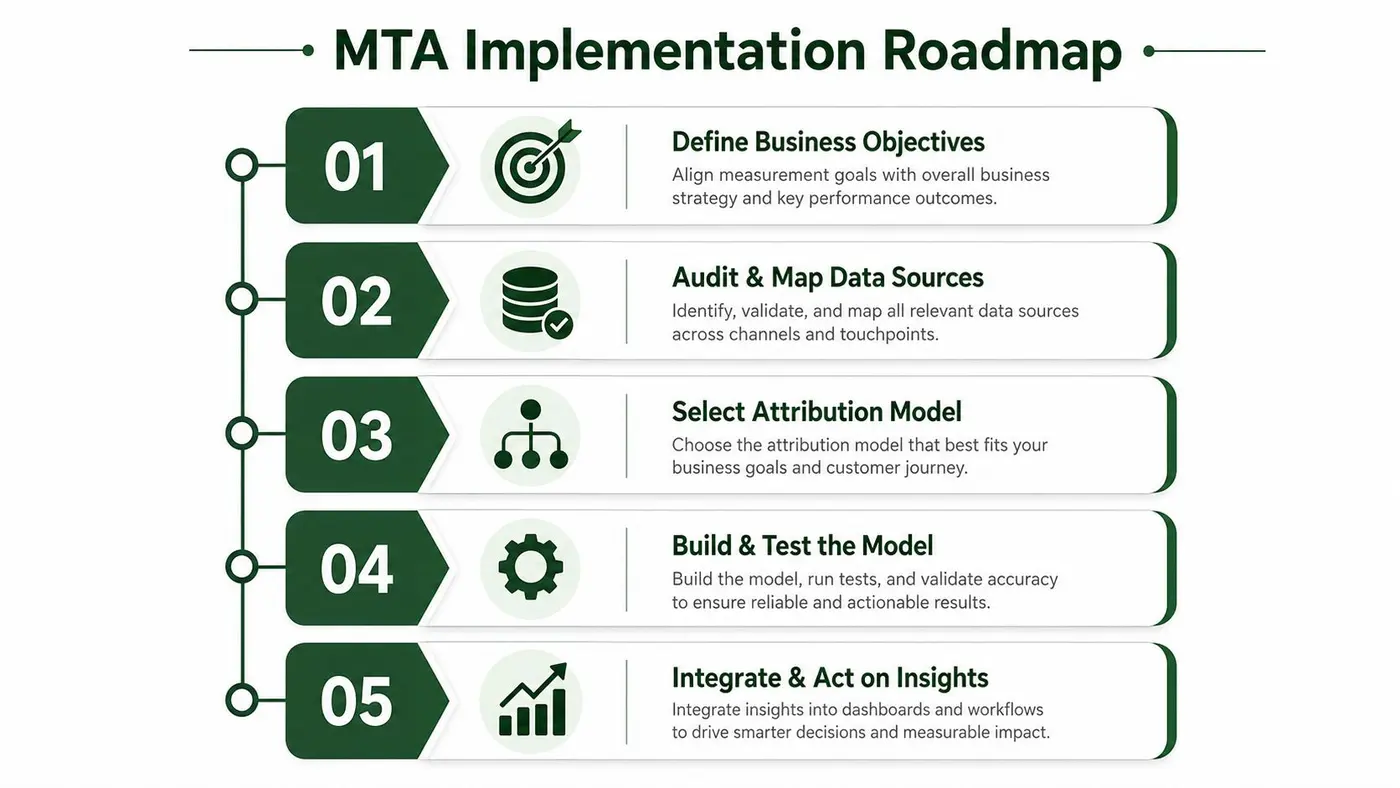
Multi-touch attribution is a data-engineering problem before it's a reporting problem. The model matters, but the system only works if touchpoints are captured consistently, identities are stitched with care, and the final dataset is queryable in one place.
The pipeline you actually need
The cleanest implementation pattern is straightforward. First, collect first-party events across web, app, CRM, and paid media. Then unify identity and data into a central warehouse. Finally, query and report on the combined dataset so fractional credit can be assigned across channels and devices (Twilio's introduction to multi-touch attribution).
That architecture matters because attribution breaks when touchpoints live in separate systems that don't agree on who the customer is. Analytics platforms show one version of the journey, CRM shows another, and ad platforms often show a third. The warehouse becomes the place where those versions can be reconciled.
What to ask your technical team
You don't need to build the stack yourself, but you do need to know what good looks like. Ask whether they can capture campaign IDs cleanly, unify user records across devices, and keep conversion data in a warehouse that supports repeatable reporting. If the answer is vague, the attribution project will probably drift into dashboard theatre.
The tools involved usually fall into three buckets. Analytics platforms capture behavioural events, CDPs help with identity and audience data, and warehouses hold the combined history. SourceLoop's tool recommendations for multi-touch attribution are a useful short list if you're comparing what sits in each layer.
Practical rule: If your team can't describe the path from click to warehouse to report, you don't have an attribution system yet. You have disconnected tracking.
A sensible launch sequence
Start with a narrow use case, not every channel at once. A controlled launch is easier to debug, easier to explain, and less likely to create political fallout when channel credit shifts. If your stack already uses Google Analytics, conversion tracking setup fundamentals are a helpful baseline before you expand into broader attribution.
The embedded walkthrough below is useful if your team prefers a visual primer on the implementation logic.
The launch should end with a report that people can trust, not just a model that looks advanced. If the team can't trace the logic from source to insight, the whole exercise becomes hard to defend when budget decisions follow.
Navigating Common MTA Challenges and Pitfalls
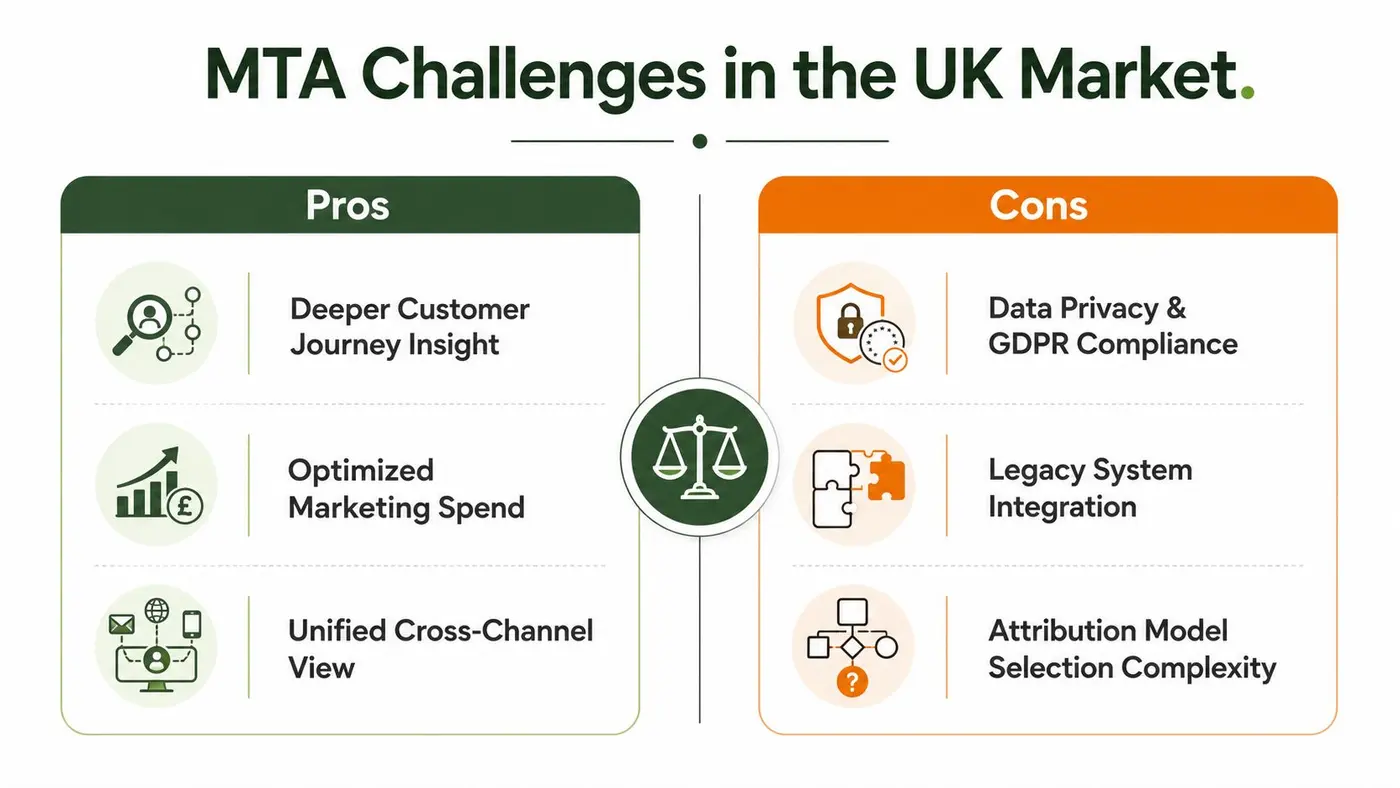
The biggest MTA mistake in UK marketing is pretending privacy and consent constraints are edge cases. They're not. The ICO's PECR guidance requires consent for most cookies and similar identifiers used for tracking, which means cookie-based pathing has to be consent-aware and usually leans more heavily on first-party data, campaign IDs, and CRM outcomes (ICO PECR guidance as summarised in UK attribution practice).
Why identity stitching gets harder in the UK
The practical constraint isn't just model selection, it's identity completeness. Standard MTA guides still lean on JavaScript tracking, CRM joins, and deterministic or probabilistic stitching, but they often skip the question, how useful is the model when a large share of journeys can't be stitched perfectly? That question matters more when consent is uneven and browser privacy limits reduce observable path data (Adobe's overview of the gap in standard MTA guidance).
Incomplete journeys create black holes. A user might research on one device, click a social ad with limited visibility, then convert later through a direct visit that looks unrelated. If you only optimise to the visible pieces, you'll over-credit the easiest-to-measure channels.
What to do when the picture is incomplete
The answer is not to chase perfect attribution, because that's usually not available. The answer is to build decision-grade attribution, meaning the model is incomplete but stable enough to improve budget choices. That usually means first-party data capture, warehouse-based reporting, and server-side tracking where possible.
Practical rule: Better incomplete data that is consistent than complete-looking data that falls apart when you change one browser, one consent state, or one campaign source.
Server-side and warehouse-based designs are more resilient because they reduce dependence on third-party identifiers. They also make it easier to reconcile CRM outcomes with media spend, which matters when platform-reported conversions don't line up with internal sales records. If the system can show where the gaps are, the team can work around them instead of assuming they don't exist.
Choosing when not to force MTA
MTA is not always the right measurement layer. If offline influence dominates, or if journeys are so fragmented that the identity graph is weak, the model may produce tidy-looking nonsense. In those cases, a hybrid approach with incrementality testing or broader measurement methods is usually more honest than pretending user-level credit is reliable.
The important shift is to ask whether the data can support the question you want answered. If not, attribution should support decisions, not replace judgement. That mindset saves teams from building elaborate reporting systems that nobody trusts.
Making MTA Actionable with Experimentation
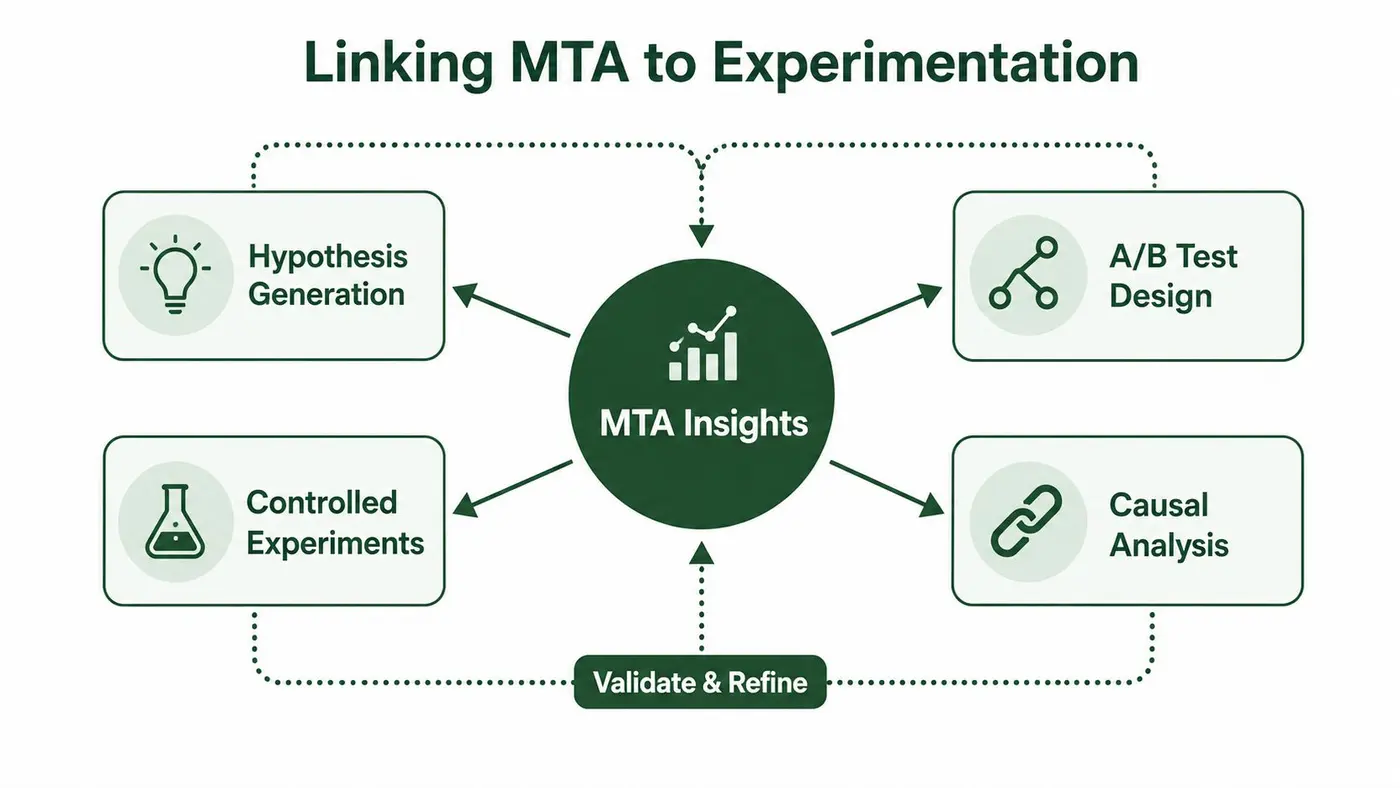
Attribution tells you where credit seems to belong. Experimentation tells you whether that credit was deserved. The two together are far more useful than either one alone, because MTA gives you the pattern and testing gives you the evidence.
Turning attribution signals into testable ideas
If MTA shows that a blog post repeatedly assists conversions, that doesn't mean the page is optimised. It means the page matters enough to test. A stronger call to action, a different offer, or a tighter content sequence might increase its contribution, but you won't know without a controlled experiment.
That's where experimentation closes the loop. MTA tells you which touchpoints matter in the journey, then A/B testing helps you isolate what changes the outcome on that touchpoint. Without testing, attribution can only hint at influence, not prove it.
Why a fast testing layer helps
Lightweight testing tools matter because attribution findings age quickly when teams sit on them. Otter A/B is one option for validating hypotheses quickly without slowing the site down, and it's built for simple experiment setup, traffic splitting, and revenue tracking. That kind of workflow is useful when you want to test whether a page that assists conversions can contribute more cleanly to revenue.
The main advantage of pairing the two systems is feedback speed. MTA surfaces the opportunity, the experiment checks the mechanism, and the revenue readout tells you whether the change mattered commercially. That loop is much stronger than making channel budget shifts from attribution alone.
Practical rule: Use MTA to decide where to test, then use experimentation to decide what to change.
What good collaboration looks like
The marketing analyst should not hand over attribution charts and disappear. Growth teams need a process where insights become hypotheses, hypotheses become tests, and test results feed back into the model and budget plan. That makes attribution an operating system, not just a retrospective report.
This also reduces overreaction to noisy data. If a channel appears to assist more often than expected, the next step is not instant budget expansion. It's a testable question, a controlled change, and then a measured response.
Measuring What Matters Tying Attribution to Revenue
Attribution only becomes useful when it connects to revenue, not just conversions. A lead that looks good in a dashboard but never progresses in the CRM is not a business outcome. The test is whether MTA helps you invest in channels that create profitable growth.
Why CRM data changes the picture
Once attribution is connected to CRM and sales outcomes, you can move beyond surface metrics. Revenue per channel, influence on customer lifetime value, and sales cycle effects all become visible when the model is tied to closed-won data rather than isolated form fills. That's the difference between reporting traffic activity and measuring commercial impact.
This is especially important in B2B and higher-consideration buying, where a conversion isn't the end of the story. A channel can generate plenty of leads and still deliver weak revenue quality. If the CRM isn't in the loop, attribution can overvalue quantity and miss the value of deal progression.
What to prioritise in the report
Your main output should help finance, sales, and marketing read the same story. That means the attribution view needs to line up with revenue tracking, so teams can see whether a channel contributes to meaningful pipeline, not just clicks or MQLs. For a practical framework on linking marketing activity to revenue trends, this revenue trend analysis guide is a relevant companion read.
The strongest attribution reports answer three simple questions. Which channels helped create revenue, which channels helped close it, and which channels look busy but don't change sales outcomes. If the report can't answer those, it's decorative, not strategic.
Practical rule: Budget should follow revenue influence, not the loudest channel dashboard.
What changes when revenue is the north star
Teams stop arguing about who “owns” the conversion and start asking which mix of touches produces the best commercial result. That's a better conversation because it's tied to profitability, not bragging rights. It also makes it easier to separate helpful awareness activity from inefficient spend.
Once that happens, MTA becomes a forward-looking tool. You're not just explaining what happened last month. You're shaping where money goes next.
Frequently Asked Questions About Multi-Touch Attribution
Is MTA still relevant in a privacy-first world
Yes, but only if you treat it as partial measurement rather than perfect truth. UK consent rules and browser privacy limits make full path visibility harder, so the value of MTA now depends on first-party data quality, identity resolution, and how much of the journey you can observe. If those foundations are weak, the model will still produce numbers, but they won't be decision-grade.
What's the difference between MTA and MMM
Marketing Mix Modelling works at an aggregate level, using historical spend and sales data to estimate channel contribution. Multi-touch attribution works at the user or session level, tracking individual touchpoints across a conversion path. In practice, MTA is better for digital path analysis, while MMM is more useful when offline channels and broad budget shifts matter more.
What data maturity do I need before starting
You need cleaner data than many organizations think. At minimum, you should have consistent UTM tagging, enough identity resolution to connect a meaningful share of sessions, and CRM data that can tie marketing touchpoints to revenue outcomes. If those pieces are missing, start by fixing them rather than buying a more complex attribution model.
When should a team avoid MTA
Avoid it when the identity graph is too fragmented, when conversions are too low for useful path analysis, or when offline influence is large and mostly untracked. In those cases, you'll often get more honest insight from simpler reporting, incrementality tests, or a hybrid measurement setup. MTA is useful when it can inform decisions, not when it creates false certainty.
If you want to turn attribution insight into action, visit Otter A/B and use fast experiments to test the pages, CTAs, and offers that your journey data says matter most. It's a practical way to validate what MTA is telling you, then feed the revenue results back into your budget decisions.
Stop guessing
Ready to start testing?
Set up your first A/B test in under five minutes. No credit card required.
- 14-day free trial
- No credit card required
- Cancel anytime