Evidence Based Marketing
Evidence based marketing - Ditch guesswork. Learn evidence-based marketing using data, A/B testing & analytics. Drive real growth & make smarter decisions in
Many organizations are closer to evidence based marketing than they think. They already have a website, ad accounts, CRM notes, sales feedback, support tickets, and a backlog of opinions about what “should” work. The problem isn't a lack of data. It's that decisions still get made in the meeting room, not in the evidence trail.
A familiar version of this looks like a homepage review. One person wants a shorter headline. Another wants to push social proof higher up the page. Someone senior says the current version “feels stronger”. The team ships a compromise, watches mixed results come in, and nobody can say which change helped, which change hurt, or whether the page was the issue at all.
That's where evidence based marketing matters. Not as an academic concept, and not as a demand for a full analytics department, but as a practical operating model. You start with a question, gather the right evidence, test a clear hypothesis, and make the next decision with less guesswork than the last one.
Smaller teams often assume this way of working belongs to large organisations with researchers, statisticians, and bespoke dashboards. It doesn't. A lean team can build a lightweight evidence pipeline with simple tooling, disciplined thinking, and a willingness to let results overrule preference.
Moving Beyond Guesswork to Evidence Based Marketing
Evidence based marketing starts with a blunt reality. Most bad marketing decisions aren't made because people are careless. They're made because teams confuse confidence with proof.
That happens everywhere. A founder prefers one message because it matches the brand story. A paid media manager doubles spend on a channel because last month looked good. A content lead keeps publishing a format because it generated praise internally. None of those inputs are useless. They're just incomplete.
The alternative is to treat marketing more like applied diagnosis than creative debate. You still use judgement. You still need taste. But you stop treating opinion as the final authority. In the UK, 57% of consumers say they prefer to see statistics in adverts to substantiate claims, and nearly six in ten identify statistics and evidence as the best way for advertisers to build belief, according to The Drum's coverage of the Ipsos Mori survey.
Where gut feel usually breaks down
The biggest weakness in intuition-led marketing isn't speed. It's attribution. Teams often know what happened last. They don't know what caused the outcome. That's why a more disciplined view of channel influence matters, especially when journeys span multiple touches. If you want a practical framing for that problem, Captapi insights on attribution are useful because they focus on how marketing activity gets over-credited or missed entirely.
A second weakness is memory. People remember the campaign they loved, the customer quote that matched their view, or the design revision that got praise from leadership. They rarely remember the ideas that felt obvious and then underperformed.
For teams trying to make that shift operational, this guide to data-driven decision making is a helpful complement. The core move is simple. Replace “What do we think will work?” with “What evidence would convince us?”
Marketing approach comparison
| Decision Area | Intuition-Led Approach Gut-Feel | Evidence-Based Approach |
|---|---|---|
| Messaging | Choose the copy that sounds strongest in the room | Test competing messages against a defined conversion goal |
| Channel allocation | Increase spend based on recent wins or personal confidence | Compare channel performance against business outcomes and attribution evidence |
| Landing page changes | Redesign multiple elements at once and hope overall performance improves | Isolate a meaningful variable and measure the effect cleanly |
| Reporting | Celebrate clicks, leads, and engagement in isolation | Connect activity to revenue, progression, and downstream quality |
| Team learning | Rely on memory and opinion after launch | Document hypotheses, outcomes, and what changed next |
Practical rule: if a decision can be tested and you skip the test, you're not saving time. You're borrowing uncertainty.
Evidence based marketing doesn't remove judgement. It gives judgement a better standard.
The Four Pillars of an Evidence Based Strategy
There's a common misunderstanding that evidence based marketing just means A/B testing. It doesn't. Testing is one pillar, not the whole structure.
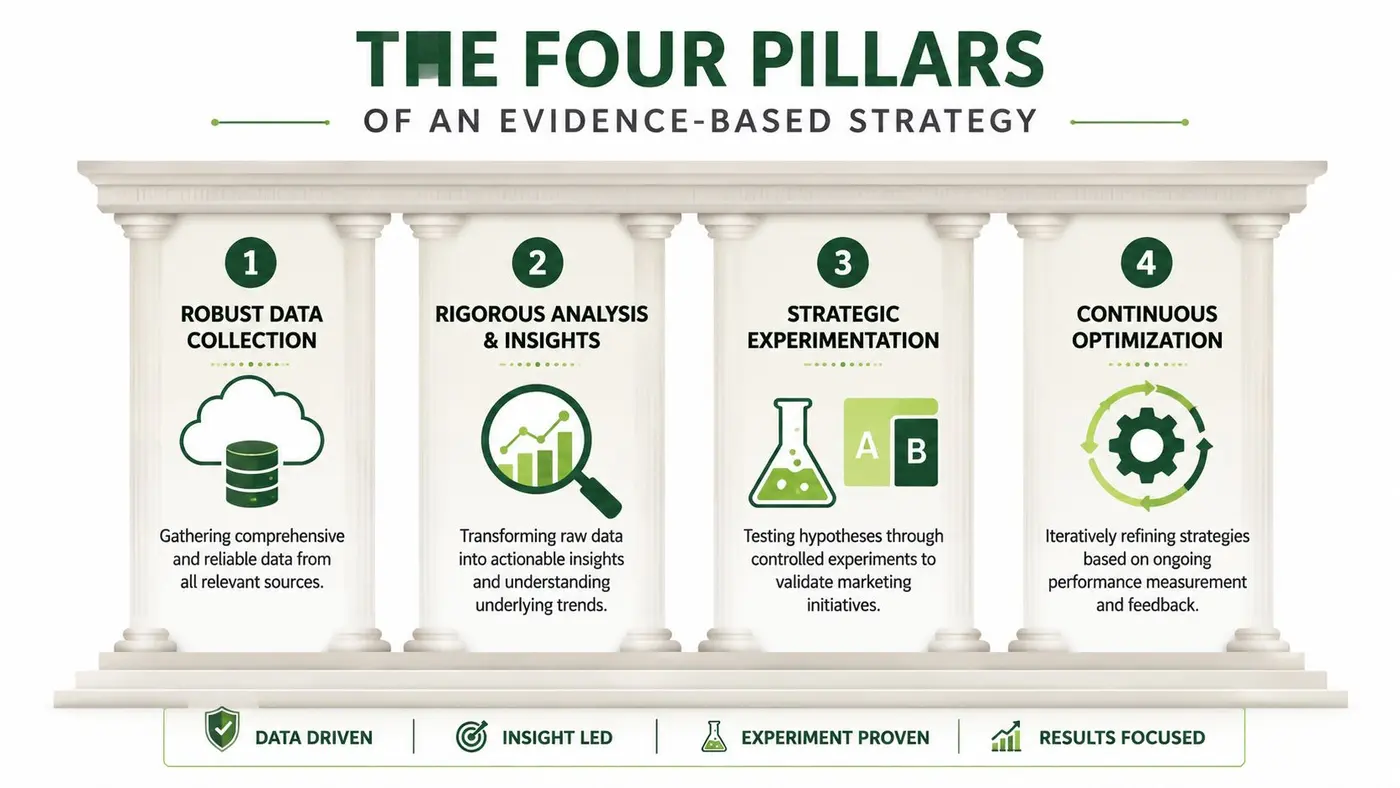
A stronger definition is this. Evidence-Based Marketing validates strategy against four pillars: peer-reviewed research, internal data, systematic experimentation, and practitioner expertise. The same source argues that UK organisations using this approach are 19 times more likely to be profitable than intuition-led counterparts, as outlined in Cognitigence's guide to evidence-based marketing.
Peer-reviewed research
This is your broad-principle layer. It helps you answer questions such as: what tends to improve trust, what kinds of framing affect perception, and which behavioural patterns show up across markets?
Most small teams won't read journals every week. That's fine. The point isn't to become academic. The point is to stop reinventing known lessons. Research gives you a prior. It tells you where to look first and which assumptions deserve scepticism.
Internal data
Your own analytics, CRM, product usage, call notes, and conversion data tell you what's happening in your context. This is the layer that turns general principles into specific action.
A useful discipline here is segmentation. Don't just ask whether a page converts. Ask which traffic source, audience segment, device type, or customer stage behaves differently. The answer is often less about “the page” and more about mismatch between intent and experience.
Systematic experimentation
Teams prove or disprove a claim under controlled conditions. Systematic experimentation matters because internal data alone can only tell you what happened. It can't reliably tell you what would have happened if the page, message, or offer were different.
Good experiments are narrow, documented, and tied to one meaningful question. Bad experiments test five ideas in one variant and then produce confusion dressed up as insight.
Practitioner expertise
This pillar gets ignored because people hear “evidence” and assume experience no longer matters. In practice, experienced marketers are often the ones who frame the right hypothesis, spot misleading metrics, and notice when a result is technically valid but commercially weak.
The strongest teams don't choose between expertise and evidence. They use expertise to design better evidence.
A lightweight strategy usually blends all four. Research helps you avoid naïve assumptions. Internal data highlights the bottleneck. Experimentation checks causality. Practitioner expertise decides what to test next and how to interpret the trade-offs.
Core Methodologies Marketers Need to Master
Methods matter because they stop “data-driven” from becoming a vague identity label. If your team can't connect a business question to the right method, you'll either over-measure the wrong thing or under-measure the right thing.

A B testing
A/B testing answers a narrow question: which of these versions performs better against a defined goal?
The simplest analogy is the eye test. Option one, or option two. Not a full redesign. Not a brand refresh. Just a controlled comparison where one meaningful variable changes and the team watches what users do.
Use it for questions like these:
- Headline choice: Does a benefit-led headline outperform a feature-led one on a pricing page?
- CTA wording: Do more visitors start checkout when the button promises a next step instead of a commitment?
- Layout order: Does moving trust proof closer to the form reduce hesitation?
The trap is testing cosmetic changes with no hypothesis behind them. If you can't explain why the variant should work, the result won't teach you much even if it wins.
Cohort analysis
Cohort analysis answers a different question. How does behaviour change over time for groups that started under different conditions?
Imagine following a class of students after graduation. You're not looking at everyone mixed together. You're comparing groups based on when they entered, what they experienced first, or which journey they took.
This is especially useful for onboarding, retention, and content quality. For example, if users who signed up after a pricing page rewrite activate differently from earlier users, you've learned something deeper than a top-line conversion rate.
If your team needs a clearer grounding on the difference between hard numbers and behavioural nuance, this explanation of qualitative vs quantitative research helps frame when each type of evidence should lead.
Attribution
Attribution asks the hardest question in marketing. Which touchpoints contributed to the outcome, and how much credit should each get?
That's why attribution work tends to frustrate teams. Last-click reporting is easy to read and easy to misuse. It tells you where the conversion was captured, not always where trust was built or demand was created.
A practical way to improve your approach is to combine platform data with direct customer evidence. Ask sales what prospects mention unprompted. Review branded search shifts after awareness campaigns. Compare assisted paths, not just final clicks. For content teams building the top of that evidence stack, practical steps for content research can sharpen how topics and claims get validated before publishing.
Attribution is never perfect. It only needs to be honest enough to stop bad decisions.
How to Build Your First Evidence Pipeline
A small team spots a drop in demo requests after a pricing page update. Slack fills up with opinions. Sales blames lead quality. Marketing blames traffic mix. Design wants a full rewrite. A simple evidence pipeline stops that spiral. It gives the team a way to test one explanation at a time and keep the learning.
Small teams do not need a warehouse, a data scientist, and six dashboards to get started. They need a repeatable path from question to decision. The job is to reduce avoidable mistakes and build a record of what drove performance.
That wider shift is not theoretical. The UK research and evidence market was projected to generate £18.74 billion in gross value added in 2026, according to the Market Research Society's report on the UK research and evidence market.
Step one and step two
Start with a specific question tied to a business outcome.
“We should improve the pricing page” is not specific enough to test. “If we reduce comparison clutter and make the primary plan easier to scan, more qualified visitors will start checkout” gives the team something they can build, measure, and judge.
Then define the test so the result is readable later. For a first pipeline, keep it tight:
- One main change: headline, CTA, form length, proof placement, or offer framing.
- One primary metric: started checkout, demo request, trial start, or purchase.
- One audience: all visitors or a defined segment such as paid traffic or returning users.
- One decision threshold: the result that would justify shipping the change, holding it, or testing again.
That last point matters. Teams waste a lot of time debating results they never agreed how to judge.
Step three and step four
Run the test with tools that keep setup and reporting simple. For lightweight website experimentation, teams often use platforms like Otter A/B that can split traffic, define goals, and surface significance without building a custom stack. That is often enough for a smaller team to move from opinions to measured outcomes.
Keep the pipeline lean outside the testing tool too. A spreadsheet or Airtable base can track hypotheses, launch dates, variants, segments, outcomes, and decisions. GA4 or your product analytics tool can confirm whether the lift showed up in the metric that matters. Session recordings, support tickets, and sales call notes help explain why a test won or lost.
Analysis needs discipline. Check the primary outcome first. Then review a small set of guardrail metrics such as lead quality, revenue per visitor, or activation rate. A variant that raises clicks but lowers pipeline quality is not a win. Smaller teams get better results when they answer three questions after every test: did the main metric move, did anything downstream get worse, and does the result support the original hypothesis?
Evidence should include the external market as well as site behavior. For category shifts, competitor positioning, or pricing changes, smaller teams can borrow simple research methods instead of building a formal intelligence function. This guide to applying web data to market intelligence shows how to add outside signals to your internal testing routine.
Step five
Store the lesson.
A lost test still has value if the team records what changed, why the idea looked plausible, who saw it, and what happened. A winning test needs the same treatment. Document the conditions. If a result only held for branded traffic or high-intent visitors, that detail matters when someone wants to reuse the idea three months later.
The pipeline becomes useful when it compounds. Over time, the team stops rerunning old arguments and starts building on prior evidence.
A short walkthrough helps when you're building the habit:
Field note: the fastest way to kill an experimentation culture is to treat every losing test as wasted effort. A losing test is often the cheapest bad decision you'll ever make.
Real-World Examples of Evidence in Action
Theory only sticks when you can see the workflow in an ordinary business setting. These aren't headline-grabbing transformations. They're the kinds of practical tests smaller teams run every week when they stop arguing in circles.

E-commerce checkout friction
An online store notices a pattern. Product pages convert reasonably well, cart adds are healthy, but too many users disappear during checkout. The team's first instinct is familiar. Redesign the entire flow, add more reassurance, and shorten everything at once.
That would produce movement, but not learning.
A better approach is to isolate one friction point. The team reviews session recordings, support messages, and form completion behaviour. They form a narrower hypothesis: a simpler checkout form may reduce hesitation for shoppers who are already ready to buy. Instead of rebuilding the whole journey, they test a shorter form against the current version and keep the rest of the flow stable.
The value of that process isn't just the final lift. It's clarity. If performance improves, the team has a plausible causal explanation. If it doesn't, they know the issue probably sits elsewhere, perhaps in delivery expectations, payment trust, or cart-level distractions.
SaaS onboarding drop-off
A software company has a different problem. Trial sign-ups look strong, but too many new users stall after account creation. On a dashboard report, that can look like a product issue. In practice, it's often a sequencing issue.
The team uses cohort analysis to compare users by signup month and activation path. They find that the drop-off happens before users reach the product moment that demonstrates value. That shifts the question from “Why are trials weak?” to “What stops users getting to first value quickly enough?”
The most useful evidence often changes the question before it changes the metric.
They test in-app guidance, clearer setup prompts, and lighter onboarding friction. Again, the point isn't magic. It's method. Problem, hypothesis, test, result, next step. That rhythm is what turns marketing and product improvement into a repeatable discipline instead of a series of isolated guesses.
Common Pitfalls and How to Avoid Them
Teams don't usually fail at evidence based marketing because they lack dashboards. They fail because they bring old habits into a new process.
The usual errors
Some mistakes show up early and keep repeating:
- Confirmation bias: You only notice the result that supports the idea you already liked. Write the hypothesis and success criteria down before launch.
- P-hacking: You keep slicing data or extending a test until something looks convincing. Decide the analysis window and primary metric before the experiment starts.
- Vanity metric obsession: You celebrate traffic, clicks, or form fills while revenue quality stays flat. Use commercial KPIs that reflect actual business movement.
- Analysis paralysis: You wait for perfect certainty and never ship the learning. Set a decision cadence so evidence leads to action, not delay.
What to track instead
For B2B teams especially, shallow reporting causes more damage than limited data. For true ROI, UK B2B marketers need to shift from leads to metrics such as Marketing Influenced Revenue and aim for an LTV:CAC ratio of 3:1. The same framework also points to Share of Model as a newer indicator of how often brands appear in AI-generated category responses, as discussed in the MRS paper on the business of evidence.
That doesn't mean every team needs a complex forecasting model tomorrow. It means your scorecard should reflect outcomes that matter to finance, sales, and leadership, not just marketing activity.
A simple rule helps here. If a metric can rise while the business gets worse, it's a supporting metric, not a north star.
Making Evidence a Habit Not a Project
The shift isn't from creativity to analysis. It's from isolated campaigns to a learning system.
Teams that get value from evidence based marketing don't wait for the perfect research programme. They ask better questions. They write clearer hypotheses. They run cleaner tests. They store what they learn and use it to shape the next decision. That's what makes the process compound.
This also changes stakeholder conversations. Instead of defending opinions, you can explain trade-offs, uncertainty, and next actions with a calmer level of precision. If that's an internal challenge for your team, this guide to communicating experiment results to stakeholders is worth keeping close.
You don't need a massive data science function to work this way. You need a shared standard. Evidence beats rank. Tests beat debates. Learning beats being right on the first try.
Start small. Pick one page, one funnel step, one campaign decision that keeps getting decided by instinct. Turn it into a hypothesis. Run the cleanest test you can. Then let the result decide what happens next.
If you want a simple way to start testing headlines, CTAs, layouts, and revenue-impacting page changes without building a heavyweight experimentation stack, Otter A/B gives teams a lightweight way to run website experiments and review results in a format that's easy to act on.
Stop guessing
Ready to start testing?
Set up your first A/B test in under five minutes. No credit card required.
- 14-day free trial
- No credit card required
- Cancel anytime