What Are Impressions in Digital Marketing and Analytics
Find out what are impressions in digital marketing, how they're counted, how they differ from reach and clicks, and how to use them in reporting and CRO.
An impression is counted each time content is rendered on a screen, not each time a person sees it. If one person reloads a page three times, that can create three impressions.
You're probably looking at a dashboard right now, seeing one big number, and wondering whether it means your campaign is working or just getting served a lot. That confusion is normal, because impressions sit right at the intersection of exposure, visibility, and reporting hygiene. They look simple, but they carry a measurement contract that marketers often read too casually.
What Are Impressions and Why Marketers Count Them
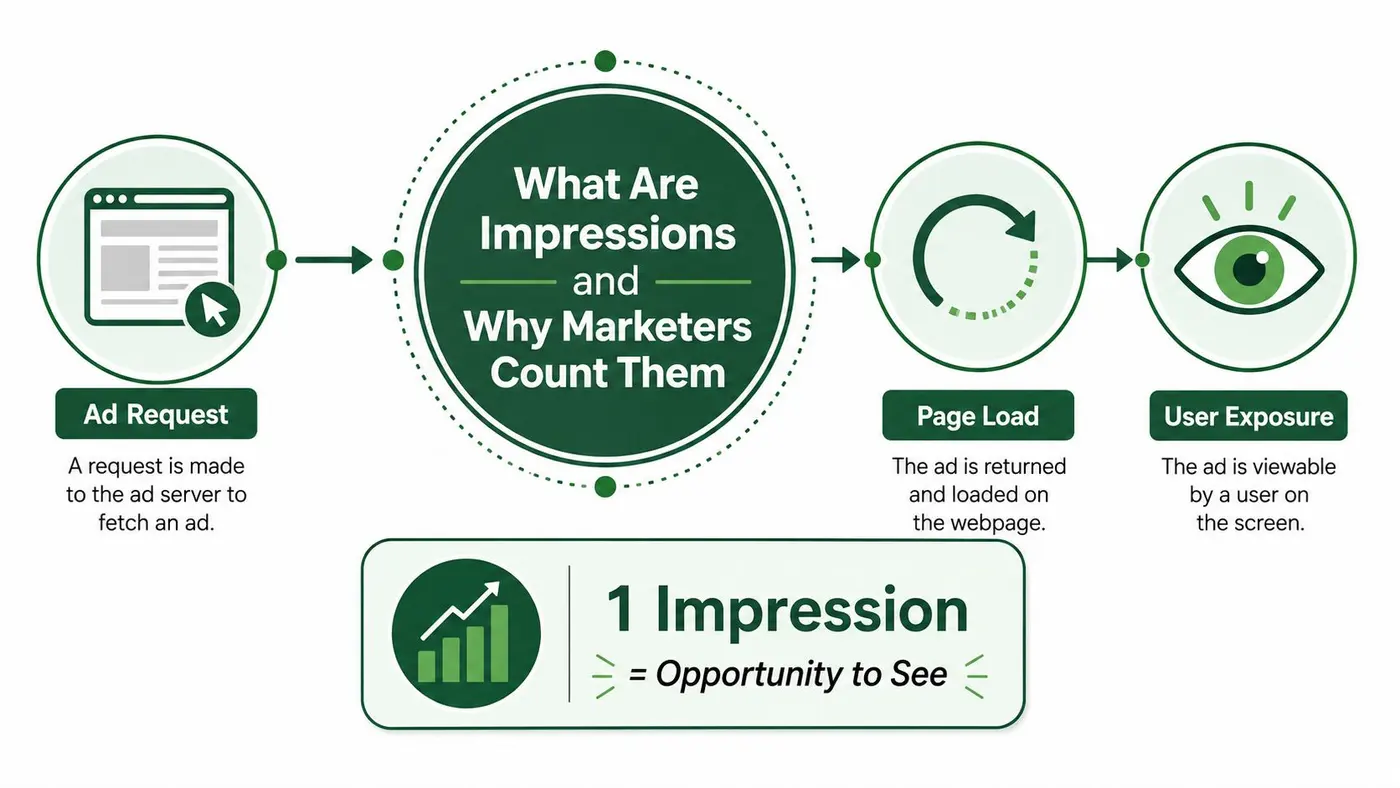
The cleanest way to think about what are impressions is this, an impression is a count of render events, not a count of people. In digital advertising, that means the same person can generate several impressions if the ad or piece of content appears multiple times, and that is exactly why impressions and reach are not the same thing. Reach counts unique people, impressions count exposures.
A reload analogy makes the rule stick. If you open a page, close it, and open it again, the page has been shown twice. The screen did the work twice, so the metric records two impressions, even though the audience was one person. That distinction matters because dashboard numbers often look bigger than human intuition expects, and a marketer who treats impressions like people will misread frequency, budget pressure, and top-of-funnel visibility.
The measurement contract behind the number
Google's own reporting language follows the same basic logic. In Search Console, an impression is counted when a result is shown in Google Search, Discover, or News, even if nobody clicks it, which is why impressions are such an important top-of-funnel SEO signal. A page can earn visibility without earning traffic yet, and that's a real state of the funnel, not a reporting error. Google's explanation of search reporting makes this distinction explicit in its definition of impressions, clicks, and CTR, which is why the metric sits so early in analysis rather than at the end of it. Google Search Console's definition of impressions and CTR
This is also why impressions matter in paid media. UK advertisers still buy and report a lot of inventory on an impression basis, because the metric is the shared denominator for exposure and frequency across search and display. If a campaign serves 1,000,000 impressions to 250,000 unique users, the average exposure is 4 per person. That's not automatically good or bad, it just tells you how often the same audience is being shown the message.
Practical rule: if a dashboard number doesn't tell you whether it counts people, exposures, or opportunities to see, don't trust your first interpretation.
That's also where attribution thinking enters the picture. Impressions don't prove impact on their own, but they do tell you how much of the journey was visible before any click or conversion happened. If you want a deeper look at how visibility ties into outcome analysis, how attribution drives ROAS is a useful companion read.
How Impressions Differ From Reach, Clicks, Views and CTR
Marketers get tripped up because four common metrics can live in the same report and point to very different things. Impressions measure exposure, reach measures unique people, clicks measure deliberate action, and CTR measures the share of impressions that turned into clicks. A video view is another layer again, because a platform may only count it once a person has watched long enough to meet that platform's definition.
| Metric | What it counts | Relationship to impressions |
|---|---|---|
| Impressions | Every time content is shown | The base exposure count |
| Reach | Unique people exposed | Usually lower than impressions because one person can see content more than once |
| Clicks | User actions on the ad or result | A subset of impressions that led to engagement |
| Views | Platform-defined viewing events, often for video | Can be lower than impressions because not every impression becomes a view |
| CTR | Click-through rate | Clicks divided by impressions |
Reading the funnel without mixing the terms
The simplest way to read the table is to start at the top. Impressions tell you how much the content was surfaced. Reach tells you how widely it spread across people. Clicks and views tell you who moved from exposure into engagement, but they don't replace the exposure count underneath them.
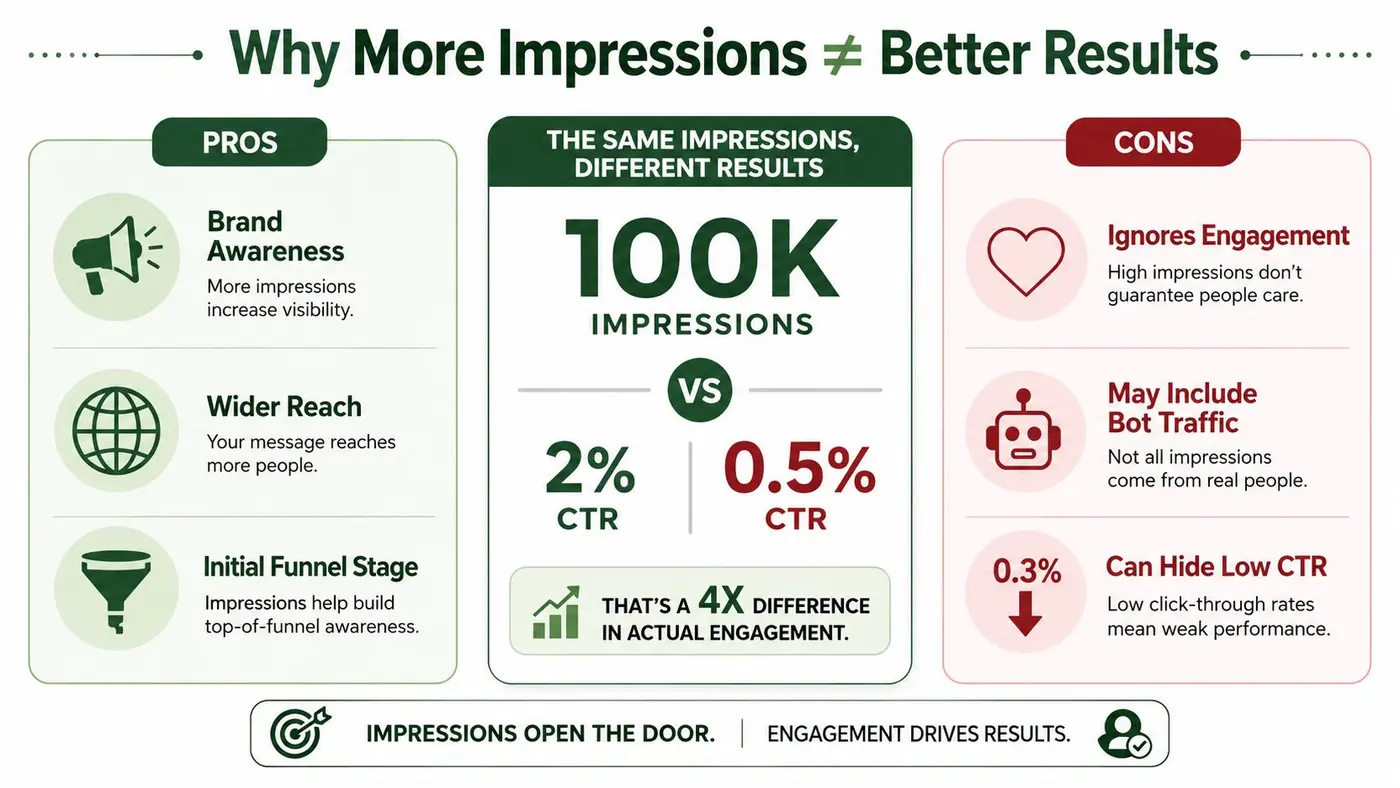
CTR is the easiest ratio to misstate, which is why a direct calculation matters. If a page gets 50 clicks from 10,000 impressions, CTR is 0.5%. The relationship is straightforward, but the reporting mistake usually comes from treating clicks as the main story and forgetting the denominator that made those clicks possible. For a practical walkthrough of that ratio, see this guide on how do you calculate click-through rate.
Impressions tell you what was shown. Clicks tell you what was chosen. CTR tells you how efficiently one became the other.
A video can have more impressions than views because not every person who is served the asset watches it long enough to count as a view. That doesn't mean the campaign failed, it means the viewer's behaviour didn't clear the platform's threshold. Once you separate these definitions, campaign reports stop feeling contradictory and start behaving like different layers of the same funnel.
Served, Raw, Viewable and Search Impressions Explained
Not every impression is earned under the same rulebook. Some are counted as soon as content is served, some are recorded as raw delivery, some are filtered through a viewability standard, and some come from search surfaces where the page appears in the results. The difference matters because a number can look large while still describing very different kinds of exposure.
The four flavours you'll see in practice
A served impression usually means the ad server responded and delivered the creative. A raw impression is the unfiltered total before deeper quality checks trim the count. A viewable impression is stricter, and the IAB/MRC standard says a display ad counts only when at least 50% of the ad is in view for 1 continuous second, while video uses 2 seconds in view. A search impression happens when a result is shown on the page in Google Search, Discover, or News, even if the user doesn't click it. The IAB/MRC standard is the clearest reference point for this distinction. IAB/MRC Viewable Ad Impression Measurement Guideline
That hierarchy is why vendors can report very different numbers while still claiming to be right. They're often measuring at different stages of the same chain. One platform may count a served ad the moment it loads, while another only wants to count the exposure if it had a chance to be seen.
A simple example that exposes the gap
A user opens a page, the ad slot loads, and the creative is recorded as an impression. Then the user scrolls fast and moves past the slot before it has time to sit in view. In that case, the ad was served and may be counted in a basic delivery report, but it didn't satisfy the stricter viewability threshold. That's the key difference between “shown” and “seen well enough to matter.”
Useful habit: whenever a vendor gives you an impressions number, ask which rule produced it, served, raw, viewable, or search.
This is the point where marketers should stop treating impressions as a single universal fact. They're a measurement family, and the family members don't mean the same thing.
Where Impressions Fit in A/B Testing and CRO Reporting
In experimentation, impressions become the exposure denominator. They tell you how many times a variant had the chance to be seen before anyone clicked, converted, or bounced. That's why a CRO dashboard isn't really complete without impressions, conversions, and revenue sitting together, because the variant's story starts with exposure and ends with outcome.
Why exposure rate matters
If one variant gets traffic but doesn't receive the impressions it should, the test is suspect. A missing impression usually points to a rendering issue, a flicker problem, or a timing mismatch between the experiment and the page. In plain terms, the test may be failing to show the variant cleanly, which means the result can't be trusted even if the conversion number looks tidy.
That's where exposure rate becomes a guardrail. If traffic is assigned to a variant but the variant isn't rendered consistently, the experiment has a measurement problem, not a winning headline. Dashboards make this obvious only when teams are honest about what the exposure count represents.
How to read the numbers together
A sensible CRO report asks a simple question, did the exposed users behave differently once the variant appeared? Impressions tell you the eligible exposure pool, conversions tell you how often the page or offer won the interaction, and revenue shows whether the effect was commercially meaningful. If those three numbers move in different directions, the story is usually in the rendering, targeting, or implementation layer.
A good dashboard also avoids making impressions look like a vanity metric. The number only becomes useful when it helps you judge whether a variant had fair visibility. That's why clean reporting matters, and why many teams build their experiment views around a shared definition of events and goals. A practical reference for structuring that kind of reporting is dashboard creation.
If a variant didn't get fair exposure, the conversion result may be technically measurable and practically misleading.
That's the mental model to keep. Impressions are not the victory, they're the condition that lets you judge the victory.
Why More Impressions Do Not Always Mean Better Results
A high impressions number can look healthy while hiding waste. Bots can inflate delivery, users can reload pages, placements can sit below the fold, and frequency can keep rising after the message has already stopped adding value. The count goes up, but the business outcome doesn't necessarily follow.
Where impression inflation comes from
The first problem is simple duplication. A person who reloads a page or returns to the same content creates another impression, even if their attention hasn't changed. The second problem is attention leakage, where a page or ad loads but the user never really sees it. The third problem is automation, where bot traffic can add noise to delivery counts if the platform doesn't filter it correctly.
Viewability is what keeps this honest. The IAB/MRC standard exists because being served is not the same as being seen with enough quality to matter. If the content falls below the viewable threshold, the raw delivery can still be counted upstream, but the meaningful exposure story gets weaker.
Why frequency can turn into waste
Frequency is useful until it isn't. Once the same audience keeps seeing the same creative, each extra impression may contribute less and less to awareness while continuing to consume budget. In that situation, the campaign hasn't improved its reach, it has only deepened repetition.
Rule of thumb: the question is rarely “how many impressions did we get?” It's “how many useful exposures did we buy, and what happened after them?”
That's why impressions need companions. Viewability tells you whether the exposure was credible, frequency tells you whether it was overdone, and downstream metrics tell you whether the exposure changed behaviour. Without those checks, a big number can flatter a campaign that is underperforming.
A Practical Checklist for Measuring Impressions Correctly
Counting impressions well is mostly a measurement discipline, not a creative problem. If the tracking setup is off, the report will lie politely and consistently, which is worse than a noisy number because it feels dependable.
A short checklist worth using on every setup
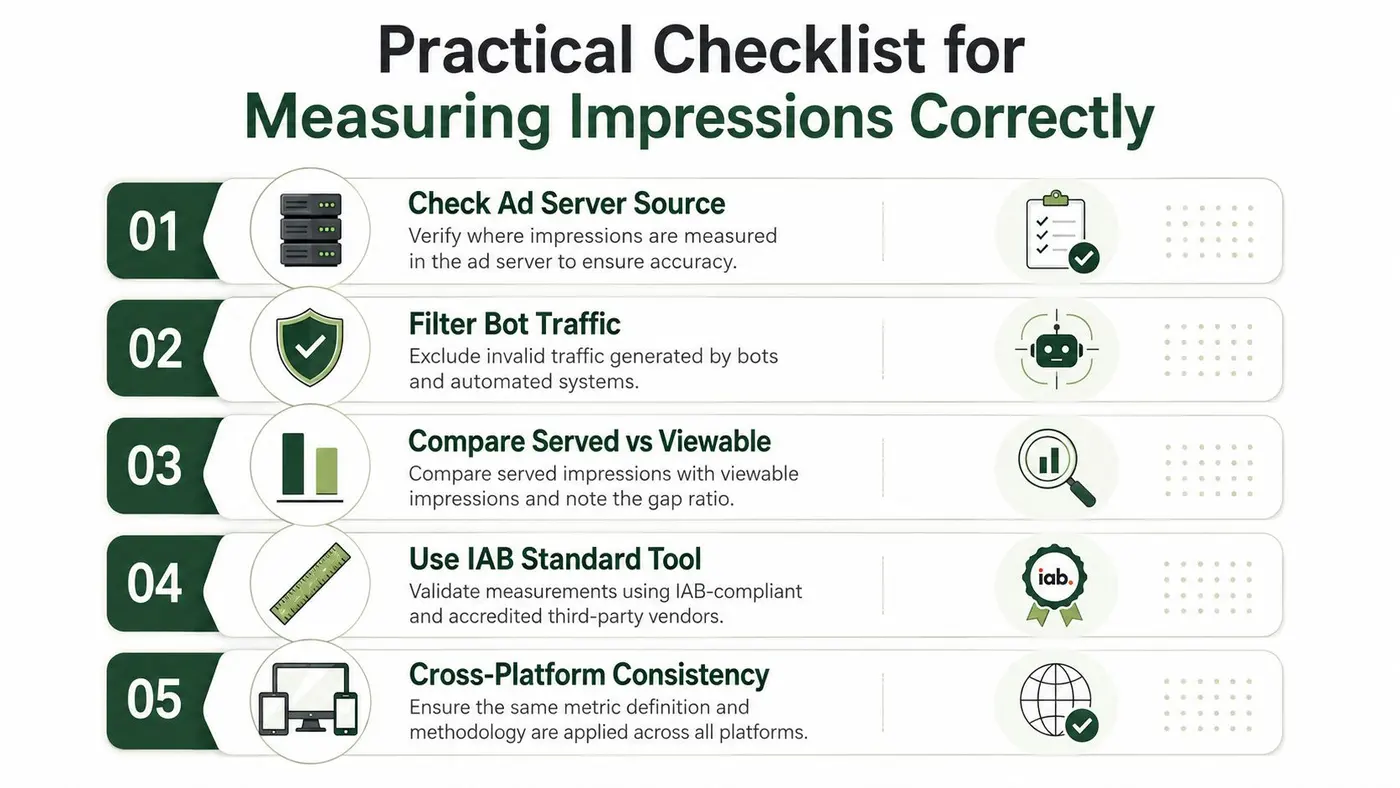
- Check the ad server source. Make sure the impression fires where the creative is rendered, not where someone merely intended to see it.
- Filter bot traffic. Automated visits distort exposure counts, so exclude known non-human activity wherever your stack allows it.
- Compare served and viewable impressions. The gap tells you whether the campaign is buying real attention or just delivery volume.
- Use a standard viewability tool. Align measurement with the IAB-style definition so your numbers mean something outside one platform.
- Keep cross-platform definitions consistent. If one platform counts on load and another counts on view, you need to normalise before comparing them.
The reason this list matters is simple, consistency beats confidence. A small difference in counting logic can make two dashboards look like they're describing two different campaigns when they're only applying different contracts.
Client-side and server-side counting need discipline
Client-side counting happens in the browser, while server-side counting happens closer to the delivery layer. Neither is wrong on its own, but mixing them without a clear normalisation rule creates inconsistent reporting across channels and analytics tools. When a team inherits a messy account, this is usually where the mismatch starts.
Consent also matters in a privacy-first environment. The more you rely on consented and first-party measurement, the more important it becomes to know which impressions are comparable and which ones are only comparable in a loose sense. If you need a broader implementation lens, the conversion tracking with Google Analytics guide helps anchor the rest of the funnel.
Tactics to Improve Impression Quality and Avoid Wasted Exposure
The point isn't to chase more impressions, it's to buy better ones. Better impressions come from tighter targeting, stronger creative fit, cleaner placement selection, and less repetition than the audience can comfortably absorb. That's especially important when the same campaign can look healthy on delivery and weak on outcomes.
What to change first
Start with targeting. If the audience is too broad, your impression count grows while relevance drops. Then look at frequency caps, because uncontrolled repetition can turn a decent campaign into expensive background noise. If you're running Amazon DSP, Adbrew's guide on managing ad frequency on Amazon is a useful reference point for thinking about repetition without overexposure.
Creative fit comes next. A message that matches the placement and context usually earns better attention than a generic asset pushed everywhere. That's true for display, social, and search-adjacent placements, because the user's mindset changes by surface.
Audit the measurement before you optimise the media
If the tracking is sloppy, the optimisation will be too. Reconcile platform counts with first-party analytics, check whether your pixel fires on render, and confirm that viewability thresholds are aligned across vendors. When buyers compare raw CPM with a more honest viewable CPM mindset, they usually spot where their spend is buying exposure that never had much chance to matter.
Best lens: optimise for useful exposure, not the largest possible counter in the dashboard.
That's how impression quality improves in practice. You remove irrelevant delivery, reduce overexposure, and keep the counting model honest enough that the number means something beyond reach inflation.
Common Questions About Impressions Answered
Are impressions the same as views? Not usually. A view is often a stricter event, especially in video and display, because it implies the content was not just served but seen under a platform's viewability rule.
How are impressions measured now that third-party tracking is weaker? More teams lean on first-party and consented measurement, plus platform-native reporting. That makes it even more important to know which system is counting served delivery, which one is counting viewable exposure, and which one is describing search visibility.
Can high impressions be a bad sign? Yes. If frequency rises faster than useful engagement, the campaign may be overexposed. High impressions can also signal duplication, below-the-fold placement, or counting that includes activity with little real attention.
Are ad impressions and organic impressions the same thing? Not exactly. In paid media, impressions usually mean ad delivery. In Google Search Console, impressions mean a result appeared in search, Discover, or News. The word is the same, but the reporting context is different.
If you want to read dashboards with less guesswork and test more accurately, visit Otter A/B. It's built for teams that want clean experiment data, fast page performance, and a clearer link between exposure and conversion. If impressions are the starting point of your measurement story, Otter A/B helps you follow that story all the way to a real business decision.
Stop guessing
Ready to start testing?
Set up your first A/B test in under five minutes. No credit card required.
- 14-day free trial
- No credit card required
- Cancel anytime