WooCommerce AB Testing That Actually Grows Revenue
Learn WooCommerce AB testing step by step — install your SDK, set revenue goals, split traffic and read results with confidence. Practical guide for UK stores.
You've changed the product-page headline, brightened the Add to Cart button, and watched the variant edge ahead in your dashboard. Then the weekly revenue report arrives. Orders haven't improved, average order value is lower, and mobile checkout abandonment has crept up. The “winner” looked convincing until you measured what the store earns.
That's the trap with WooCommerce A/B testing. The work isn't about producing a prettier page or finding a fast click-through win. It's about proving that a change creates more revenue per visitor without damaging checkout completion, mobile usability, or Core Web Vitals. UK stores also need particular discipline because modest baseline conversion rates make small improvements difficult to verify.
Why WooCommerce AB Testing Feels Harder Than It Should
A store owner I worked with once tested a shorter product description against the original. The new version made the page feel cleaner, and the Add to Cart rate moved up in the first few days. The team was ready to roll it out across the catalogue.
Then the purchase report landed. The shorter description drove more early clicks, but fewer shoppers reached checkout, and revenue per visitor fell. The experiment did not prove the idea was bad. It showed that a nicer-looking page can still lose money.
WooCommerce testing gets messy fast because the page you see is rarely the only thing changing. A theme can alter templates, a page builder can add scripts, and plugins can change cart fragments, payment methods, shipping notices, personalisation, or checkout fields. Caching can serve the wrong variation. A checkout customisation may affect one device or traffic source and leave another untouched.
That makes a button test feel like a test of the whole delivery stack. If one variant loads later, shifts the layout, or fires extra scripts, performance becomes part of the result. A product-page change can also change what shoppers add to the basket, so conversion rate alone can hide a lower basket value.
Practical rule: Treat every experiment as a change to a buying journey, not just a change to a page element.
UK stores have less room for sloppy tests. The UK cohort cited earlier shows how few experiments produce a clear winner, so weakly powered tests are easy to misread. Another benchmark summary puts typical UK WooCommerce conversion in the low single digits, and broader UK and Irish ecommerce tracking points in the same direction. That means you need enough sessions to separate signal from noise, especially on mobile where checkout friction shows up quickly.
A store can burn weeks on experiments that answer the wrong question. A shorter backlog of well-defined tests, each tied to revenue per visitor and sized with enough traffic, produces fewer launches but better decisions. A plain guide to A B testing by Data is useful if you want the method itself before you start changing the store.
What to Prepare Before You Test Anything
Start with the business problem, not the element you'd like to redesign. “Test the CTA” is an activity. “Shoppers add products to the basket but fail to complete payment on mobile” is an actionable observation that can produce a meaningful hypothesis.
Write one primary goal for the experiment. For most WooCommerce tests, that goal should connect directly to completed purchases, revenue per visitor, or average order value. Add to Cart and checkout-start events can explain the funnel, but they shouldn't automatically decide which variant ships.
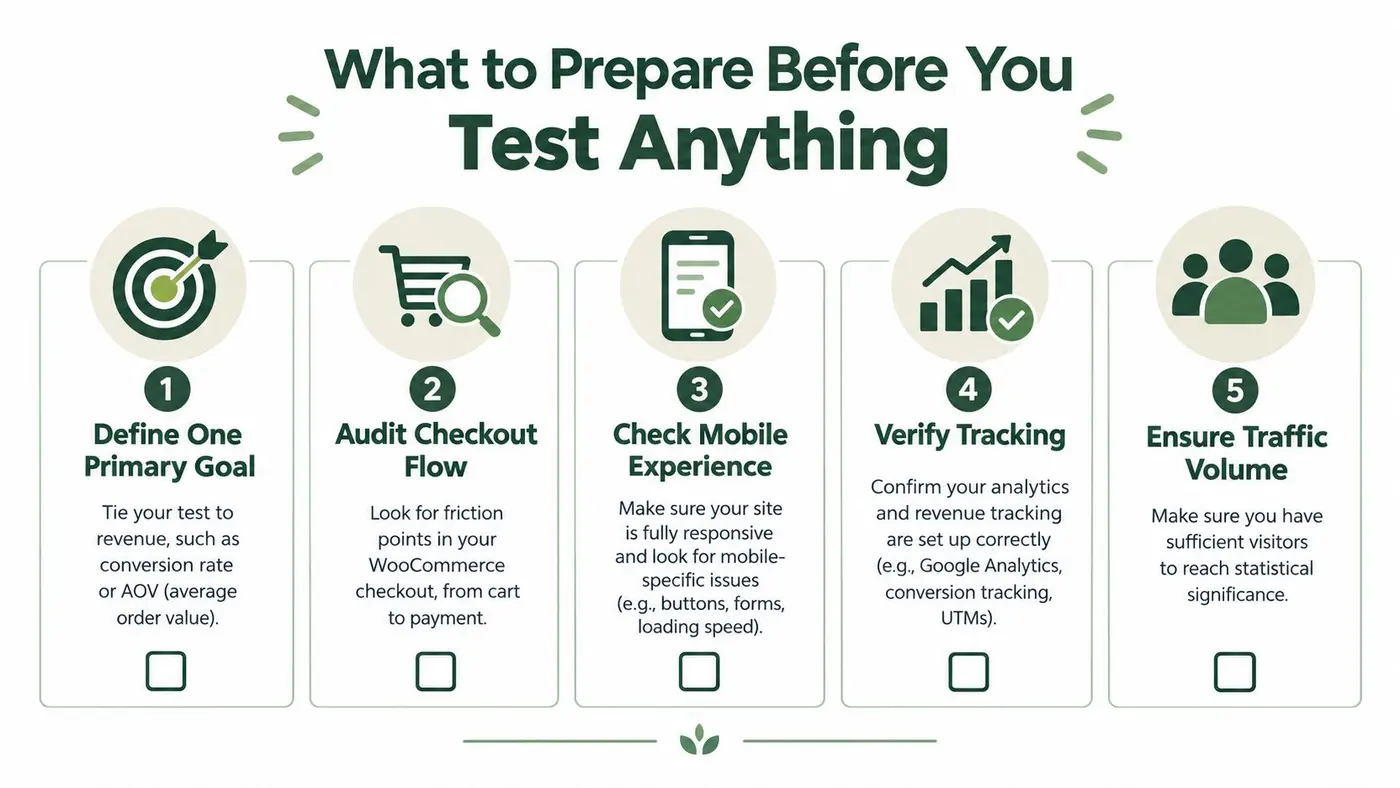
Run the pre-flight checks
- Define one primary goal: Tie the hypothesis to a commercial outcome such as conversion rate, revenue per visitor, or average order value.
- Audit the checkout flow: Walk through product, cart, shipping, payment, confirmation, and email fulfilment as a customer. Record friction rather than assuming a headline is the cause.
- Check the mobile experience: Inspect tap targets, variant selectors, sticky elements, payment options, keyboard behaviour, and layout shifts on real devices.
- Verify tracking: Confirm that product views, Add to Cart, checkout, purchases, order values, refunds, and variant assignments reach the same reporting system.
- Ensure traffic volume: Estimate whether the store can collect enough sessions per variant to detect the intended effect before committing the test.
The tracking check deserves more attention than it usually gets. Place test orders through each experience, including variable products, discounts, shipping rules, failed payments, and guest checkout if those paths matter. Confirm that the order value belongs to the correct variation and that returning users don't switch between experiences.
Keep the hypothesis narrow
A useful hypothesis names the audience, friction, intervention, and expected business result. For example: “If delivery timing appears beside the purchase action for mobile visitors, more qualified shoppers will complete checkout because uncertainty is reduced.” That gives you something to evaluate beyond whether the new message receives attention.
Avoid combining unrelated changes in a low-volume test. A new gallery, shorter copy, different price, and altered checkout message may produce a result, but you won't know which decision caused it. If you need to test a complete landing-page concept, label it as such and accept that the result will validate the experience as a package rather than isolate one component.
Exclude traffic that can distort the decision, such as internal staff, monitoring tools, known bots, or a campaign audience that won't continue after the test. Don't exclude inconvenient customers just because they make the data noisier. Their behaviour is part of the store's commercial reality.
Installing Your Experimentation SDK and Defining Goals
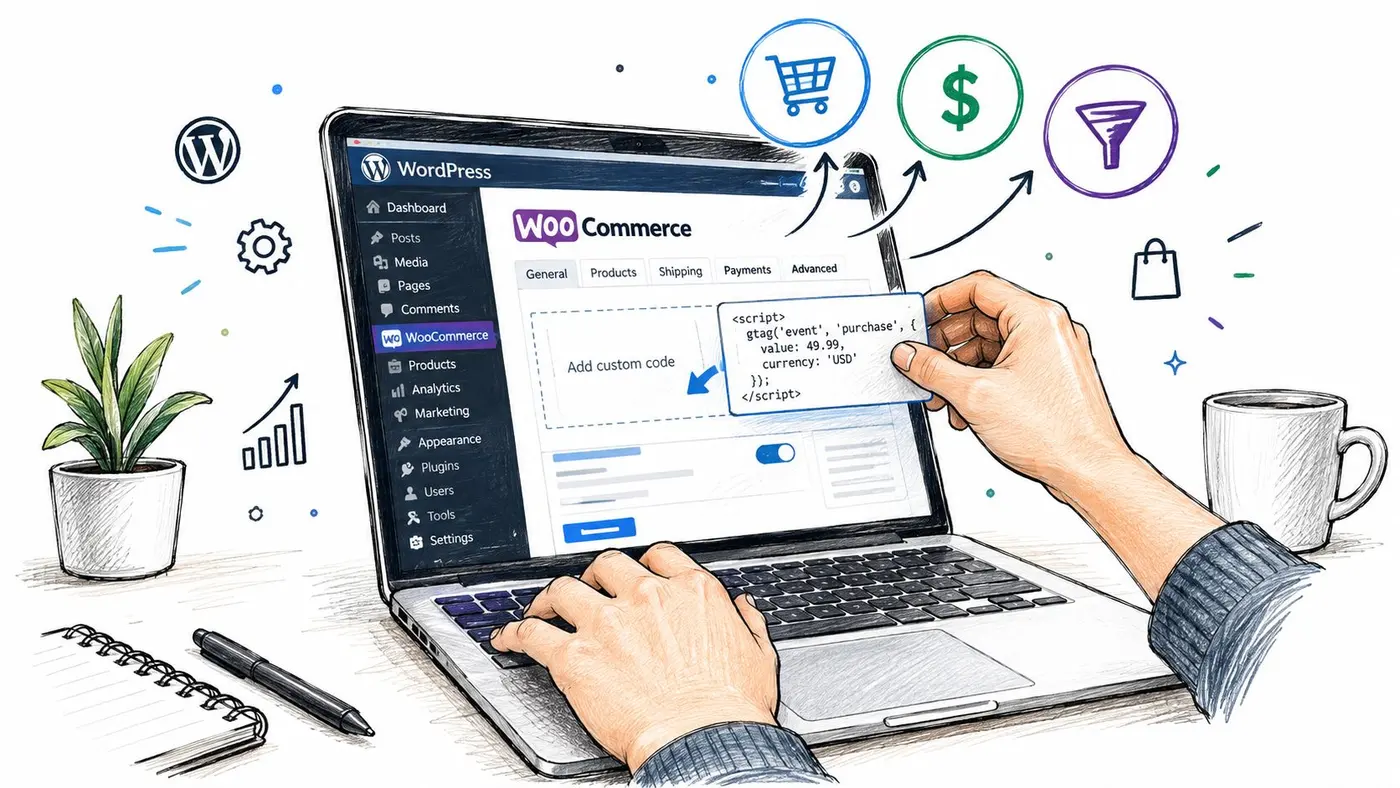
Start by installing the experimentation snippet through WordPress, a WooCommerce integration, Google Tag Manager, or the platform's documented path. Keep the implementation light. Then verify that the script loads before visitors can interact with the test, and that caching or consent controls do not block assignment.
For a WooCommerce-specific setup, follow the Otter A/B WooCommerce getting started documentation and test the full journey before any meaningful traffic reaches the variant. Check that the same visitor keeps the same experience, that cart state survives page changes, and that the completed order carries the right experiment attribution.
Build variants around a hypothesis
Create the control first, then change only what the hypothesis needs. If the question is about delivery reassurance on a product page, leave the gallery, pricing, template, and checkout alone. If the test is about checkout flow, compare the current field arrangement with a simplified version, but keep payment and shipping logic valid.
A visual editor is fine for headlines, CTAs, banners, and layout blocks. Native WooCommerce data needs more care. Price, stock, product variations, tax display, shipping eligibility, and cart behaviour must stay coherent from entry point to purchase. A variant that looks right on the product page but changes at checkout is not a valid experience.
Set the primary purchase goal before launch. Add supporting events for product views, Add to Cart, checkout starts, payment errors, and completed orders. Those events show where the variants diverge, while revenue per variant shows whether the difference matters commercially.
Track average order value and revenue where the platform supports it. A lift in conversion rate can still lose money if the variant draws smaller baskets or depends on a deeper discount. A variant with fewer orders can still deserve a rollout if each completed order is worth more.
Protect performance during delivery
Client-side experimentation can cause flicker, extra requests, or layout shifts if it loads carelessly. Keep the implementation lean, avoid stacking testing scripts, and inspect the page with the experiment enabled on a throttled mobile connection. A winning variant that slows checkout is not a winning variant.
Core Web Vitals provide useful guardrails. Google's web.dev guidance sets LCP under 2.5 seconds and INP under 200 milliseconds as targets, and that should sit beside the experiment result, not in a separate technical queue. Small delays change behaviour, especially on mobile pages that already carry a lot of script weight.
Give stakeholders a preview URL or controlled access so they can inspect each variant before launch. Check logged-out and returning sessions, desktop and mobile layouts, cached pages, consent states, and the full purchase confirmation. Then launch with the traffic allocation you planned, not the one that feels safer in the moment.
How to Split Traffic and Size Your Test Correctly
Treat traffic allocation as a statistical decision rather than a dashboard preference. A 50/50 split usually gives the control and variant evidence at similar rates, so it is the right default for a two-variant test. A weighted split can protect revenue when a change feels risky, but it also slows down learning for the smaller group.
Start with the baseline conversion rate and the minimum detectable effect, or MDE. The baseline shows how often the current experience converts. The MDE defines the smallest lift worth detecting. If your store converts at a low rate and you are chasing a modest improvement, the sample requirement climbs fast.
The UK cohort cited earlier found that the median experiment needed 14,800 sessions per variation to detect a 5% minimum detectable effect on a 3% baseline conversion rate, using 95% confidence and 80% power. Confidence is the bar for limiting false positives. Power is the chance that the test catches a real effect of the size you planned for.
Use the baseline to set expectations
A store converting around 2% gets fewer purchases per session than a store converting around 4%. To detect the same relative improvement, the lower-baseline store usually needs more visitors per variant. That is why “we ran it for a week” says very little without the baseline, target lift, allocation, and traffic pattern.
The table below turns that UK benchmark into planning ranges. They are not guarantees. They are a practical check on whether a test is realistic, and the exact requirement should come from a proper calculator such as this sample-size calculation guide.
| Baseline Conversion | Target Lift | Sessions per Variant | Implication for Test Duration |
|---|---|---|---|
| 1.5% to 2.5% | 5% | Plan for a substantial sample, often around the UK benchmark requirement | Run across a representative buying cycle, not just a short campaign window |
| Around 3% | 5% | 14,800 sessions per variation in the cited UK cohort | Expect a longer collection period unless traffic is consistently strong |
| Around 4% or above | 5% | Usually less demanding than a lower baseline, but calculate before launch | Avoid ending early, and include normal weekday and campaign variation |
| Any baseline | 10% or more | Potentially less demanding than a 5% target, but still calculate | Use the expected traffic pattern and protect against seasonal distortion |
Do not treat payday, promotions, stock changes, or shipping cut-offs as background noise. UK shoppers can behave differently around salary timing and major campaigns, so a test that spans only one unusual period may not generalise. Keep the experience and measurement rules stable, document interruptions, and restart analysis if a material implementation change invalidates the earlier data.
Reading Results Without Fooling Yourself
A dashboard showing a leading variant is only a signal. A decision needs stable assignment, a pre-declared primary metric, enough sample, and evidence that the apparent lift holds up under scrutiny.
For a frequentist test, a 95% confidence threshold is the stated bar for calling a winner in the Otter A/B setup. Read the result alongside absolute conversion rate, relative difference, confidence interval, sample count, revenue per visitor, average order value, and funnel progression. The A/B testing statistical significance explanation gives the technical context, while the founder-friendly statistical significance guide is useful when non-specialists need the concept explained plainly.
Revenue per visitor is the commercial check
Conversion rate answers one question, whether a visitor completed the defined conversion. Revenue per visitor asks a better commercial question, how much revenue the experience generated for the traffic it received.
That distinction matters when variants change price, discounts, product mix, bundles, shipping messages, or upsells. A variant can generate more orders while pulling in lower-value baskets. Another can reduce order count but increase average order value enough to produce stronger revenue per visitor.
Read the funnel as a diagnosis, not a scoreboard of alternative winners:
- Product view to Add to Cart: Shows whether the offer and product presentation create enough confidence to start buying.
- Add to Cart to checkout: Highlights cart, shipping, stock, coupon, and surprise-cost friction.
- Checkout to purchase: Exposes payment, form, delivery, trust, and technical failures.
- Purchase value by variant: Connects the experience to revenue rather than stopping at the first successful event.
Don't peek until the story looks favourable
Checking results every morning pushes teams toward early calls. Random fluctuation can make one variant look decisive before the planned sample arrives, especially on a store with a low baseline. Predefine the stopping rule, then wait for the test to reach the planned evidence unless a serious implementation or customer-safety issue requires intervention.
Once the primary result is established, inspect device type, traffic source, landing page, new versus returning visitors, and relevant product categories. Segmentation should explain the result, not rescue a losing variant by searching until one subgroup looks positive. Treat small segments as directional evidence unless they were part of the original hypothesis.
Speed belongs in the final review. The performance guidance cited in the implementation section reported a UK fashion-store rebuild that cut mobile load time from 6.1 seconds to 1.4 seconds while preserving the design. Your test does not need to recreate that outcome, but it should confirm that the variant has not worsened LCP, INP, layout stability, checkout responsiveness, or abandonment.
Ship a winner when the primary metric, revenue trend, technical health, and operational checks agree. Iterate when the result is promising but inconclusive. Archive a losing idea with the reason, because an inconclusive or negative result can still prevent a costly site-wide rollout.
Turning One Test Into a Repeatable Growth Habit
A testing programme becomes useful when it changes how the team makes decisions. Record the hypothesis, audience, allocation, primary metric, launch conditions, result, technical observations, and implementation decision. Store the learning somewhere the next marketer, developer, or agency can find it before proposing the same change again.
Prioritise problems close to revenue. Checkout friction, cart clarity, mobile interaction, delivery information, payment presentation, and product confidence usually deserve attention before another isolated headline experiment. That doesn't make copy tests worthless. It means the test should address a known hesitation and be judged by the value it creates beyond the click.
Keep the operating rhythm simple
A practical workflow looks like this:
- Review the funnel: Find the largest commercially important drop-off or the clearest customer complaint.
- Write one hypothesis: Name the audience, intervention, reason, and primary revenue outcome.
- Check feasibility: Confirm tracking, sample requirements, stock, promotions, seasonality, and performance constraints.
- Run one clean test: Keep the allocation and experience stable until the stopping rule is met.
- Decide and document: Ship, iterate, or archive the result with the evidence and caveats attached.
- Feed the next backlog: Turn unresolved questions and observed friction into the next set of hypotheses.
Protect Core Web Vitals as part of that rhythm. Use lightweight variants, remove experiments that no longer serve a decision, and avoid layering scripts onto a checkout that already carries payment, analytics, consent, chat, and personalisation code. A fast control can beat a slower variant even when the slower version has stronger on-page persuasion.
The best WooCommerce AB testing teams don't chase constant wins. They build a reliable evidence trail. Over time, that trail helps marketing choose stronger offers, product teams simplify buying journeys, developers prioritise performance work, and leadership evaluate revenue rather than screenshots of a dashboard.
Start with one high-value journey this week. Audit its tracking, calculate the required sample, choose a revenue-centred hypothesis, and write down the conditions under which you'll ship the result.
Otter A/B lets WooCommerce teams create variants, split traffic, and track purchases, average order value, revenue, and revenue per visitor while keeping experiments lightweight. Set up your first revenue-focused test and invite your team to review the outcome through Otter A/B.
Stop guessing
Ready to start testing?
Set up your first A/B test in under five minutes. No credit card required.
- 14-day free trial
- No credit card required
- Cancel anytime